Experimental Biology Refresher Course VentilationPerfusion Relationships in the

Experimental Biology Refresher Course Ventilation/Perfusion Relationships in the Lung Robb Glenny, M. D. University of Washington

Overview of Approach • Review nomenclature and abbreviations • Begin with lung as single unit – Relationships between PO 2, PCO 2, alveolar ventilation, and blood flow – Alveolar gas equation – No Alveolar-arterial differences in PO 2 • Introduce additional lung units with mismatch between V and Q – Alveolar-arterial differences in PO 2

Overview of Approach • Discuss passive and active mechanisms matching regional V and Q • Provide clinical examples 3
 Mixed venous PA Pa Ca • Q (ml/min)")
Schematic lung unit • VA (ml/min) Mixed venous PA Pa Ca • Q (ml/min)

Nomenclature gas P AO 2 Partial Pressure Alveolar Cv. O 2 venous Content Pa. CO 2 arterial Fraction F IO 2 inhaled

• VA P AO 2 • Q • P AO 2 = P IO 2 - VO 2 • VA • PB where PB is barometric pressure

• VA • VCO 2 • Q PACO 2 • VA • PACO 2 α VCO 2 • VA

8

Alveolar PO 2 and PCO 2 • Determined by the ratio between ventilation and blood flow: V/Q. • PO 2 and PCO 2 are inversely related through alveolar ventilation. • Increasing V/Q produces higher PAO 2 and lower PACO 2. – Hyperventilation defined as PACO 2 < 40 • Decreasing V/Q produces lower PAO 2 and higher PACO 2. – Hypoventilation defined as PACO 2 > 40

Alveolar Gas Equation • P AO 2 = P IO 2 - VO 2 • VA • • PB PAO 2 = FIO 2 • (PB-47)- R= VCO 2 • • VCO 2 PACO 2 α • VA VO 2 Pa. CO 2 R Pa. CO 2 = where R is respiratory quotient • VA

Hypoxemia • Less than normal partial pressure of Oxygen in arterial blood – Normal Pa. O 2 ~ 90 mm. Hg – Age dependent • ~70 mm. Hg at 70 years of age • Five causes of hypoxemia – 2 are due to decreased alveolar PO 2

Low PIO 2 -> hypoxemia • Altitude – FIO 2 = 0. 21 everywhere – Barometric pressure (PB) • Seattle 760 mm. Hg • Denver 630 mm. Hg • Mt. Rainier 430 mm. Hg • Mt. Everest 225 mm. Hg • PAO 2 = 30 mm. Hg on Rainier without compensatory mechanisms

Compensation for Altitude • VA P a. O 2 • Q • VCO 2 Pa. CO 2 • VA

Hypoventilation →hypoxemia • VA P AO 2 P a. O 2 • Q

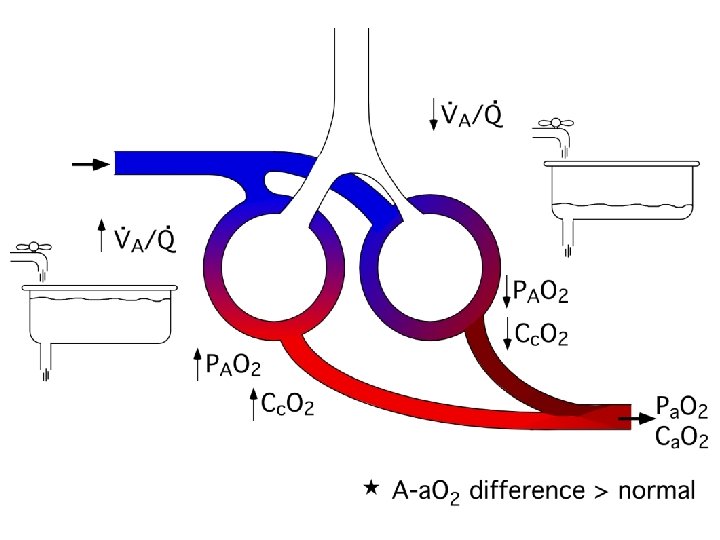
Alveolar-arterial O 2 difference • One measure of efficiency of gas exchange across alveolar-capillary membrane. • Helpful in determining cause of hypoxemia and making clinical decisions. • In conditions where hypoxemia is due to low alveolar PO 2, the A-a O 2 difference is normal.

where CC is content in end capillary blood P v. O 2 P AO 2

Ventilation-Perfusion Mismatch • Differences in airway geometry and lung expansion produce uneven regional ventilation. • Differences in vascular geometry and hydrostatic pressures produce uneven regional blood flow. • V/Q ratios vary across regions within normal healthy lung. • Pathologies that lead to regional changes in ventilation (e. g. asthma) or changes in perfusion (e. g. pulmonary embolism) will increase V/Q mismatch.
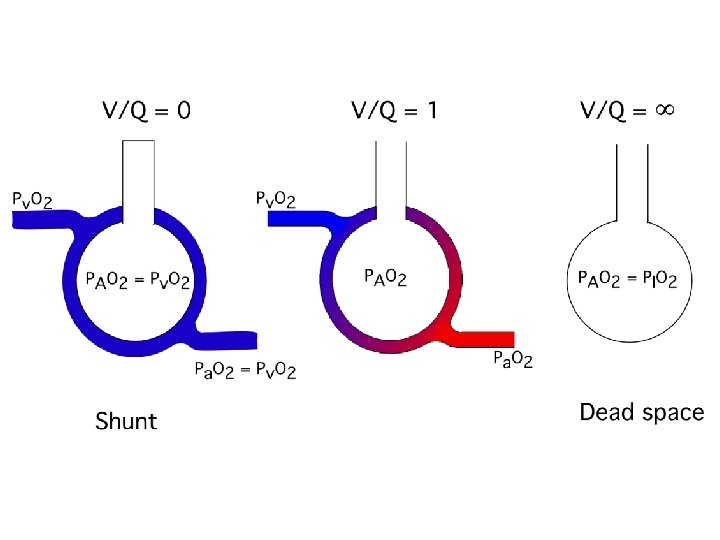

Shunt Dead space

Review/Introduce • Partial pressures of O 2 • Content of O 2 • Hgb-oxygen dissociation curve • Determinants of Alveolar PO 2 and PCO 2.
- PACO 2/R ~ 100")
PAO 2 = 0. 21 X (PB- PH 2 O)- PACO 2/R ~ 100 mm. Hg Pa. O 2 = 100 mm. Hg Ca. O 2 = solubility x Pa. O 2 0. 003 ml O 2/d. L plasma/mm. Hg 0. 3 ml/d. L Ca. O 2 = 1. 39 x Hgb x %sat 1. 39 ml O 2/g Hgb 20 ml/d. L

Hemoglobin-Oxygen Dissociation Curve Plasma without Hgb

PO 2 = 100 PO 2 = 40 + Vol. = 1 liter Hgb = 15 gm/d. L % sat = 98 CO 2 = 20. 7 ml/d. L O 2 = 207 ml = Vol. = 1 liter Hgb = 15 gm/d. L % sat = 70 CO 2 = 14. 8 ml/d. L O 2 = 148 ml Vol. = 2 liters Hgb = 15 gm/d. L O 2 = 355 ml CO 2 = 17. 7 ml/d. L % sat = ? PO 2 = ?
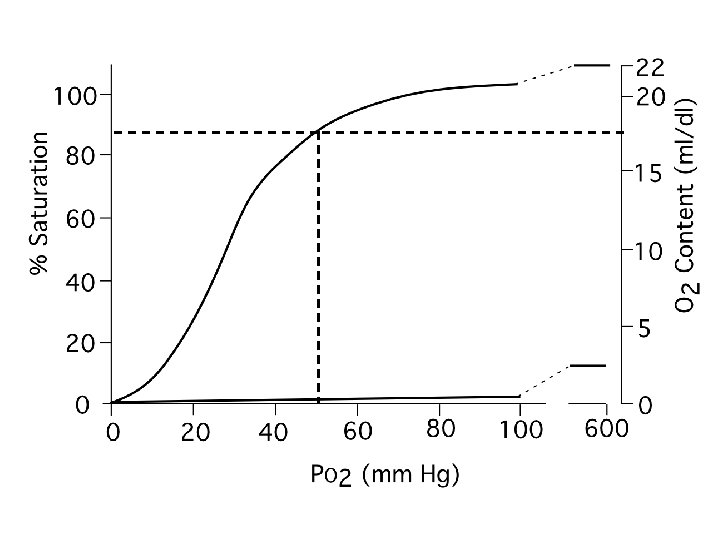

PO 2 = 100 PO 2 = 40 + Vol. = 1 liter Hgb = 15 gm/d. L % sat = 98 CO 2 = 20. 7 ml/d. L O 2 = 207 ml = Vol. = 1 liter Hgb = 15 gm/d. L % sat = 70 CO 2 = 14. 8 ml/d. L O 2 = 148 ml Vol. = 2 liters Hgb = 15 gm/d. L O 2 = 355 ml CO 2 = 17. 7 ml/d. L PO 2 = 52 % sat = 82

P v. O 2 C v. O 2 P c. O 2 Pc. O 2=Pv. O 2 Cc. O 2 =Cv. O 2 C c. O 2 P a. O 2 C a. O 2

Shunt Ca. O 2 is a weighted average of the venous and capillary O 2 contents Ca. O 2 = Qs/Qt • Cv. O 2 + (1 -Qs/Qt) • Cc. O 2 Shunt Non-shunt Where QS is blood flow through shunt regions of lung and QT is total blood flow through lungs

Formal Shunt Equation Qs/Qt = Cc. O 2 - Ca. O 2 Cc. O 2 - Cv. O 2 Measure Cv. O 2 and Ca. O 2 Estimate Cc. O 2 from alveolar gas equation

Normal Shunt Fraction • Normal shunt = 5%. – venous return from bronchial circulation – Thebesian veins in haert • Normal A-a. O 2 difference = 10 mm. Hg (age dependent).

Increased FIO 2 in Shunt • Arterial PO 2 increases little with increased F IO 2.

PIO 2 = 150 mm. Hg Pv. O 2 = 40 mm. Hg Cv. O 2 = 15 ml/dl PAO 2 = 100 Pc. O 2 = 100 Cc. O 2 = 20 ml/dl Pv. O 2 = 40 mm. Hg Cv. O 2 = 15 ml/dl Pa. O 2 = 54 mm. Hg Ca. O 2 = 17. 5 ml/dl

PIO 2 = 713 mm. Hg Pv. O 2 = 40 mm. Hg Cv. O 2 = 15 ml/dl PAO 2 = 673 Pc. O 2 = 673 Cc. O 2 = 22 ml/dl Pv. O 2 = 40 mm. Hg Cv. O 2 = 15 ml/dl Pa. O 2 = 70 mm. Hg Ca. O 2 = 18. 5 ml/dl

Confirming & Quantifying Shunts • Bubble study – immediate = intracardiac – 4 beats = intrapulmonary • Perfusion scan – more sensitive – quantitative • Clinical significance – CNS emboli

Shunt recap • Blood that does not exchange gas. • Normal shunt fraction = 5% • Shunt contributes to hypoxemia. – Pathologic conditions include pneumonia, atelectasis, and intracardiac shunts • Little change in Pa. O 2 with increasing F IO 2.


Increased FIO 2 in V/Q mismatch • V/Q mismatch can be differentiated from shunt by the response to increasing FIO 2.

PIO 2 = 713 mm. Hg Pv. O 2 = 40 mm. Hg Cv. O 2 = 15 ml/dl PAO 2 = 673 Pc. O 2 = 673 Cc. O 2 = 22 ml/dl PAO 2 ~ 500 mm. Hg Cv. O 2 = 21 ml/dl Pa. O 2 = 600 mm. Hg Ca. O 2 = 21. 5 ml/dl

Ventilation-Perfusion Mismatch • Regional V/Q ratios vary throughout lung – Pathologic conditions include asthma, emphysema, and atelectasis • Low V/Q regions contribute to hypoxemia. • Hypoxemia responsive to increasing FIO 2. • Regions with V/Q > 1. 0 do not contribute to hypoxemia.

Effect of Dead space on Pa. O 2 PIO 2 = 150 mm. Hg Pv. O 2 = 40 mm. Hg PAO 2 = 150 PAO 2 = 100 Pc. O 2 = 100 Cc. O 2 = 20 ml/dl Pa. O 2 = 100 mm. Hg Ca. O 2 = 20 ml/dl

Mechanisms matching regional V and Q • Passive – shared effect of gravity • both V and Q increase down the lung – shared geometry of airways and vasculature • airways and pulmonary arteries branch together • Active – hypoxic pulmonary vasoconstriction • crucial role in diseased lungs • ? role in healthy lung

Hypoxic Pulmonary Vasoconstriction

Five Causes of Hypoxemia PACO 2 A-a. O 2 difference FIO 2 = 1. 0 Hypoventilation ↑ nl ↑ Low FIO 2 ↓ nl ↑ Shunt nl ↑ ↓ response V/Q mismatch nl ↑ ↑ Diffusion limitation nl ↑ ↑
O 2 difference Increased Normal FIO 2 = 1. 0 Hypoventilation or")
Hypoxemia ? (A-a)O 2 difference Increased Normal FIO 2 = 1. 0 Hypoventilation or Altitude responsive response Low V/Q Shunt

Clinical correlates • 24 year old man found down in street minimally responsive, transported to ER. • RR = 12 b/min, HR 96 b/min, BP 90/60 mm. Hg, Hgb-O 2 sat = 86% • Arterial blood gas: Pa. O 2 = 55 mm. Hg, Pa. CO 2 = 70 mm. Hg.
 (A-a)O 2 difference Increased Normal FIO 2")
Hypoxemia (PO 2 < 90 mm. Hg) (A-a)O 2 difference Increased Normal FIO 2 = 1. 0 Hypoventilation or Altitude responsive response Low V/Q Shunt

Clinical correlates • 24 year old woman very short of breath. • RR = 32 b/min, HR 126 b/min, BP 156/90 mm. Hg, Hgb-O 2 sat = 86% • Arterial blood gas: Pa. O 2 = 55 mm. Hg, Pa. CO 2 = 32 mm. Hg. • Put on FIO 2 of 1. 0, Pa. O 2→ 600 mm. Hg.
 (A-a)O 2 difference Increased Normal FIO 2")
Hypoxemia (PO 2 < 90 mm. Hg) (A-a)O 2 difference Increased Normal FIO 2 = 1. 0 Hypoventilation or Altitude responsive response Low V/Q Shunt

Summary of Approach • Begin with lung as single unit where: – PAO 2 and PACO 2 are determined by the ratio between ventilation and blood flow. – PAO 2 and PACO 2 are inversely related through alveolar ventilation. – V/Q is uniform throughout and there is no difference in PO 2 between alveolus and blood leaving alveolus • V/Q mismatch leads to A-a O 2 difference • Five causes of hypoxemia – A-a O 2 difference and response to increased Fi. O 2 helps assess causes.
- Slides: 49