Experiment Tunka High energy cosmic rays and Gammaray


 for the Reconstruction of EAS Parameters")
 g Density of Cherenkov light at core")
 Integral spectrum")


2 × 3. 3 ns")


 = 8% At E= 6 1015 e. V From QUEST experiment σsys(E) =")


 - Deployment")
 Hi. SCORE")
 (A. Haungs")


 Name RA degrees")


- Slides: 41
Experiment Tunka : High energy cosmic rays and Gamma-ray astronomy L. A. Kuzmichev (MSU SINP) on behalf of Tunka Collaboration Napoli 2013
Tunka Collaboration S. F. Beregnev, S. N. Epimakhov, N. N. Kalmykov, N. I. Karpov. E. E. Korosteleva, V. A. Kozhin, L. A. Kuzmichev, M. I. Panasyuk, E. G. Popova, V. V. Prosin, A. A. Silaev(ju), A. V. Skurikhin, L. G. Sveshnikova I. V. Yashin, Skobeltsyn Institute of Nucl. Phys. of Moscow State University, Moscow, Russia; N. M. Budnev, O. A. Chvalaev, O. A. Gress, A. V. Dyachok, E. N. Konstantinov, A. V. Korobchebko, R. R. Mirgazov, L. V. Pan’kov, A. L. Pahorukov, Yu. A. Semeney, A. V. Zagorodnikov Institute of Applied Phys. of Irkutsk State University, Irkutsk, Russia; B. K. Lubsandorzhiev, B. A. Shaibonov(ju) , N. B. Lubsandorzhiev Institute for Nucl. Res. of Russian Academy of Sciences, Moscow, Russia; V. S. Ptuskin IZMIRAN, Troitsk, Moscow Region, Russia; Ch. Spiering, R. Wischnewski DESY-Zeuthen, Germany; A. Chiavassa Dip. di Fisica Universita' di Torino and INFN, Torino, Italy. A. Haungs, F. Schroeder, R. Hiller Karlsruhe Institute of Technology, Karlsruhe, Germany D. Horns, M. Tlucziykont , R. Nachtigall, M. Kunnas Hamburg University, Germany
OUTLINE 1. Tunka-133. 2. Energy spectrum. 3. Mass composition 4. Plan for the Tunka-133 upgrading. 5. Low energy extension : Tunka-Hi. SCORE project.
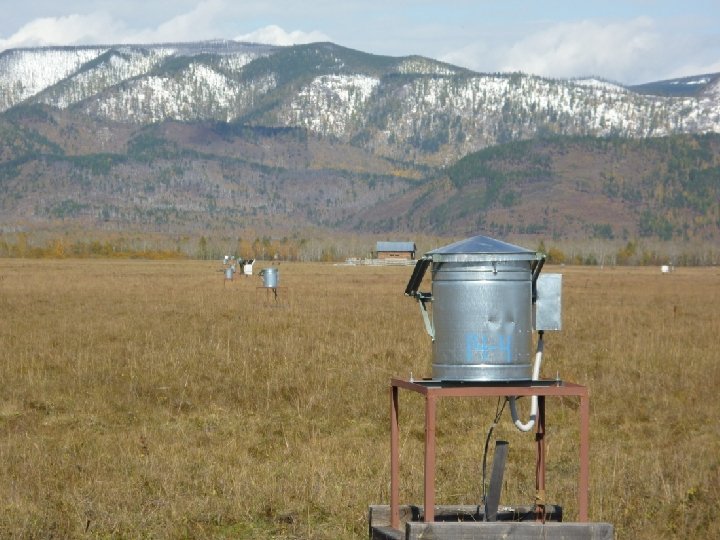
1 km Tunka-133 EAS Cherenkov array – 175 optical detectors on the 3 km 2 Energy threshold ~ 1015 e. V Accuracy: core location ~ 10 m energy resolution ~ 15% Xmax < 25 g∙cm-2
Scientific aims 1. Search for Acceleration Limit of Galactic Sources ( transition from galactic to extragalactic CR) 2. Study of a new methods of EAS registration 3. Low energy extension: Multi-Te. V gamma-ray astronomy and CR in energy range 100 Te. V - 5 Pe. V
Tunka-133: 19 clusters, 7 detectors in each cluster DAQ center Optical cable Cluster Electronic box PMT EMI 9350 Ø 20 cm 4 channel FADC boards 200 MHz, 12 bit
Using of Cherenkov Light Lateral Distribution Function (LDF) for the Reconstruction of EAS Parameters LDF from CORSIKA Q(R) = F(R, p) (only one parameter) steepness of LDF Experimental data fitted with LDF light flux at core distance 200 m – Q 200 Energy P = Q(100)/Q(200) Xmax
Energy reconstruction E = A (Q 200) g Density of Cherenkov light at core distance of 200 m For 1016 – 1018 e. V (CORSIKA): g = 0. 94± 0. 01
Absolute energy calibration : The QUEST experiment ( Cherenkov detectors at EAS-TOP) Integral spectrum σsys(E) = 8% p Normalization point for Tunka-133 P – steepness of LDF (Lateral Distribution Function)
Three seasons of array operation 2009 - 2010 : 286 hours of good weather. 2010 – 2011: 305 hours of good weather. 2011 – 2012: 380 hours of good weather > 6 106 events with energy 1015 э. В. 50 detectors 1016 e. V Trigger counting rate during one night. 10 events during every night with number of hitted detectors more than 100. Distribution of the number of hitted clusters in one event.
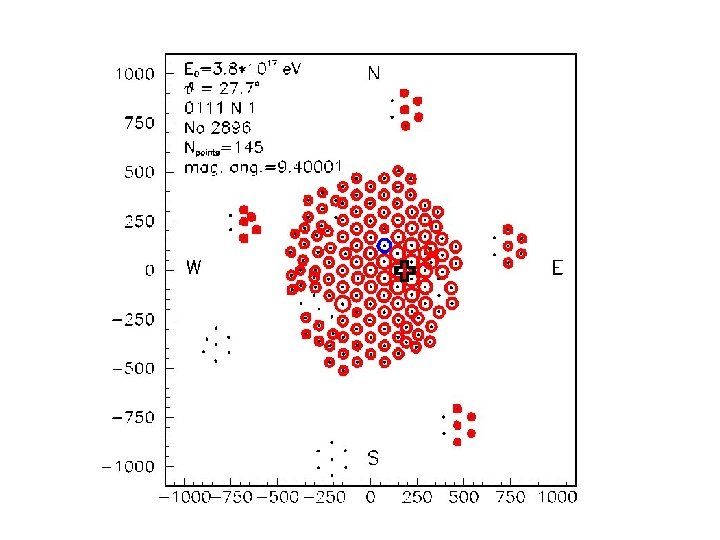
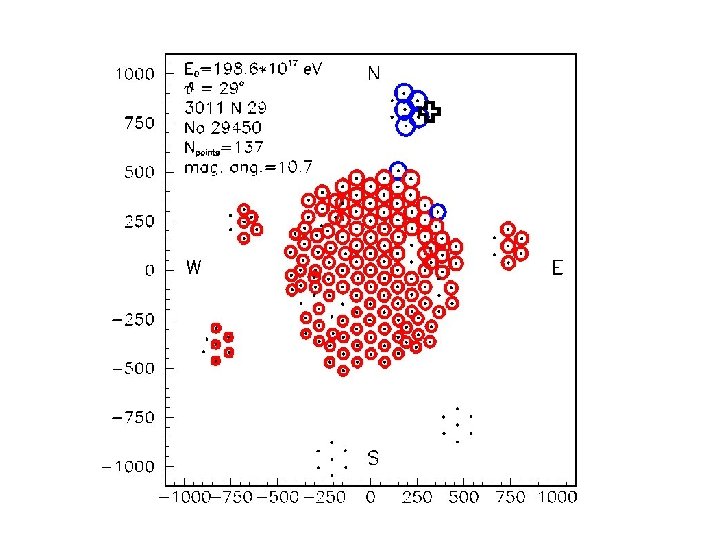
IN-events: Core position inside circle: R < 450 m Zenith angle < 45° 800 m 2009 -2012 >1016 e. V: 63490 450 m >1017 e. V: 605 OUT- events: R <800 m > 1017 e. V: 1900
Tns Shower front T ns = (R+200/R 0 )2 × 3. 3 ns
WDF – width distant function ADF WDF LDF ADF – amplitude distant function is used for core location
1900 events > 1017 e. V
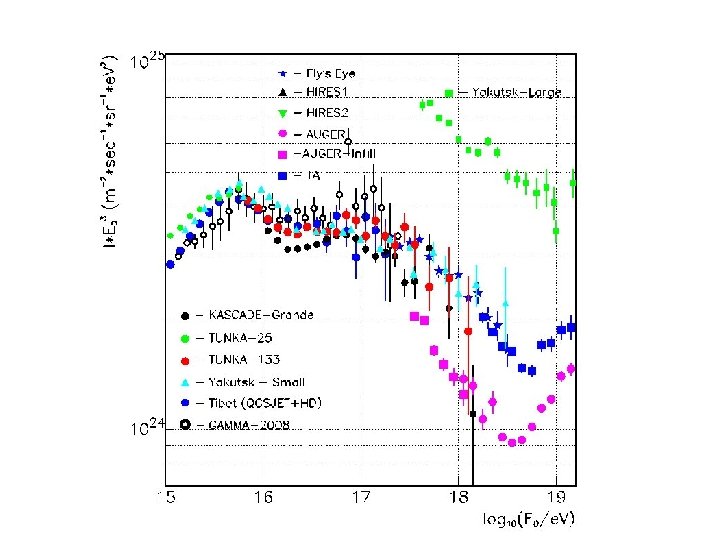
γ~ 3. 0 Second knee γ~ 3. 3 ~3 · 1017 e. V
σsys(E) = 8% At E= 6 1015 e. V From QUEST experiment σsys(E) = 15% At 1018 e. V due to uncertainty in g
Energy Spectrum
Mean Depth of EAS maximum Xmax g·cm-2 Mean logarithm of primary mass. PRELIMINARY
Conclusions 1. The spectrum in the energy range of 1016 to 1018 e. V cannot be fitted with single power law index 3. 21 ± 0. 01 (6· 1015 – 2· 1016 e. V) 2. 97 ± 0. 01 (2· 1016 – 1017 e. V) 3. 30 ± 0. 1 (3 · 1017 – 1018 e. V) 2. There is an indication on the second knee at ~3· 1017 e. V 3. Tunka spectrum = K-Gr spectrum inside energy reconstruction systematics. The key question – to increase accuracy of absolute energy calibration. Is it possible to have 5% accuracy? 4. More statistics is needed at the energy range of 1017 – 1018 e. V The array will continue data taking for another 4 -5 seasons. 5. Primary mass composition changes from the light (He) at the knee to the heavy at 3· 1016 e. V. The mass composition is heavy till at least 1017 e. V. More statistics is needed in the energy range of 1017 – 1018 e. V
Plan for upgrading - Net of radio antennae Tunka-REX ( Radio Extension) - Deployment of Grande stintilator detectors - Cross calibration of Cherenkov light and fluorescent light methods. - Low energy extension – Tunka –Hi. SCORE
Tunka : 2013 -2014 Grande-station ( now in Moscow) Hi. SCORE
Registration of radio signals from EAS Short Aperiodic Loaded Loop Antenna (SALLA) (A. Haungs et al. Institute fur Kernphysick, Forschungszentrum, Karslruhe, Germany 20 antennas was installed in autumn 2012 Antennas are connected to the free FADC channels of Tunka-133 cluster electronics
Absolute energy calibration experiment. Repeating the “QUEST” at 1016 -1017 e. V Lg (Ne / E, Tev) -P -Fe Zenith-angle: 0º -45º Energy: 1016 – 1017 e. V -20 scintillation counters, 10 m 2 p P – steepness of LDF 2000 events with E >3· 1016 e. V per season
Cross calibration of Cherenkov light and fluorescent light methods. Image detector from TUS experiment S= 2 -10 м 2 Field of view ± 7 deg 7 -10 km
Тunka-Hi. SCORE A wide-angle gamma observatory Hi. SCORE stands for Hundred*i Square-km Cosmic Origin Explorer
Main Topics Gamma-ray Astronomy Search for the Pe. Vatrons. VHE spectra of known sources: where do they stop? Absorption in IRF and CMB. Diffuse emission: Galactic plane, Local supercluster. Charged cosmic ray physics Energy spectrum and mass composition from 1014 to 1018 e. V. 108 events (in 1 km 2 array) with energy > 1014 e. V per one season (400 hours). Particle physics Axion/photon conversion. Hidden photon/photon oscillations. Lorentz invariance violation. pp cross-section measurement. Quark-gluon plasma.
What we can see with 1 km 2 array (short list) Name RA degrees Decl Flux F at 1 Te. V, 10 -12 cm-2 s 1 Te. V-1 Г Tycho SNR (J 0025+641) 6. 359 64. 13 0. 17 ± 0. 05 Г=1. 95 ± 0. 5 Crab 83. 6329 22. 0145 SNR IC 443 (MAGIC J 0616+225) 94. 1792 22. 5300 Geminga MGRO C 3 PSR 98. 50 M 82 (Starburst Galaxy) 148. 7 0. 58 ± 0. 12 Г=3. 1 ± 0. 30 17. 76 69. 7 Mkn 421 (BL, z=0. 031 166. 114 38. 2088 Variable ) SNR 106. 6+2. 7 (J 2229. 0+6114) 32. 6 ±. 9. 0 Г=2. 6 ± 0. 3 337. 26 61. 34 Cas A (SNR, G 111. 72. 1)[6] 350. 853 58. 8154 CTA_1(SNR, PWN) 1. 5 72. 8 Flux F at 35 Time of Te. V, observation Number of events 10 -17 cm-2 s- per one year per one season 1 Te. V-1 (х 0. 5 - weater E> 20 Te. V (from Milagro ) factor) 236 h 162. 6 ± 9. 4 110 h, 680 28. 8 ± 9. 5 112 h, 2 –(from MAGIC) 50 ( from Milagro) 37. 7 ± 10. 7 102 h, 80 325 h, 22 0. 25 ± 0. 12 Г=2. 5 ± 0. 6± 0. 2 50 -200 Г=2. 0 -2. 6 1. 42 ± 0. 33 ± 0. 41 Г=2. 29 ± 0. 33 ± 0. 30 1. 26 ± 0. 18 Г=2. 61 ± 0. 24± 0. 2 1. 3 Г=2. 3 88 140 h 70. 9 ± 10. 8 167 h 20 - 1000 140 ( from VERITAS 235 ( from Milagro) 177 h 40 266 h 200
Methodical approaches for 3 stages 1. Shower front and LDFsampling technique (at the first stages). Angular resolution – 0. 1 deg, Xmax measurement for hadron rejection. 2. Using of small mirrors net with cheap matrix of PMTs for imaging technique. 3. Using of large area muon detectors for hadron rejection.
Tunka-Hi. SCORE – 1 km 2 stage 1 150 m 9352 KB 8’’, ET
Tunka-Hi. SCORE – 1 km 2 stage 2 150 m 300 m R 11780 12’’ Hamamatsu 2 mirror, ± 7º FOV, No image
Tunka-Hi. SCORE – 1 km 2 stage 3 150 m 300 m Installing of PMTs matrix, Image techniques R 11780 12’’ Hamamatsu 2 mirror, ± 7º FOV,
After October 2012: 3 optical stations for common operation with Tunka-133
200 m New station 150 m
Calibration light source Station Electronics 4 PMTs
Thank you
all-particle spectrum and composition of cosmic rays <ln. A> based on <Xmax>; data from Hoerandel 2007 42