Experiences in Traceroute and Available Bandwidth Change Analysis
Experiences in Traceroute and Available Bandwidth Change Analysis Connie Logg, Les Cottrell & Jiri Navratil SIGCOMM’ 04 Workshops September 3, 2004 http: //www. slac. stanford. edu/cgi-wrap/getdoc/slac-pub-10518. pdf Partially funded by DOE/MICS Field Work Proposal on Internet End-to-end Performance Monitoring (IEPM), also supported by IUPAP 1
Motivation • High Energy Nuclear Physics (HENP) analysis requires the effective distribution of large amounts of data between collaborators world wide. • In 2001 we started development on a project (IEPM -BW) for Internet End-to-end Performance Monitoring of Band. Width) for the network paths to our collaborators • It has evolved over time from network intensive measurements (run about every 90 minutes) to light weight non-intensive measurements (run about every 3 -5 minutes) 2
IEPM-BW Version 1 • IEPM-BW version 1 (September 2001) performed sequential heavy weight (iperf and file transfer tests) and light weight (ping & traceroute) measurements to a few dozen collaborator nodes – it could only be run a few times a day • Concurrently an Available Band. Width Estimation (ABWE) tool was being developed by Jiri to perform light weight available bandwidth (ABW), link capacity (DBCAP), and cross traffic (XTR) estimates 3
IEPM-BW Version 2 • IEPM-BW version 2 incorporated ABWE as a probing tool, and extensive comparisons were made between the heavy weight iperf and file transfer tests and the ABWE results • ABWE results tracked well with iperf and file transfer tests in many cases 4
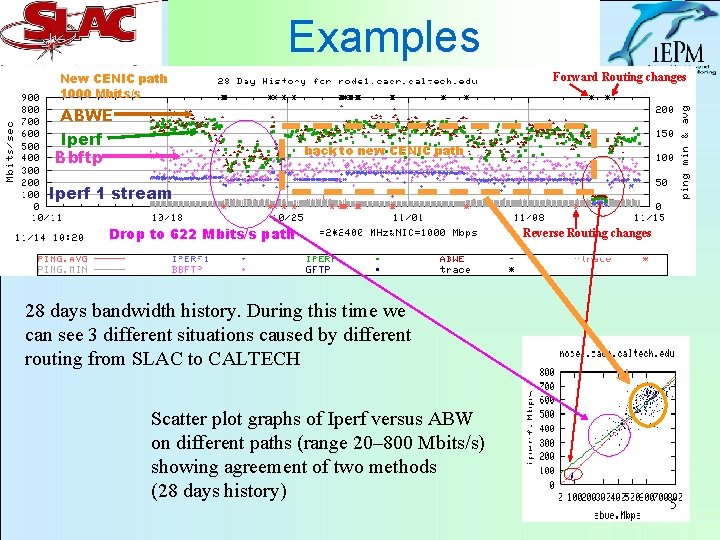
Examples New CENIC path 1000 Mbits/s Forward Routing changes ABWE Iperf Bbftp back to new CENIC path Iperf 1 stream Drop to 622 Mbits/s path Reverse Routing changes 28 days bandwidth history. During this time we can see 3 different situations caused by different routing from SLAC to CALTECH Scatter plot graphs of Iperf versus ABW on different paths (range 20– 800 Mbits/s) showing agreement of two methods (28 days history) 5
Challenges • The monitoring was very useful to us but: – Too many graphs and reports to examine manually every day – We could only run the probes a few times a day • We needed to automate what the brain does – pick out changes • Changes of concern included: route and bandwidth 6
Traceroute Analysis • Need a way to visualize traceroutes taken at regular intervals to several tens of remote hosts • Report the pathologies identified • Allow quick visual inspection for: – Multiple routes changes – Significant route changes – Pathologies – Drill down to more detailed information • Histories • Topologies • Bandwidth monitoring data 7
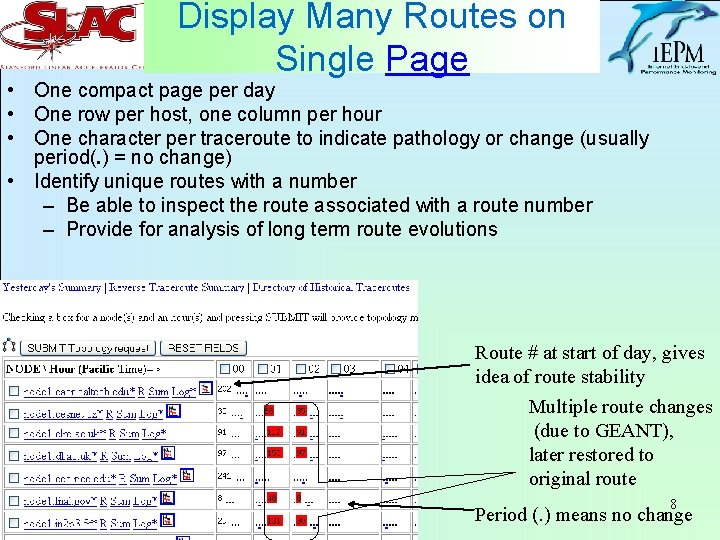
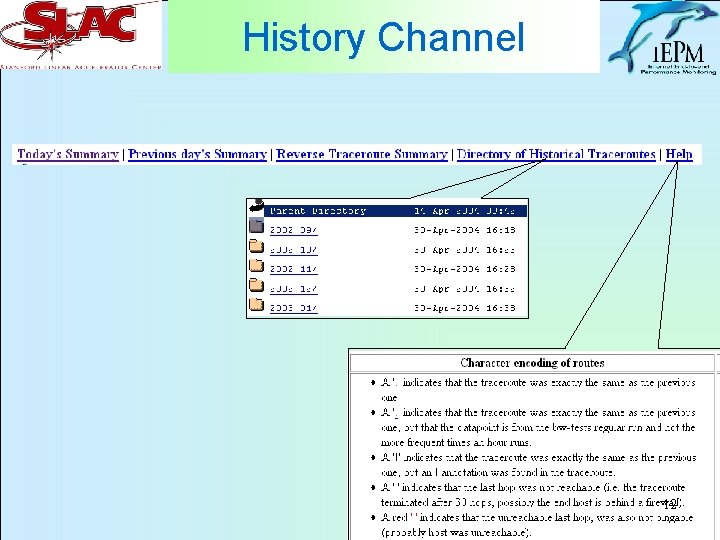
Display Many Routes on Single Page • One compact page per day • One row per host, one column per hour • One character per traceroute to indicate pathology or change (usually period(. ) = no change) • Identify unique routes with a number – Be able to inspect the route associated with a route number – Provide for analysis of long term route evolutions Route # at start of day, gives idea of route stability Multiple route changes (due to GEANT), later restored to original route 8 Period (. ) means no change
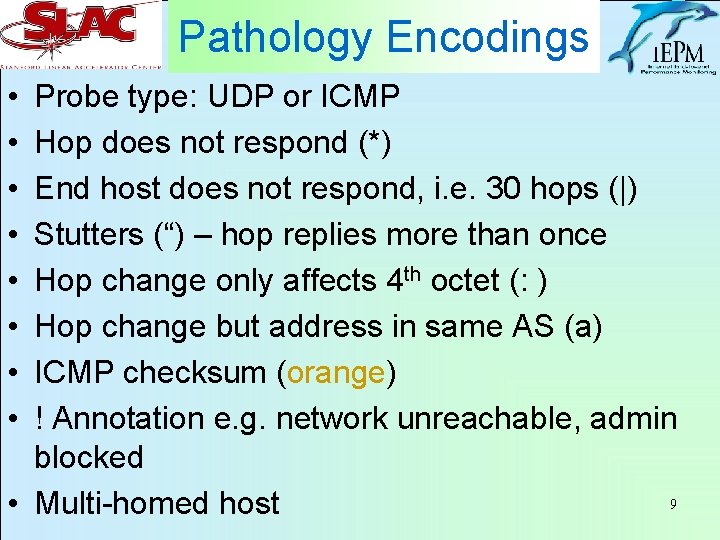
Pathology Encodings • • Probe type: UDP or ICMP Hop does not respond (*) End host does not respond, i. e. 30 hops (|) Stutters (“) – hop replies more than once Hop change only affects 4 th octet (: ) Hop change but address in same AS (a) ICMP checksum (orange) ! Annotation e. g. network unreachable, admin blocked 9 • Multi-homed host
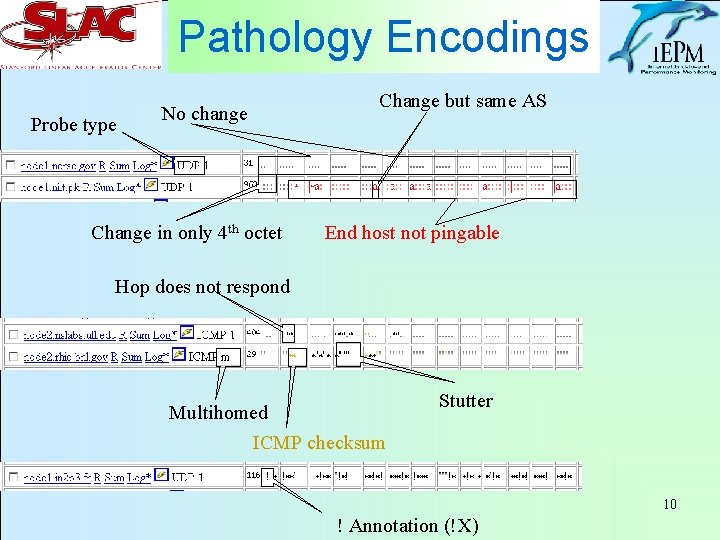
Pathology Encodings Probe type No change Change in only 4 th octet Change but same AS End host not pingable Hop does not respond Multihomed ICMP checksum Stutter 10 ! Annotation (!X)
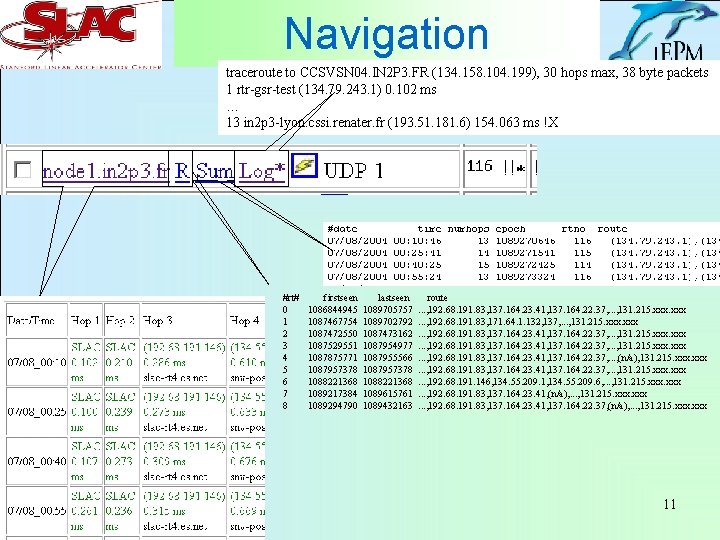
Navigation traceroute to CCSVSN 04. IN 2 P 3. FR (134. 158. 104. 199), 30 hops max, 38 byte packets 1 rtr-gsr-test (134. 79. 243. 1) 0. 102 ms … 13 in 2 p 3 -lyon. cssi. renater. fr (193. 51. 181. 6) 154. 063 ms !X #rt# 0 1 2 3 4 5 6 7 8 firstseen 1086844945 1087467754 1087472550 1087529551 1087875771 1087957378 1088221368 1089217384 1089294790 lastseen 1089705757 1089702792 1087473162 1087954977 1087955566 1087957378 1088221368 1089615761 1089432163 route. . . , 192. 68. 191. 83, 137. 164. 23. 41, 137. 164. 22. 37, . . . , 131. 215. xxx. . . , 192. 68. 191. 83, 171. 64. 1. 132, 137, . . . , 131. 215. xxx. . . , 192. 68. 191. 83, 137. 164. 23. 41, 137. 164. 22. 37, . . . , (n/a), 131. 215. xxx. . . , 192. 68. 191. 83, 137. 164. 23. 41, 137. 164. 22. 37, . . . , 131. 215. xxx. . . , 192. 68. 191. 146, 134. 55. 209. 1, 134. 55. 209. 6, . . . , 131. 215. xxx. . . , 192. 68. 191. 83, 137. 164. 23. 41, (n/a), . . . , 131. 215. xxx. . . , 192. 68. 191. 83, 137. 164. 23. 41, 137. 164. 22. 37, (n/a), . . . , 131. 215. xxx 11
History Channel 12

AS’ information 13
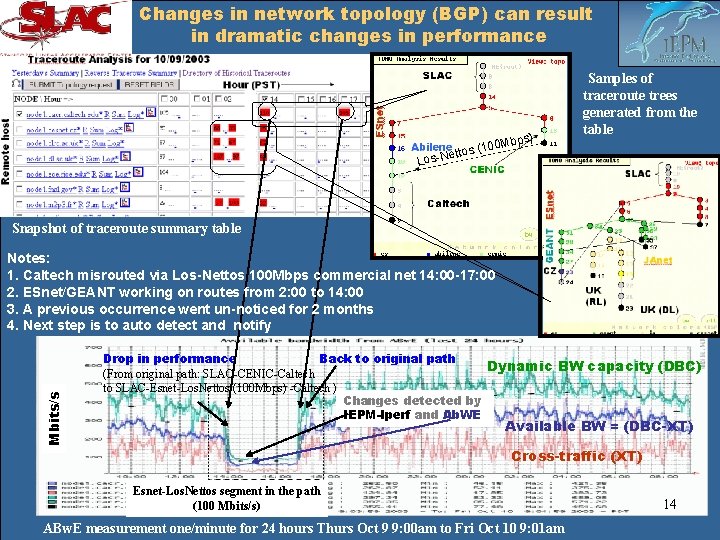
Changes in network topology (BGP) can result in dramatic changes in performance Remote host Hour s) bp (100 M s o t t e Los-N Samples of traceroute trees generated from the table Snapshot of traceroute summary table Mbits/s Notes: 1. Caltech misrouted via Los-Nettos 100 Mbps commercial net 14: 00 -17: 00 2. ESnet/GEANT working on routes from 2: 00 to 14: 00 3. A previous occurrence went un-noticed for 2 months 4. Next step is to auto detect and notify Drop in performance Back to original path Dynamic BW capacity (DBC) (From original path: SLAC-CENIC-Caltech to SLAC-Esnet-Los. Nettos (100 Mbps) -Caltech ) Changes detected by IEPM-Iperf and Ab. WE Available BW = (DBC-XT) Cross-traffic (XT) Esnet-Los. Nettos segment in the path (100 Mbits/s) ABw. E measurement one/minute for 24 hours Thurs Oct 9 9: 00 am to Fri Oct 10 9: 01 am 14
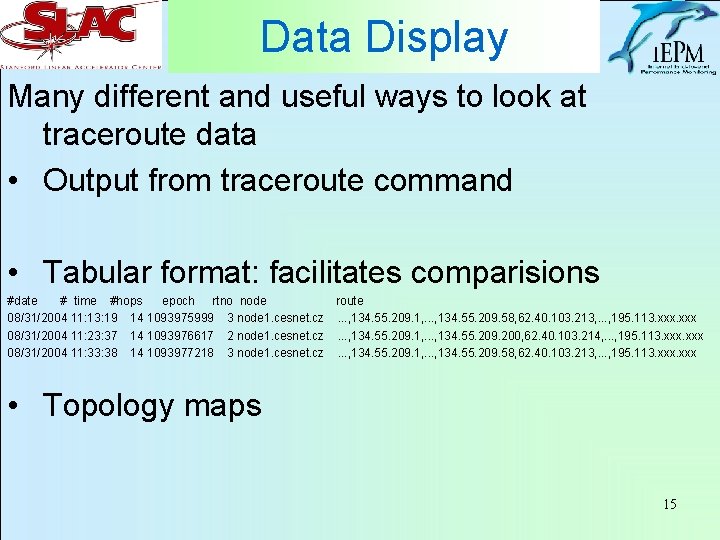
Data Display Many different and useful ways to look at traceroute data • Output from traceroute command • Tabular format: facilitates comparisions #date # time #hops epoch rtno node route 08/31/2004 11: 13: 19 14 1093975999 3 node 1. cesnet. cz. . . , 134. 55. 209. 1, . . . , 134. 55. 209. 58, 62. 40. 103. 213, . . . , 195. 113. xxx 08/31/2004 11: 23: 37 14 1093976617 2 node 1. cesnet. cz. . . , 134. 55. 209. 1, . . . , 134. 55. 209. 200, 62. 40. 103. 214, . . . , 195. 113. xxx 08/31/2004 11: 33: 38 14 1093977218 3 node 1. cesnet. cz. . . , 134. 55. 209. 1, . . . , 134. 55. 209. 58, 62. 40. 103. 213, . . . , 195. 113. xxx • Topology maps 15
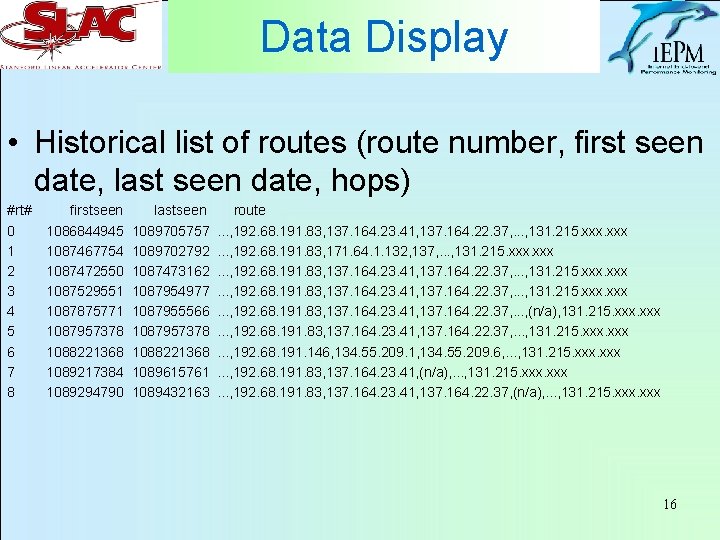
Data Display • Historical list of routes (route number, first seen date, last seen date, hops) #rt# 0 1 2 3 4 5 6 7 8 firstseen 1086844945 1087467754 1087472550 1087529551 1087875771 1087957378 1088221368 1089217384 1089294790 lastseen 1089705757 1089702792 1087473162 1087954977 1087955566 1087957378 1088221368 1089615761 1089432163 route. . . , 192. 68. 191. 83, 137. 164. 23. 41, 137. 164. 22. 37, . . . , 131. 215. xxx. . . , 192. 68. 191. 83, 171. 64. 1. 132, 137, . . . , 131. 215. xxx. . . , 192. 68. 191. 83, 137. 164. 23. 41, 137. 164. 22. 37, . . . , (n/a), 131. 215. xxx. . . , 192. 68. 191. 83, 137. 164. 23. 41, 137. 164. 22. 37, . . . , 131. 215. xxx. . . , 192. 68. 191. 146, 134. 55. 209. 1, 134. 55. 209. 6, . . . , 131. 215. xxx. . . , 192. 68. 191. 83, 137. 164. 23. 41, (n/a), . . . , 131. 215. xxx. . . , 192. 68. 191. 83, 137. 164. 23. 41, 137. 164. 22. 37, (n/a), . . . , 131. 215. xxx 16
Summary • • We are quite happy with our traceroute analysis One page per day to eyeball for route changes Links provided for ease of further examination Do not alert on traceroute changes, but traceroute information is integrated with Bandwidth Change Analysis IEPM-BW in Action 17
Bandwidth Change Analysis • Purpose is to generate “alerts” about “major” drops in available bandwidth and/or link capacity which may be impacting our physics analysis production work • Inspired by “Plateau Algorithm” for analyzing ping data from Mc. Gregor and Braun • The implementation is described in the paper so I am not going to go over it here 18
Overview • We currently feed a weeks worth of data into it for developmental and verification purposes • The actual implementation processes that weeks worth of data in a sliding window of currently about 24 hours • A 1 st level “alert” is generated when there is a period of depressed bandwidth for about 3 hours. Our threshold of depression is currently 40% • There is one web page that displays an analysis overview with links to more details 19
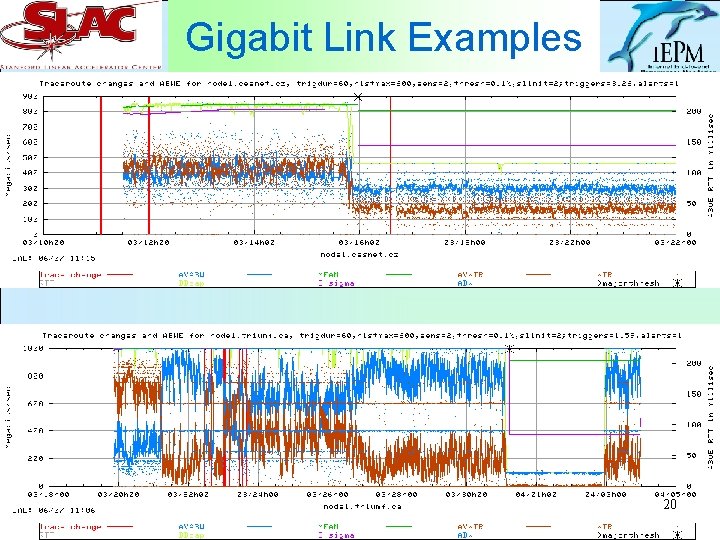
Gigabit Link Examples 20
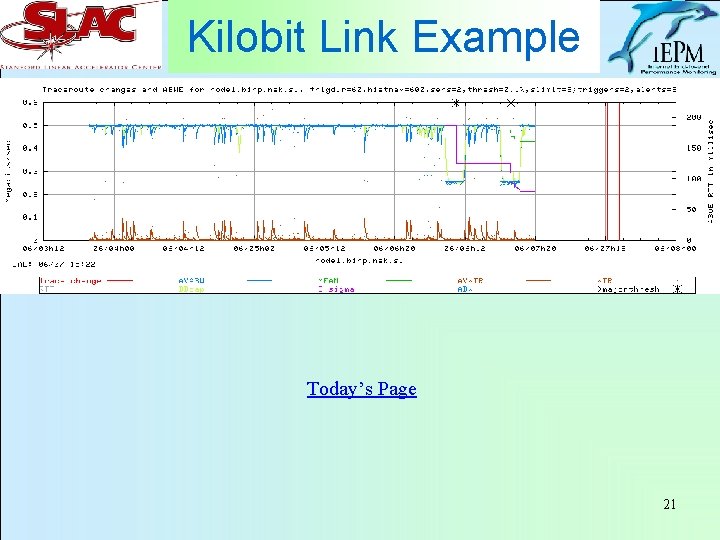
Kilobit Link Example Today’s Page 21
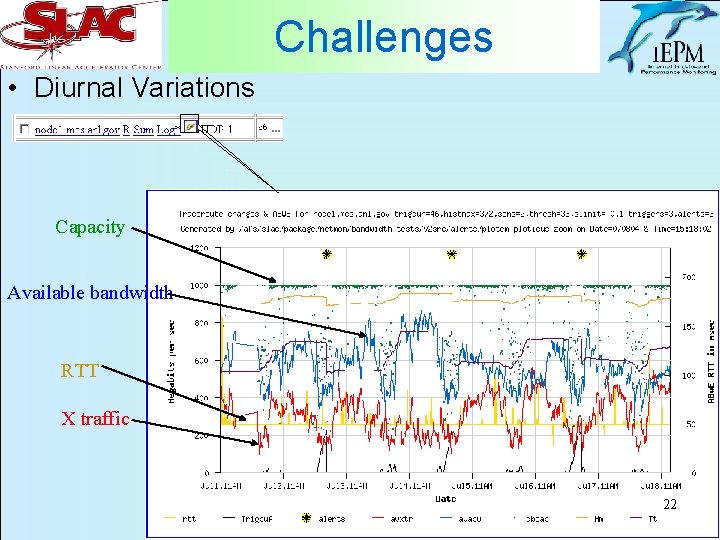
Challenges • Diurnal Variations Capacity Available bandwidth RTT X traffic 22
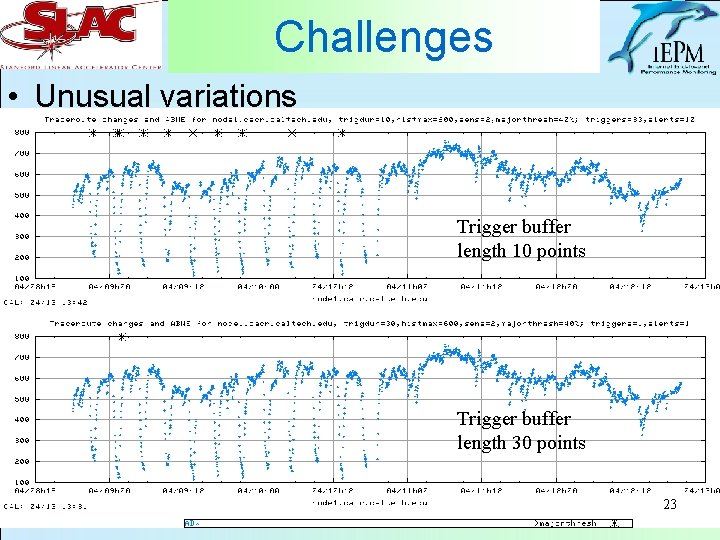
Challenges • Unusual variations Trigger buffer length 10 points Trigger buffer length 30 points 23
Considerations • From the performance monitoring perspective of managing a production network, we are primarily concerned about pathologies that interfere with the production process • We are not really interested in the minor ebb and flow of network traffic • We are not interested in monitoring the entire “Grid” • We are interested in monitoring what are users are “seeing” 24

Challenges • There are many algorithms which may be useful in analyzing data for various types of variations with which we may not be concerned • Developing code for this is challenging and complex, but can be done. • Problem: CPU power and “elapsed” time to analyze monitoring data with all these analysis tools is impractical – most of us cannot afford supercomputers or farms to do it • Analysis and identification of “events” must be timely 25
Solutions • Quick first level trigger analysis which can be done frequently to check for “events” • Provide web page for looking at general health and first level trigger occurrences • Can also invoke immediate but synchronized more extensive tests to verify drops • Input event data (and longer term data) into more sophisticated analysis to filter for serious “alert”s • Save event signatures for future reference 26
IEPM-BW Future • IEPM-BW Version 3 is being architected to facilitate frequent light available bandwidth and link capacity measurements • Will use SQL database to manage the probe, monitoring host, and target host specifications as well as the probe data and analysis results • Frequent lightweight first trigger level change analysis 27
Long Term • Facility for scheduling on demand automatic heavyweight bandwidth tests in response to triggers • Automatically feed results into more complex analysis code to filter only for “real” alerts • Distributed self contained independent monitoring systems • Working on a technique to encode bandwidth variation signatures (such as diurnal variations) 28

References • • • ABWE: A Practical Approach to Available Bandwidth Estimation, Jiri Navratil and Les Cottrell Automated Event Detection for Active Measurement Systems, A. J. Mc. Gregor and H-W. Braun, Passive and Active Measurements 2001. Overview of IEPM-BW Bandwidth Testing of Bulk Data Transfer, Les Cottrell and Connie Logg Experiences and Results from a New High Performance Network and Application Monitoring Toolkit, Les Cottrell, Connie Logg, and I-Heng Mei Correlating Internet Performance Changes and Route Changes to assist in Trouble-Shooting from an End-User Perspective, Connie Logg, Jiri Navratil, and Les Cottrell Miscellaneous, SLAC 29
Future - continues • Further develop Bandwidth Change Analysis – Now have 1 st level trigger mechanism – Develop more extensive analysis to analyze identified events • Develop algorithms to automatically conduct other tests integrate those results into further trigger analysis 30
IEPM-BW Version 3 • Architecture changes • SQL data base for host specifications, probe tool specifications, probe scheduling mechanism, analysis results, knowledge base • Scheduling mechanisms for lightweight vs heavyweight probes • Distributed monitoring and remote data retrieval for “grid” analysis • Change analysis (route and bandwidth) and alerts 31
- Slides: 31