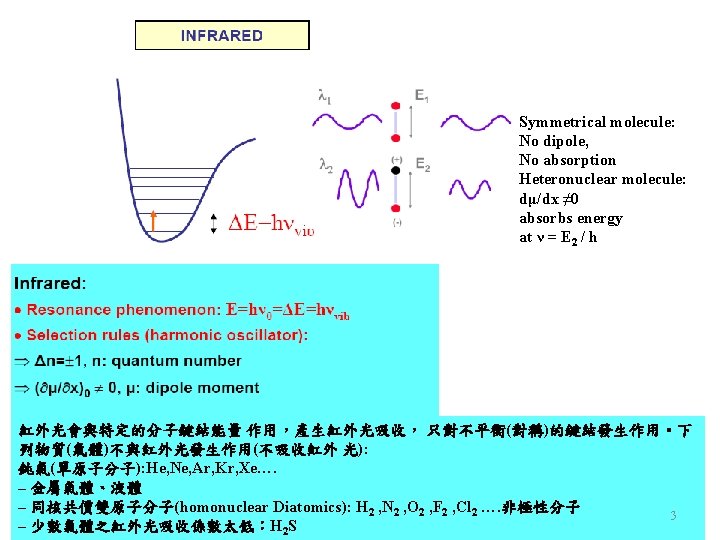
Excited electronic state Energy Dissociation energy Ground state
 Internuclear separation")
表面光滑面 Diffuse Reflection (散射反射) --表面粗糙面 Specular Absorption Reflection (正吸收反射) Grazing Angle Reflectance -- 可量測約幾十個")


 323 -352)")
) TO mode, 492 cm-1 LO")
B 2 O 3 glasses (J. Phys.")
 Boroxol unit; B 2 O 3")
B 2 O 3 glasses")
- Slides: 34
Excited electronic state Energy Dissociation energy Ground state Rotational transition (in microwave) Internuclear separation 2
(正反射)表面光滑面 Diffuse Reflection (散射反射) --表面粗糙面 Specular Absorption Reflection (正吸收反射) Grazing Angle Reflectance -- 可量測約幾十個 埃 A Total Reflectance (ATR 全反射) --表面 0. 2 - 6 um 4
FTIR Laser IR source 6
Background 背景掃瞄 穿透光譜 80. 8 Ratio Sample 樣品掃瞄 60 %T 40 20 0. 3 4400. 0 2000 1000 2000 cm-1 1000 450. 0 cm-1 7
IR spectra of RO-Zn. O-B 2 O 3 (RO= Mg. O, Ca. O, Sr. O and Ba. O) glasses BO 4 MZB BO 3 CZB SZB BZA H 2 O, OH bending vibration of borate segments No peak at 806 cm-1 , no boroxol ring BO 3 asymmetric stretching vibrations of B-O and B-O¯ bond. These bands have become broad in present glasses in the order Mg. O < Ca. O < Sr. O < Ba. O. 1200 -1400 cm-1 is =B-O-B≡ linkage. 8
IR spectra of RO-Pb. O-B 2 O 3 (RO= Mg. O, Ca. O, Sr. O and Ba. O) glasses BO 4 groups the peaks around 1374 -1407 cm-1 which are overlapping on vibration of BO 3 units might reveal the existence of Pb. O 3 and Pb. O 4 pyramids. 9
IR spectra of Ca. O-Al 2 O 3 -Si. O 2 glasses Al 2 O 3/Ca. O=0. 5 Ca. O=20 mol% Si. O 2=60 mol% 10
1. Vibration of O in Al-O-Si or Si-O-Si : 475 cm-1. The shift of the band to lower frequencies with the addition of alumina can be explained by an increase in the number of Si-O-A 1 bonds, which have a smaller force constant. 2. Al. O 4 tetrahedra : 710 cm-1. 3. Si-O bending and A 1 -O stretching, with the aluminum ions in four-fold coordination: 750~800 cm -1. 4. The bands observed in the 850 to 1300 cm-I region are due to the effect of calcium ions and aluminum ions on the Si-O bonds. The band of shifts from higher frequencies to about 880 cm -1 as the alumina content was increased. This shift was attributed to the presence of Si(OA 1) 3 and Si(OA 1)4, i. e. , silicon-oxygen tetrahedra with three and with four corners shared with aluminum-oxygen polyhedra, respectively. The sub-region of 1050~ 1100 cm-1 represents the vibration of the Si(OA 1/Ca) group, i. e. , the stretching vibration of the silicon-oxygen bond of the [Si. O 4] tetrahedra with one corner shared with an aluminum or calcium polyhedron. The shoulder observed on the 1100 cm-1 band, in the spectra of glasses with a silica content higher than 60 mol%, is probably a vibration of Si. O 4 with four bridging oxygens. The low energy part is likely due to Si(OA 1/Ca) 3 and Si(OA 1/Ca)4. This latter band was said to be due to [Si. O 4] tetrahedra with three or four non-bridging oxygens. 5. The aluminum ions were four-fold coordinated in Ca. O-Al 2 O 3 -Si. O 2 glasses. No six-coordinated aluminum present in Ca. O-Al 2 O 3 -Si. O 2 glasses. This is different from the structure of Na 2 O-Al 2 O 3 -Si. O 2 glasses. [Al. O 6] polyhedron presents in Na 2 O-Al 2 O 3 -Si. O 2 glasses as Al 2 O 3/Na 2 O > 1. In Ca. O-Al 2 O 3 -Si. O 2 glasses, the excess aluminum not included in the tetrahedral aluminosilicate network forms neutral species, ‘triclusters‘, i. e. three-coordinated oxygen. 11
13
14
15
16
17
18
19
20
21
22
23
24
25
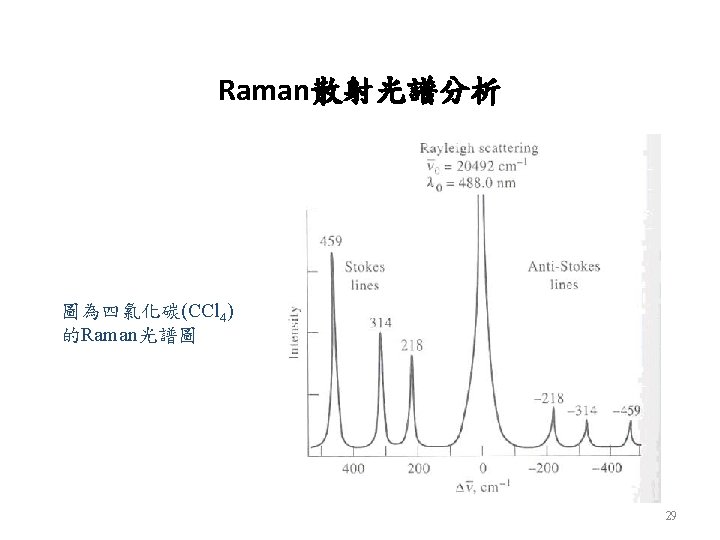
Raman散射原理 l l 0 Incident light l 0 Absorbed Transmitted l 0 Reflected l l 0 Inelastic Raman scattering l 0 Elastic Scattered Rayleigh scattering 26
mind=a. E a: poalrizability ANTI-STOKES Rayleigh 0 - 0 0 + 27
Raman spectra of alkali silica glasses (J. of Non-Crysta. Solids 58 (1983) 323 -352) Raman spectrum (I∥and I ⊥) of silica glass The 440 cm-1 band results from symmetric motion of the bridging oxygen relative to the silicon atoms in the three-dimensional network structure (ns(Si-O-Si)). Although the 440 cm-1 band has been assigned to a transverse optic (TO) mode and the 492 cm-1 band to a longitudinal optic (LO) mode, the ns (Si-O-Si) mode is infrared inactive. The weak band at 606 cm-1 is attributed to defect structures in the silica network. The broad envelope located near 800 cm-1 is associated with the network structure of the Si. O 2 glass, as its intensity drops with depolymerization of the glass. Oxygen isotopic substitution data for Si. O 2 glass indicate that the 800 cm-1 feature results primarily from silicon motion. Two broad, weak, and depolarized bands at 1060 cm -1 and 1190 cm-1 are probably due to the antisymmetric Si-OSi stretching mode (nas(Si-O-Si)) in which the bridging oxygen atom moves parallel to the Si. Si axis. 30
Raman spectra of alkali silicate glasses 440 cm-1 (ns(Si-O-Si)) TO mode, 492 cm-1 LO mode, 606 cm-1 defect structures in the silica network. 800 cm-1 network structure of the Si. O 2 glass, as its intensity drops with depolymerization of the glass. Oxygen isotopic substitution data for Si. O 2 glass indicate that the 800 cm-1 feature results primarily from silicon motion. 1060 cm -1 and 1190 cm-1 are TO and LO mode of nas(Si-O-Si). 31
Raman spectra of x. Li 2 O-(1 -x)B 2 O 3 glasses (J. Phys. Chem. Solids, 54 (1993) 621) X=0. 5 X=0. 4 X=0. 35 X=0. 3 X=0. 25 X=0. 2 X=0. 15 500 cm-1 pentaborate, tetraborate and diborate groups. 550 cm-1 isolated diborate groups. 660 cm-1 pentaborate groups. 806 cm-1 Boroxol ring. 770 cm-1 BO 4 unit. 950 cm-1 pentaborate and tetraborate groups. The shift of the 950 cm-1 to a lower value (925 cm-1) is attributed to the linking of pentaborate and tetraborate groups to the orthoborate type of structure. 840 and 1210 cm-1 symmetric stretching of the B-O-B bridges and to the stretching of the terminal B-O- bonds, respectively, in B 2 O 5 anions. (pyroborate) 1300~1500 cm-1 stretching of B-O- bonds. X=0. 1 32
The schematic representation of different borate arrangements. (a) Boroxol unit; B 2 O 3 (b) pentaborate unit; Li 2 O-5 B 2 O 3 (c) triborate unit; Li 2 O-3 B 2 O 3 (d) orthoborate unit; 3 Li 2 O-B 2 O 3 (e) metaborate unit; Li 2 O-B 2 O 3 (f) pyroborate unit; 2 Li 2 O-B 2 O 3 (g) diborate unit; Li 2 O-2 B 2 O 3 (h) loose BO 4. Solid circlea represent boron atoms and open circles oxygen atom. An open circle with a negative sign indicates a non-bridging oxygen. 33
Low frequency Raman spectra in x. Li 2 O-(1 -x)B 2 O 3 glasses The low frequency part of the Raman spectra of glasses is dominated by the so-called “boson” peak. It represents the extent of short-range ordering where a phonon can propagate with no damping. the SCR can be estimated simply from the relation 2 s = vtpc /w where vt is the transverse acoustic waves, w is the peak position of the boson peak. The short-range ordering in lithium borate glasses as shown in figure below does not exceed the dimension of one six-membered ring (8 ). The formation of BO 4 units which results from the addition of Li 2 O to B 2 O 3 frustrates the preferential ordering of the BO 3 triangles and therefore reduces the SCR to 4. 2 (at x = 0. 50) in the lithium borate glasses. 135 cm-1 band in lithium borate glasses may be attributed to the torsion modes of BO 3 and BO 4 units. 34