Exchange Rates Graphing Currency Movements Exchange Rates Nominal


- Slides: 7

Exchange Rates Graphing Currency Movements

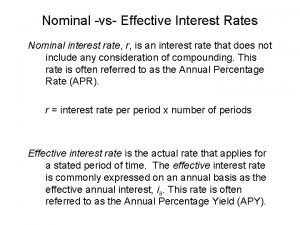
Exchange Rates • Nominal exchange rate- rate you can exchange (swap) currency – Example: Swap Dollars for Euros => Give $1. 16 dollars to receive € 1. 0 Euro • Real exchange rate- rate you can trade actual goods & services between countries (after swapping currencies) – Purchasing Power Parity is when real exchange rate = 1 • Called “law of one price” (buy the same good at same effective price) 1) I-Phone cost $600 in USA 2) You swap Dollars for Yen 3) Buy I-phone in Japan If you break even => real exchange rate = 1

2 Types of Exchange Rates • FIXED exchange rates – a set relationship between a currency value expressed in a precious asset (gold) – Example: Belize Dollar “pegged” to U. S. dollar at 2 B. D. to 1 U. S. D. • A Gold Standard would make all exchange rates fixed • FLOATING exchange rates – free market rates- supply & demand determine exchange rates – Example: almost all major currencies

AD Shifts & Exchange Rates • Appreciation = increase in value of currency – Dollar appreciates => (NX↓ ) (Imports cheaper & Exports more expensive) – AD shifts left & larger Trade Deficit (NX) • Depreciation = decrease in value of currency – Dollar depreciates => (NX↑ ) (Imports more expensive & Exports cheaper) – AD shifts right & smaller Trade Deficit (NX)

Graphing Exchange Rates Market for Euros S 1 Dollar Price of a Euro Hint: pretend a “house of foreign exchange” is located on a remote island where all currency is exchanged…. -------------- 1. 08 $ 1) Currency are priced in other currencies 2) All FX trades are executed in the market foreign exchange Q 1 D 1 House of Foreign Exchange Qty of Euros This label determines the market you are graphing: Market for US dollars Priced in Euros

Euro Depreciates! 1. 40 => 1. 07 Dollars to Euro

Determinants of Exchange Rates 1. Changes in Consumer Tastes 2. Relative Income Changes 3. Relative Price Level Changes “Purchasing Power Parity Theory” 4. Relative Real Interest Rates 5. Speculation & Investment U. S. Income Rises Demand Imports Products should cost the same in real terms in each country Demand Foreign Currency


