Excel Review and Introduction to Qualtrics Excel Review


- Slides: 12
Excel Review and Introduction to Qualtrics
Excel Review and Introduction to Qualtrics Outline § Purchase an Enginius license valid for 6 months § Excel Analysis Tool. Pak (see Excel. Analysis. Tool. Pak. pdf) § Excel Review: Liquid Laundry Exercise § Introduction to Qualtrics
Excel Review and Introduction to Qualtrics Three important steps in analyzing data § Make sure you understand your data (and clean your data if necessary); § Conduct the desired analyses Think about what you want to do conceptually □ Implement what you want to do using a particular software tool □ § Extract marketing insights from the results
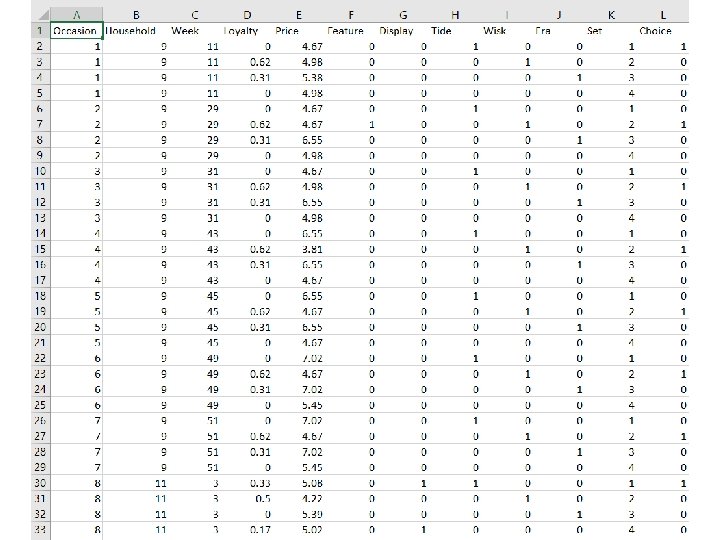
Excel Review and Introduction to Qualtrics Excel Review: Liquid Laundry Exercise § § Verify that there are 52 households, 348 purchase occasions, and a total of 1392 observations. Compute the average price across all four brands and across all 1392 observations and the percentage of time that all four brands were featured or on display. [Hint: Use the AVERAGE function. ] What’s the market share of each brand in this data set? [Hint: Use the AVERAGEIF function. Alternatively, use Pivot Table under the INSERT tab, based on the variables set and choice. Use set as the row variable and choice in the value area. Use Average of choice in Value Field Settings. ] Compute the average price and the percentage of time a brand was featured or on display, separately for each brand. What’s the most inexpensive brand on average and what’s the most expensive. What’s the most heavily promoted brand in terms of feature and display? How do these figures relate to the market shares of the four brands? [Hint: See question c. ]
Excel Review and Introduction to Qualtrics Liquid Laundry Exercise § § Graph the number of purchases for each week across the entire year. Are there certain times during the year when people are more likely to buy liquid laundry detergent? [Hint: Use Pivot Table based on the variables week and choice, with Sum in Value Field Settings for choice. Then do a chart of number of purchases against week. The chart tools are under the INSERT tab. ] Are some households heavier consumers of liquid laundry detergent than others? Which households are the lightest consumers and which are the heaviest consumers? [Hint: Use Pivot Table based on household and choice, with Sum in Value Field Settings for choice. ] Do lower prices increase the likelihood of purchase? Suggest ways in which this question could be answered using these data. Come up with an interesting marketing question that could be answered with these data and explain how you would use the data to answer this question.
Excel Review and Introduction to Qualtrics Liquid Laundry: Questions b, c and d Overall mean Mean for Tide Wisk Era Surf Price 5. 40 5. 86 4. 65 5. 96 5. 15 Feature 0. 06 0. 10 0. 03 0. 06 Display 0. 10 0. 14 0. 18 0. 03 0. 04 Market share 1. 00 0. 24 0. 51 0. 12 0. 13
Excel Review and Introduction to Qualtrics Number of purchases of liquid laundry detergent per week 20 18 16 Number of purchases 14 12 10 8 6 4 2 0 0 10 20 30 Week 40 50 60
Excel Review and Introduction to Qualtrics Number of purchases per household 16 14 12 10 8 6 4 2 0 1 2 3 4 5 6 7 8 9 10 11 12 13 14 15 16 17 18 19 20 21 22 23 24 25 26 27 28 29 30 31 32 33 34 35 36 37 38 39 40 41 42 43 44 45 46 47 48 49 50 51 52
Excel Review and Introduction to Qualtrics Choice probability by rounded price 0. 7 0. 6 0. 5 0. 4 0. 3 0. 2 0. 1 0 3. 5 4 4. 5 5 5. 5 6 6. 5 7
Excel Review and Introduction to Qualtrics § § § Log on to: https: //www. qualtrics. com/login/ Create Project Design your survey Preview survey Distribute Survey Download analyze the data
Excel Review and Introduction to Qualtrics Next time § Introduction to Marketing Analytics § Download the overheads (Introduction. pptx or Introduction. pdf) § Assignments: Chapter 1 in LRB □ Allegro exercise (available on the course website) □