Excel Pivot Tables By Martha Nelson Digital Learning

Excel Pivot Tables By Martha Nelson Digital Learning Specialist

Pivot. Tables summarize and analyze large amounts of data into summary reports.

Parts of a Pivot. Table
 Let’s create our first Pivot table. 1. Open file “Pivot. Table. Class”")
1 a) Let’s create our first Pivot table. 1. Open file “Pivot. Table. Class” 2. Click on Sales tab 3. Select a cell. 4. Insert tab > Pivot. Table (most left side) 5. Click “OK” on pop-up window 6. Automatically directed to new sheet, with Pivot. Table controls.

Create your first table

The Create Pivot. Table Dialog box. The address of the data we just selected appears here. Most frequently we put the new Pivot. Table on an new worksheet. Click OK
 Let’s create our second Pivot. Table, using a Table. 1. Click on")
1 b) Let’s create our second Pivot. Table, using a Table. 1. Click on Make a Table tab 2. Select columns A - E. 3. Insert > Table 4. Click “OK” on pop-up window 5. Automatically directed to Table Tools 6. Insert > Pivot. Table Click “OK” on pop-up window 7. Automatically directed to new sheet, with Pivot. Table controls.

Create a Table Make data into a Table. Then create a Pivot. Table. You don’t need to “Refresh” data when it is updated.

Put Pivot. Table on same page

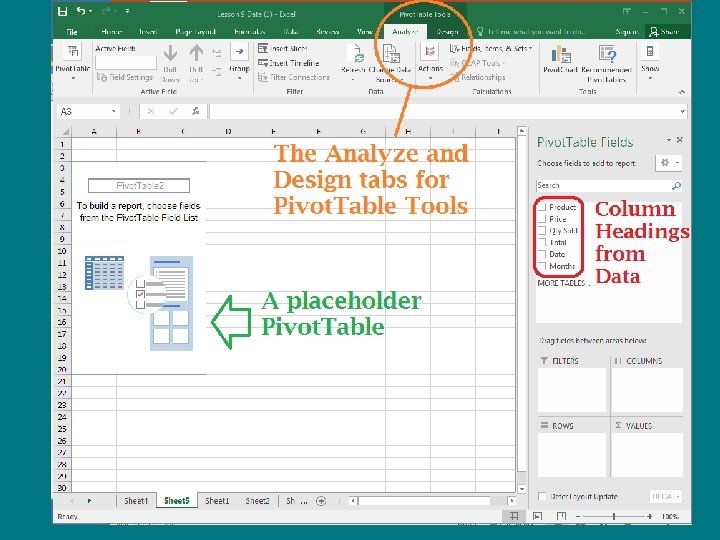
The ribbon for Pivot. Tables

Parts of a Pivot. Table

A closer view: Input to a Pivot. Table
 Data • Select data from a spreadsheet • A Table • External Data")
2) Data • Select data from a spreadsheet • A Table • External Data (not covered in this class)

• Select data from a spreadsheet Method 1: Click on a cell in the data Or Method 2: Make data into a Table, then create Pivot Table Insert > Pivot. Table button (on left most of ribbon. )

When you create a Pivot. Table, a copy of the data is stored in a pivot cache. Any changes to the data won’t show up in the report until you refresh the cache. To refresh the data: • Right-click the pivot table and click Refresh Data. Or • Go to the Pivot. Table Tools Analyze tab, and click the Refresh button in the Data section.

The data needs to be clean. Any blank rows, blank columns, or text in a number field will give unpredictable results. Ex: Summing a number field with blanks becomes a Count. Use Conditional formatting on number fields to search for invalid data.

Find invalid numbers 1. Select a column or range of cells. 2. Home > Conditional Formatting

The data : • Must have Column Headings in the first row. • Must have tabular layout - no blank rows or columns. • No repeating columns of data Normalized data

Discuss why this is a good source of data for a Pivot. Table

Discuss why these are bad sources of data for a Pivot. Table

I recommend this book as the best Pivot. Table reference available. Skokie Library has it available as an electronic book. (EPUB) Excel 2015 Pivot Table Data Crunching, by Bill Jelen and Michael Alexander

More Excel classes: • Charts and Graphs • Formulas and Functions • Making a Budget using Excel

Thank You Want a copy of this presentation? Visit www. skokielibrary. info/handouts where this presentation will be available for four weeks.
 What is a Pivot. Table? And how to get good data to create")
2) What is a Pivot. Table? And how to get good data to create one.
- Slides: 25