Example Black Cherry Trees Example Black Cherry Trees

Example – Black Cherry Trees

Example – Black Cherry Trees The data frame trees is made available in R with >data(trees) and contains the well-known black cherry trees data. These record the girth in inches, height in feet and volume of timber in cubic feet of each of a sample of 31 felled black cherry trees in Allegheny National Forest, Pennsylvania. Note that girth is the diameter of the tree (in inches) measured at 4 ft 6 in above the ground.

 response variable y and seek a reasonable model")
We treat volume as the (continuous) response variable y and seek a reasonable model describing its distribution conditional on the explanatory variables girth and height. This might be a first step to prediction of volume based on further observations of the explanatory variables. Consider the R command >pairs(trees, main = "trees data")
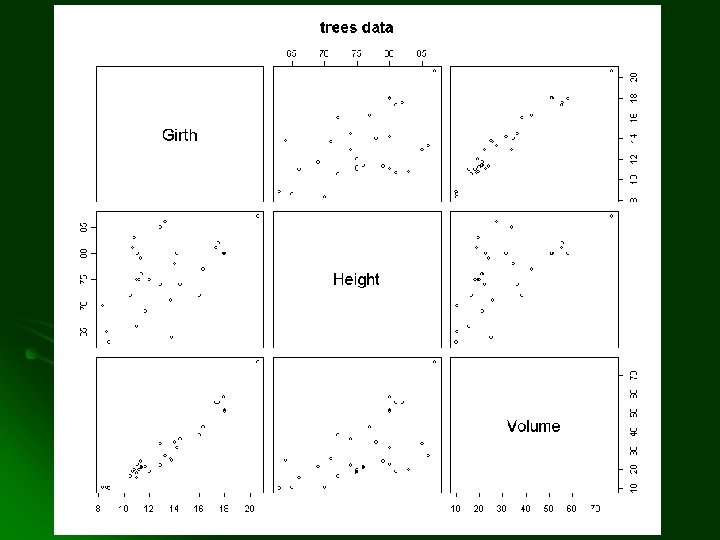

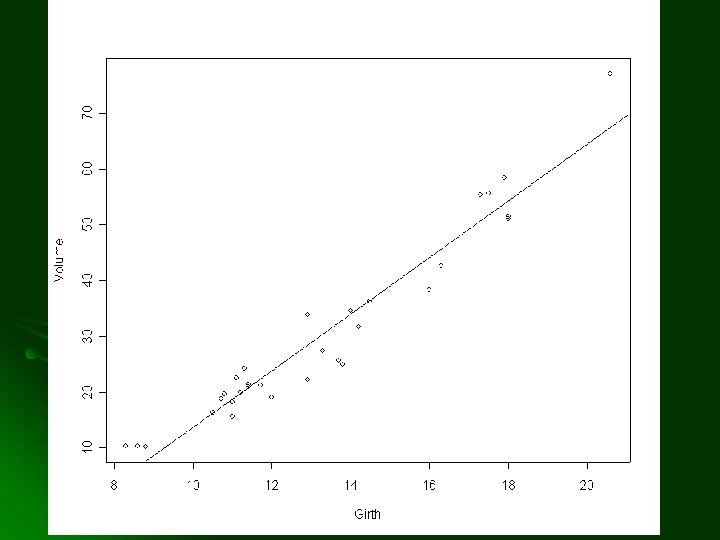
The relationship between girth and volume is especially noticeable. We therefore consider first a linear model Yi=a + bxi +εi where Y is volume and x is girth

The R command for fitting linear models by least squares is lm. We have > trees. model. 1 = lm(Volume~Girth, data=trees) > summary(trees. model. 1)
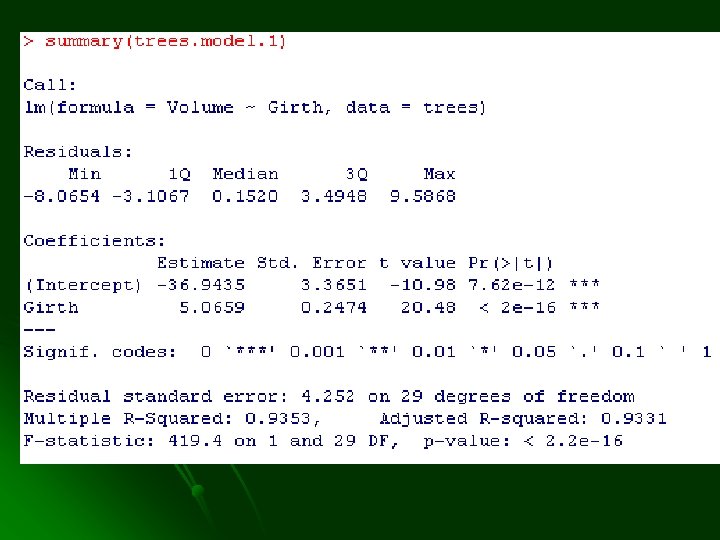

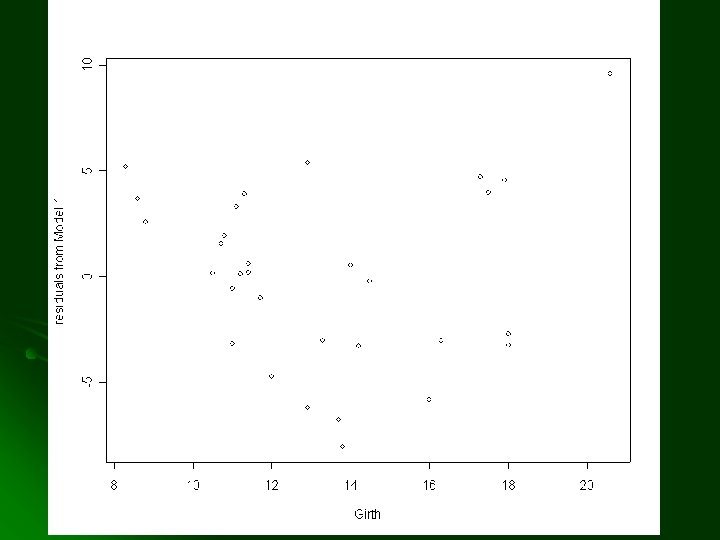
The fitted model is volume = − 36. 9 + 5. 07 × girth + residual Now try: > plot(Volume~Girth, data=trees) > abline(coef(trees. model. 1)) > plot(resid(trees. model. 1)~Girth, data=trees, ylab="residuals from Model 1")
- Slides: 11