
EXAMPLE 1 Graph a rational function of the
- Slides: 7
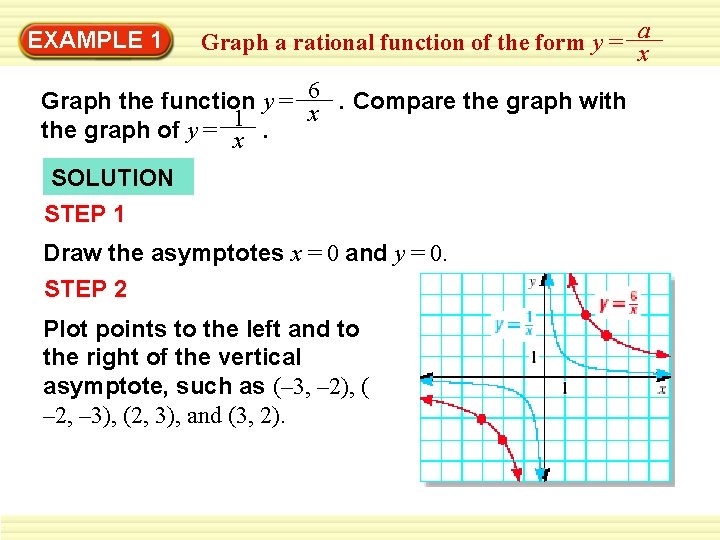
EXAMPLE 1 Graph a rational function of the form y = ax Graph the function y = 6 x. Compare the graph with the graph of y = 1 x. SOLUTION STEP 1 Draw the asymptotes x = 0 and y = 0. STEP 2 Plot points to the left and to the right of the vertical asymptote, such as (– 3, – 2), ( – 2, – 3), (2, 3), and (3, 2).
EXAMPLE 1 Graph a rational function of the form y = ax STEP 3 Draw the branches of the hyperbola so that they pass through the plotted points and approach the asymptotes. The graph of y = 6 x lies farther from the axes than the graph of y = 1 x. Both graphs lie in the first and third quadrants and have the same asymptotes, domain, and range.
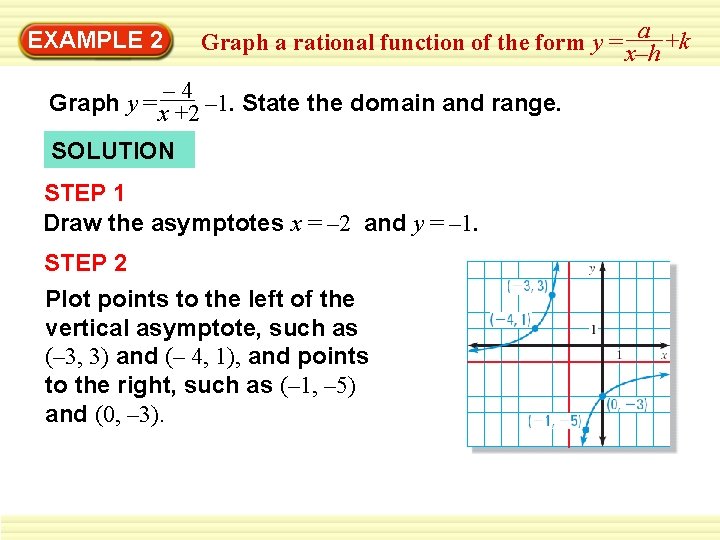
EXAMPLE 2 a +k Graph a rational function of the form y = x–h – 4 Graph y = x +2 – 1. State the domain and range. SOLUTION STEP 1 Draw the asymptotes x = – 2 and y = – 1. STEP 2 Plot points to the left of the vertical asymptote, such as (– 3, 3) and (– 4, 1), and points to the right, such as (– 1, – 5) and (0, – 3).
EXAMPLE 2 a +k Graph a rational function of the form y = x–h STEP 3 Draw the two branches of the hyperbola so that they pass through the plotted points and approach the asymptotes. The domain is all real numbers except – 2, and the range is all real numbers except – 1.
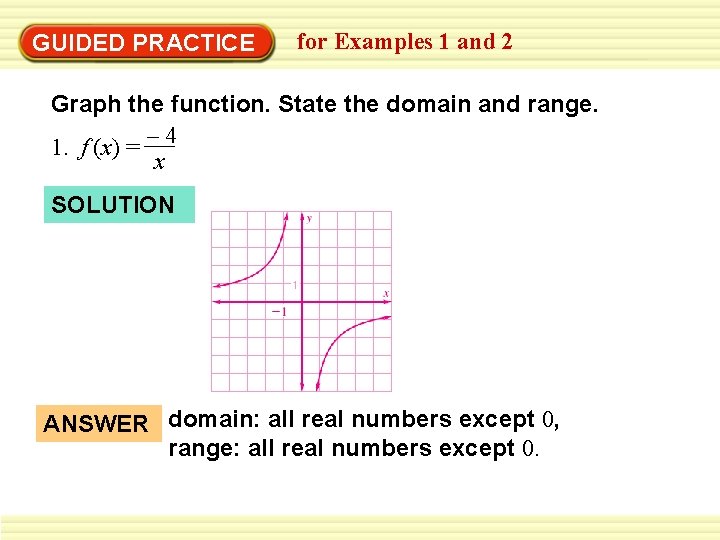
GUIDED PRACTICE for Examples 1 and 2 Graph the function. State the domain and range. – 4 1. f (x) = x SOLUTION ANSWER domain: all real numbers except 0, range: all real numbers except 0.
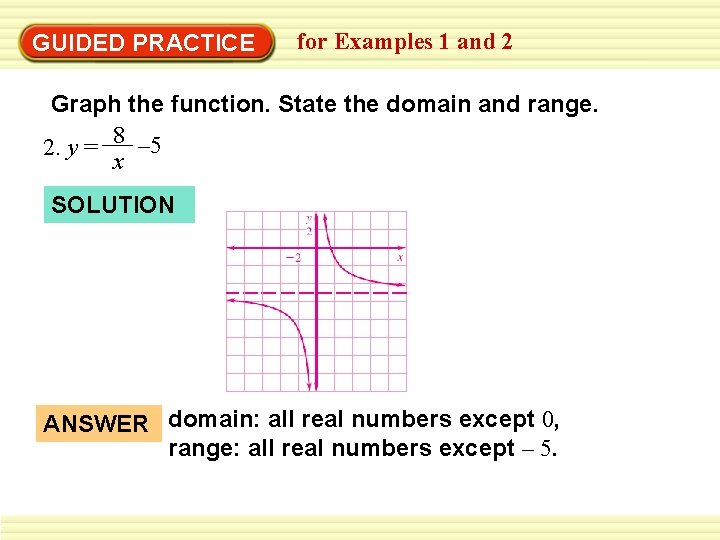
GUIDED PRACTICE for Examples 1 and 2 Graph the function. State the domain and range. 8 – 5 2. y = x SOLUTION ANSWER domain: all real numbers except 0, range: all real numbers except – 5.
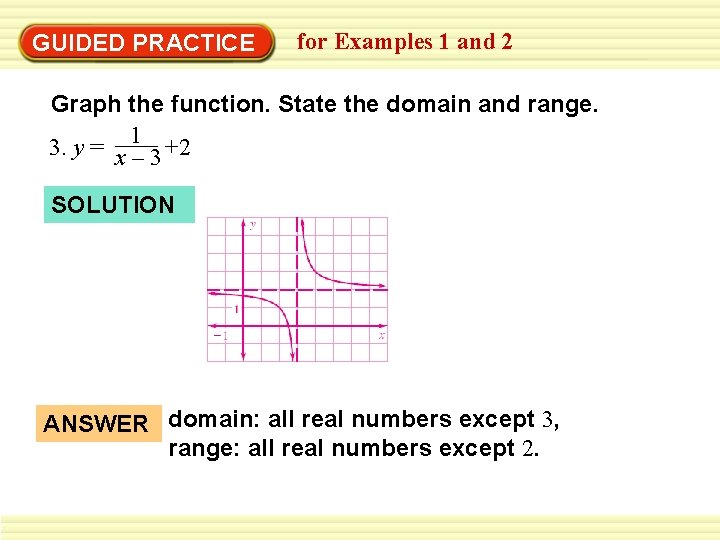
GUIDED PRACTICE for Examples 1 and 2 Graph the function. State the domain and range. 1 3. y = x – 3 +2 SOLUTION ANSWER domain: all real numbers except 3, range: all real numbers except 2.