Examination of wires and cables ranbsingh Objects material

Examination of wires and cables ranbsingh
 • Natural * major and minor constituents controlled by nature (within specific")
Objects (material) • Natural * major and minor constituents controlled by nature (within specific range) * trace constituents vary at random * change with time (environment, source etc. ) • Manufactured * major and minor constituents controlled by manufacturer (within specific range) * trace constituents vary at random * bulk production and wide distribution ranbsingh

Ingot Wire bars Rolled wire rods Hard drawn wire Rod A known Rod B obscure known
 (class characteristics) • physical match of")
Examination of wires • Measurement of gauge (diameter) (class characteristics) • physical match of cut ends (individual characteristics) die marks on the surface (class/individual characteristics) • (class material characteristics) • electrical(class resistance characteristics) • trace element profile (individual characteristics) ranbsingh

Measurement of diameter Diameter should be measured in mutually perpendicular directions at a place Readings should be taken at least, at three places on a sample Average of the above six readings should be taken for comparison Telegraph wires • 2. 43 - 2. 53 mm • 2. 77 - 2. 87 mm • 3. 42 - 3. 52 mm ranbsingh

physical match of cut ends
 on the surface of wires")
Comparison of striations (die marks) on the surface of wires
 Determination")
Forensic Trace element analysis Determination of a specific element (for example, Contact transfers) Determination of a group of elements (for example, gun shot residue) Trace element profiling for characterization (for example: metallic wire, opium) Common contaminants in known and questioned samples Levels of constituents major constituents trace constituents minor constituents ultra trace constituents 10 - 100 percent 1 - 100 ppm . 1 - 10 percent. 001 - 1 ppm ultra-ultra trace constituents less than . 001 ppm

Composition Of Bauxite Moisture 1. 0 LOI 22. 3 Cr O 3 2 Mg. O 0. 07 0. 03 Al O 2 3 51. 3 Mn. O 2 0. 02 Fe O 2 3 14. 1 Zr. O 2 0. 10 2 8. 0 Zn. O 0. 01 Si. O 2 3. 0 Ga O 2 3 0. 008 VO 2 5 0. 2 Be. O 0. 001 PO 2 5 0. 19 Specific gravity 2. 8 Ca. O 0. 08 Ti. O ranbsingh

Impurities detected in aluminum Antimony Calcium Gallium Hafnium Lutetium Magnesium Arsenic Cerium Beryllium Chromium Iron Boron Cobalt Bismuth Copper Lanthanum Nickel Lead Phosphorous Manganese spectrographic analysis elements analyzed coefficient of variation(%) elements recommended for characterization B 5 Cr 7 Cu Fe Mg Mn 22 7 21 7 Ni, Cr, B, Mn, Fe neutron activation analysis elements analyzed coefficient of variation(%) elements recommended for characterization Tagging: silver Cu Cr Fe Ga Hf 6. 5 1. 8 3. 5 4. 5 10 Potassium Samarium Tin Titanium Scandium Vanadium Ytterbium Zinc Zirconium Silicon Sodium Ni 7 Pb 14 Ti 12 V 15 in order of discrimination potential La Mn Sc Sm 11 2. 5 6. 5 12. 5 in order of discrimination potential Mn, Cr, Hf, Sc, Fe ranbsingh
 Antimony Cobalt Arsenic Gold Bismuth")
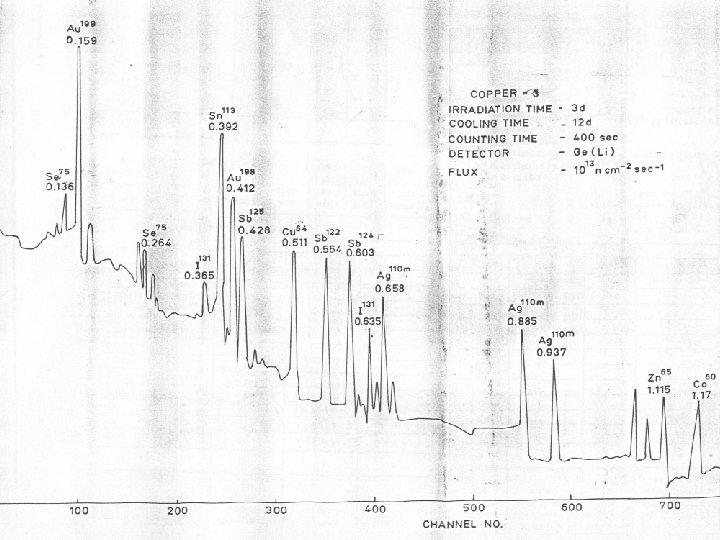
Trace element profile of copper Impurities detected(NAA and OES) Antimony Cobalt Arsenic Gold Bismuth Iron Iridium Lead Nickel Tellurium Silver Tin Manganese. Selenium Zinc Neutron activation analysis elements recommended for characterization Ag, Se, Sb, Au ranbsingh

Fifty six samples from a hundred meter copper wire Elements Ag Se Sb Au Mean concentration 12. 7 4. 3 4. 0 0. 6 Coefficient of variation(%) 3. 5 4. 2 2. 2 3. 8 (value in ppm) ranbsingh

Comparison of copper wires concentration in ppm Ag Au Sb Se could not be 14. 0 0. 51 7. 0 2. 7 distinguished 0. 2 0. 03 2. 2 0. 7 on the basis 0. 3 0. 03 2. 1 0. 7 Case A questioned known Case B questioned known of physical, * * chemical, and electrical properties 14. 0 0. 52 7. 0 2. 7 7. 9 0. 06 0. 5 4. 5 14. 0 0. 52 7. 0 2. 7

Strands of different Cables having similar impurity levels Ag Au Sb Se B 2 10. 4 0. 074 4. 4 0. 8 C 17 10. 1 0. 074 4. 0 0. 8 Average values of impurity levels in three different multi-stranded cables Ag Au Sb Se A 10. 25 0. 0628 0. 302 1. 47 B 11. 76 0. 0464 2. 413 0. 65

Different Strands of the same Cable having indistinguishable impurity levels Ag Au Sb Se A 2 12. 5 0. 018 0. 20 0. 6 A 3 12. 3 0. 017 0. 22 0. 6 A 9 10. 9 0. 017 0. 18 0. 5 A 10 11. 0 0. 019 0. 5 B 3 7. 6 0. 005 0. 10 0. 4 B 9 7. 6 0. 004 0. 08 0. 3 B 19 7. 8 0. 006 0. 08 0. 3 C 14 12. 1 0. 011 0. 13 0. 5 C 15 12. 1 0. 012 0. 13 0. 4

Physical correspondence of strands

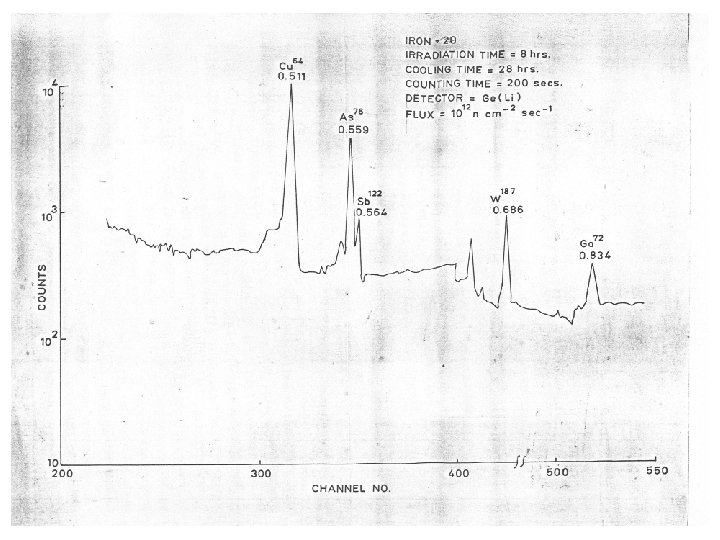
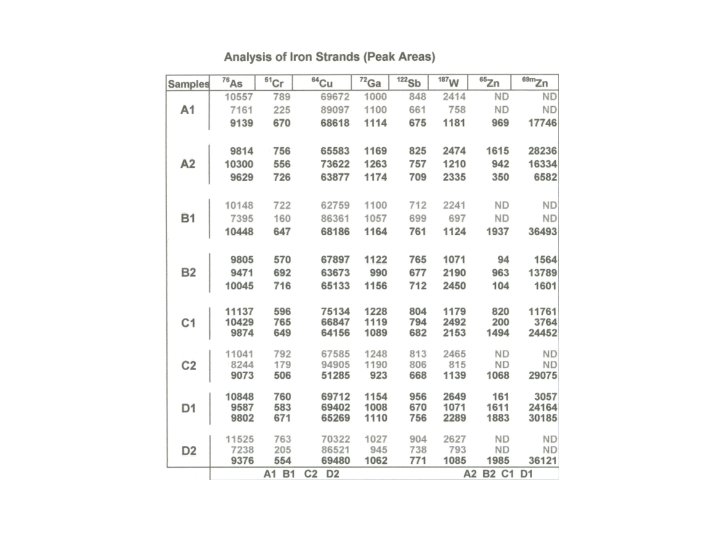
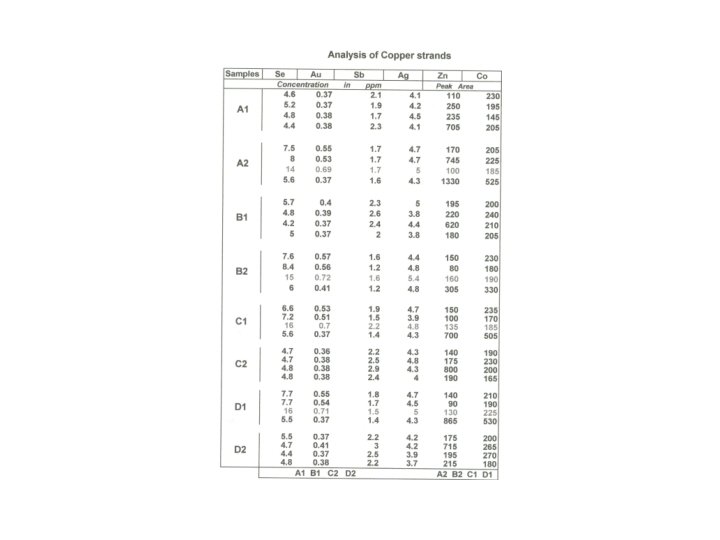
Wire links transmitter with suspect terrorist two pairs of flex from the transmitter A 1, A 2 & B 1, B 2 two pairs of flex from the suspect C 1, C 2 & D 1, D 2 Each had seven strands; 3 -iron strands & 4 -copper strands Diameter of each strand was 0. 27 mm All the strands were marked sequentially and analyzed Neutron Activation Analysis technique was used Flexes could be grouped into; (1) A 1, B 1, C 2, D 2 and (2) A 2, B 2, C 1, D 1 The suspect was associated with the transmitter
 1977 1997 A")
Characterization of Copper Wires by Trace Element profile (Neutron Activation Analysis) 1977 1997 A priori assumptions -within agreement, -between variations were verified Trace element profile of one hundred and eleven copper wires from actual cases were compiled Forty five inter-comparisons were made, and it was shown that the levels of the elements: Ag, Au, Se, and Sb could differentiate all the wires Six thousand one hundred and five inter-comparisons were made. The wires could be grouped into one hundred different sources only The above method was used to analyze and report on case samples with confidence If indistinguishable samples were not duplicates, the confidence in forming opinion is affected. Determination of a few more elements may be essential ranbsingh

Characterization of Wires by their Trace Element Profile is it a Definitive Identification Technique Multi-stranded Cables - comparison of trace element concentration in corresponding strands yields conclusive results (beyond reasonable doubts) Wire (single strand) - indistinguishable (highly consistent with) - distinguishable (mismatch)

Characterization of Metals by their Trace Element Profile Whether Different Databases on Trace Impurities can be Shared Accuracy - closeness of the measured value to the true value Systematic error in measurements (bias) - difference between measured and true values - an index of precision Standard deviation Generation of Analytical data of Known Quality * Validation of analytical technique * Quality Assurance Measures
- Slides: 24