
Exam 2 No cheat sheet Bring a calculator

Exam 2 • No cheat sheet • Bring a calculator. • You may NOT use the calculator on your phone or i. Pad or computer or other media device • Short essay answers • Math problems to be solved • Know all materials covered including last Thursday’s lecture • Materials presented in Lab can also be include in the exam
Materials for Lecture 08 • Chapters 4 and 5 • Chapter 16 Sections 3. 2 -3. 7. 3 • Lecture 08 Bernoulli. xlsx • Lecture 08 Normality Test. xlsx • Lecture 08 Simulation Model with Simetar. xlsx • Lecture 08 Normal. xlsx • Lecture 08 Simulate a Reg Model. xlsx

Stochastic Simulation • Purpose of simulation is to estimate the unknown probability distribution for a KOV so decision makers can make a better decision – Simulate because we cannot observe and measure the KOV distribution directly – Want to test alternative values for control variables • Business simulation models are basically an equation to calculate profit Profit = Price * Quantity – VC * Quantity - FC Profit = * 0. 00 50. 00 100. 00 - VC * 100. 00 - FC

Stochastic Simulation • Simulation sample PDFs for random variables, calculate values of KOV for many iterations • Record KOV • Analyze KOV distribution
Stochastic Variables • Any variable the decision maker cannot control is stochastic • In agriculture we think of yield as stochastic as it is subject to weather • For most businesses the prices of inputs and outputs are not directly controlled by management so they are stochastic. – Production may be random as well. • Include the most important stochastic variables in simulation models – Your model can not include all random variables
Stochastic Simulation • In economics we use simulation because we can not experiment on live subjects, a business or the economy without injury • In other fields they can fabricate an experiment – Health sciences they feed/treat multiple rats on different chemicals – Animal science feed multiple pens of steers, chickens, cows, etc. – Engineers run a motor under different controlled situations (temp, RPMs, lubricants, fuel mixes) – Vets treat different pens of animals with different meds – Agronomists set up randomized block treatments for a particular seed variety • All of these are just different iterations of “models”
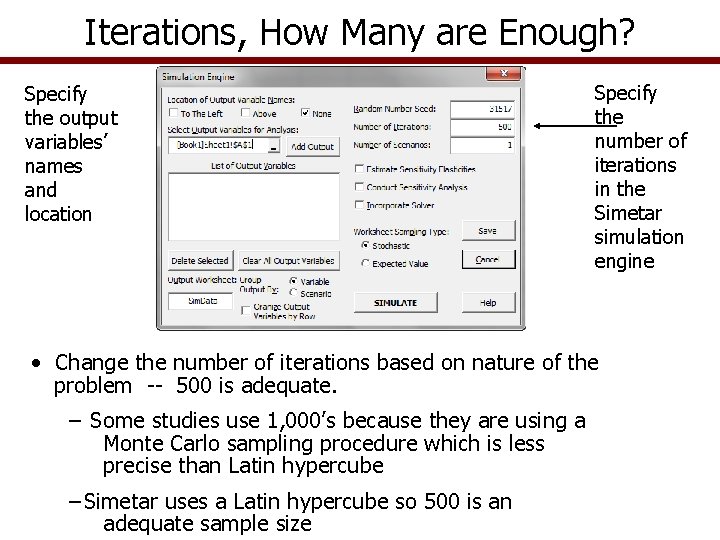
Iterations, How Many are Enough? Specify the output variables’ names and location Specify the number of iterations in the Simetar simulation engine • Change the number of iterations based on nature of the problem -- 500 is adequate. − Some studies use 1, 000’s because they are using a Monte Carlo sampling procedure which is less precise than Latin hypercube −Simetar uses a Latin hypercube so 500 is an adequate sample size
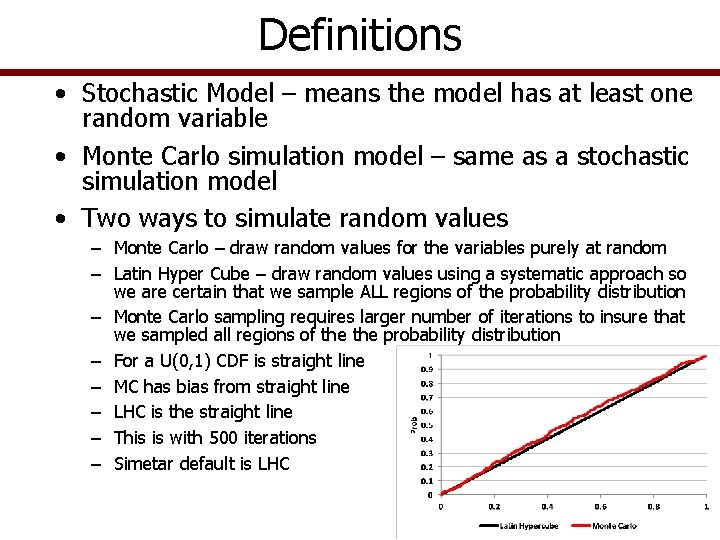
Definitions • Stochastic Model – means the model has at least one random variable • Monte Carlo simulation model – same as a stochastic simulation model • Two ways to simulate random values – Monte Carlo – draw random values for the variables purely at random – Latin Hyper Cube – draw random values using a systematic approach so we are certain that we sample ALL regions of the probability distribution – Monte Carlo sampling requires larger number of iterations to insure that we sampled all regions of the probability distribution – For a U(0, 1) CDF is straight line – MC has bias from straight line – LHC is the straight line – This is with 500 iterations – Simetar default is LHC
Simulating Random Variables • Normal distribution used frequently, particularly when simulating residuals for a regression model • Parameters for a Normal distribution – Mean expressed as Ῡ or Ŷ – Standard Deviation σ (or SEP from a regression model) • Assume yield is a random variable and have production function data, such as: – Ỹ = a + b 1 Fert + b 2 Water + ẽ – Deterministic component is: a + b 1 Fert + b 2 Water – Stochastic component is: ẽ • Stochastic component, ẽ, is assumed to be distributed Normal – Mean of zero – Standard deviation of σe • See Lecture 8 Simulate a Reg Model. XLS
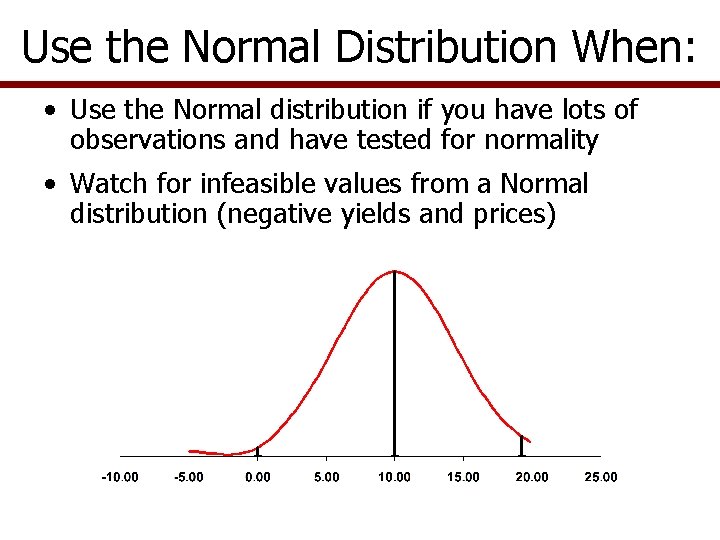
Use the Normal Distribution When: • Use the Normal distribution if you have lots of observations and have tested for normality • Watch for infeasible values from a Normal distribution (negative yields and prices)
Problems with the Normal • It is easy to use, so it often used when it is not appropriate • It does not allow for extreme events (Black Swans) – No way to account for record breaking outliers because the distribution is defined by Mean and Std Dev. • Std Dev is the “average” deviation from the mean and averages out BS’s • Market outliers are washed away in the average • It is the foundation for Sigma 6 – So Sigma 6 suffers from all of the problems above – Creates a false sense of security because it never sees a record braking outlier
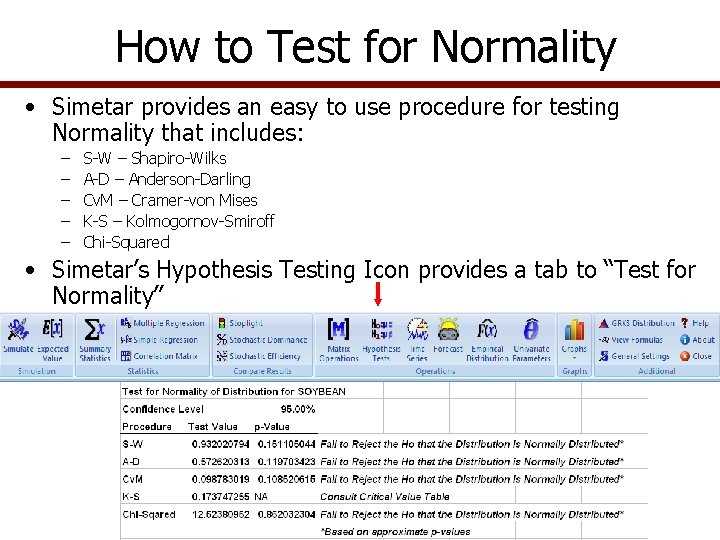
How to Test for Normality • Simetar provides an easy to use procedure for testing Normality that includes: – – – S-W – Shapiro-Wilks A-D – Anderson-Darling Cv. M – Cramer-von Mises K-S – Kolmogornov-Smiroff Chi-Squared • Simetar’s Hypothesis Testing Icon provides a tab to “Test for Normality”
Simulating a Normal Distribution • Normal Distribution =NORM( Mean, Standard Deviation) =NORM( 10, 3) =NORM( A 1, A 2) • Standard Normal Deviate (SND) =NORM(0, 1) or =NORM() • SND is the Z-score for a standard normal distribution allowing you to simulate any Normal distribution • SND is used as follows: Ỹ = Mean + Standard Deviation * NORM(0, 1) Ỹ = Mean + Standard Deviation * SND Ỹ = A 1 + (A 2 * A 3) where a SND is in cell A 3
Truncated Normal Distribution • General formula for the Truncated Normal =TNORM( Mean, Std Dev, [Min], [Max], [USD] ) • Truncated Downside only =TNORM( 10, 3, 5) The values in [ ] are optional • Truncated Upside only =TNORM( 10, 3, , 15) • Truncated Both ends =TNORM( 10, 3, 5, 15) • Truncated both ends with a USD in general form =TNORM( 10, 3, 5, 15, [USD])
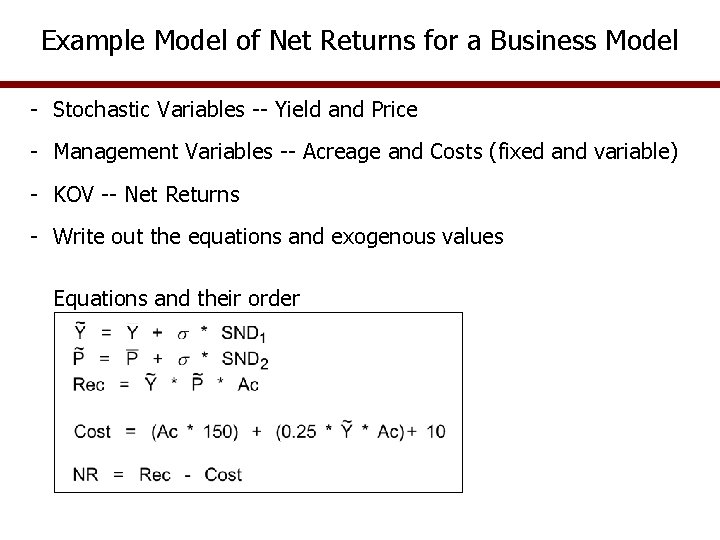
Example Model of Net Returns for a Business Model - Stochastic Variables -- Yield and Price - Management Variables -- Acreage and Costs (fixed and variable) - KOV -- Net Returns - Write out the equations and exogenous values Equations and their order
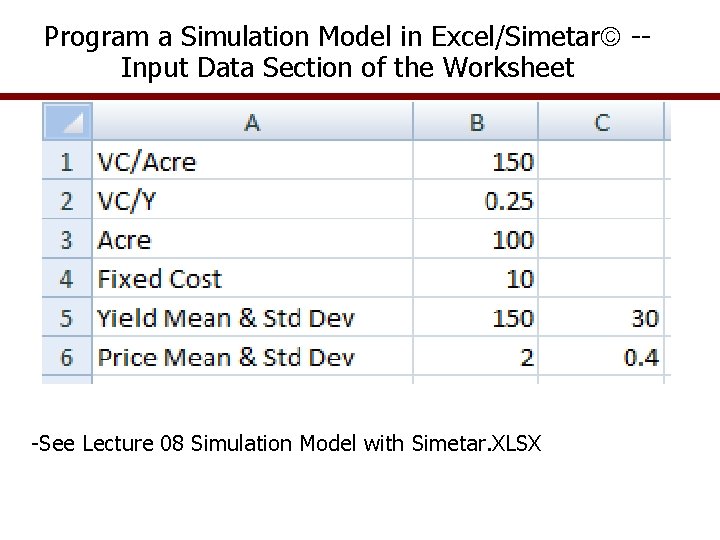
Program a Simulation Model in Excel/Simetar -Input Data Section of the Worksheet -See Lecture 08 Simulation Model with Simetar. XLSX
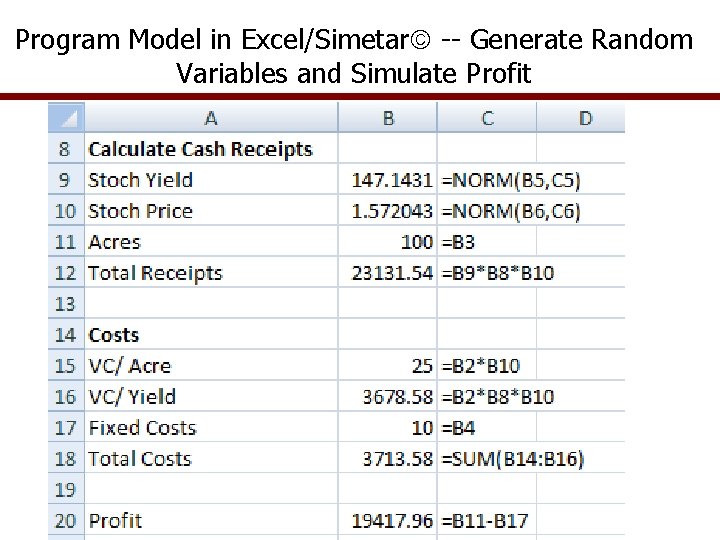
Program Model in Excel/Simetar -- Generate Random Variables and Simulate Profit
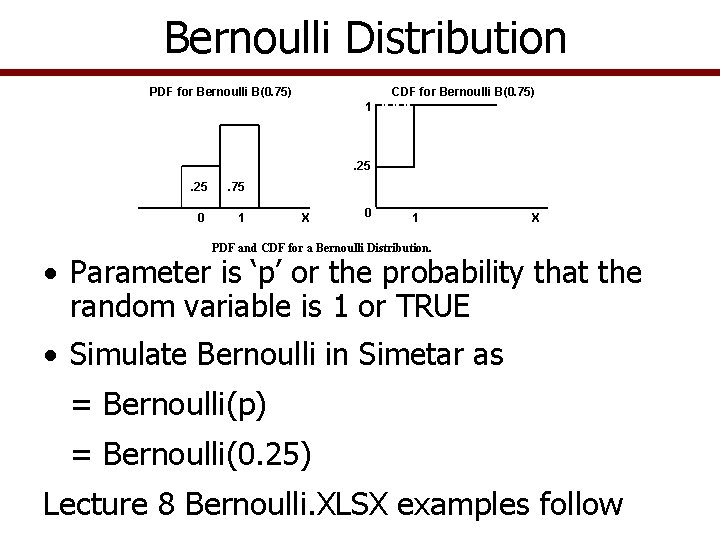
Bernoulli Distribution PDF for Bernoulli B(0. 75) CDF for Bernoulli B(0. 75) 1 . 25 . 75 0 1 X PDF and CDF for a Bernoulli Distribution. • Parameter is ‘p’ or the probability that the random variable is 1 or TRUE • Simulate Bernoulli in Simetar as = Bernoulli(p) = Bernoulli(0. 25) Lecture 8 Bernoulli. XLSX examples follow
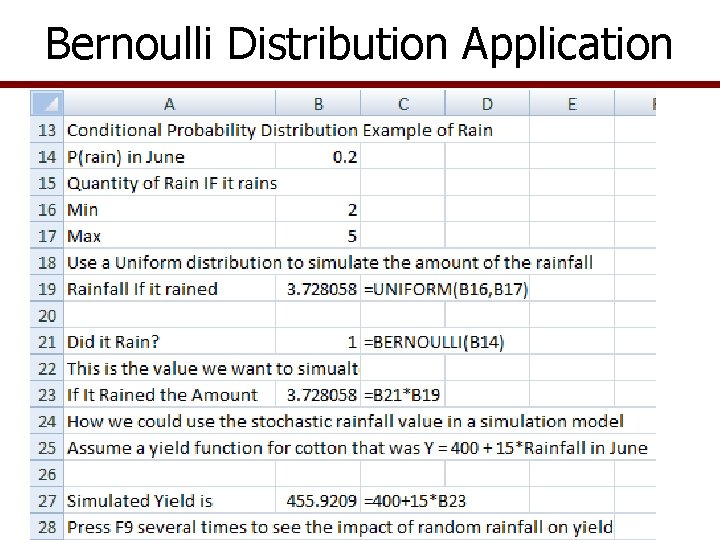
Bernoulli Distribution Application
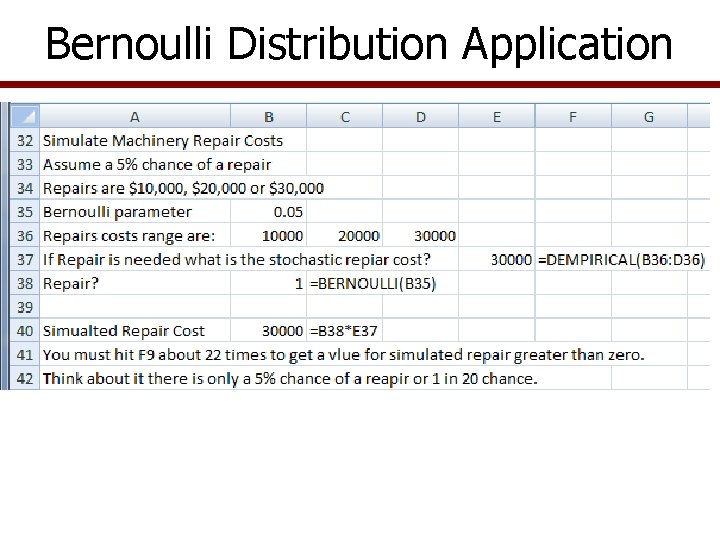
Bernoulli Distribution Application
- Slides: 20