EVSC 1300 Global Warming Mauna Loa Carbon Dioxide

EVSC 1300 Global Warming

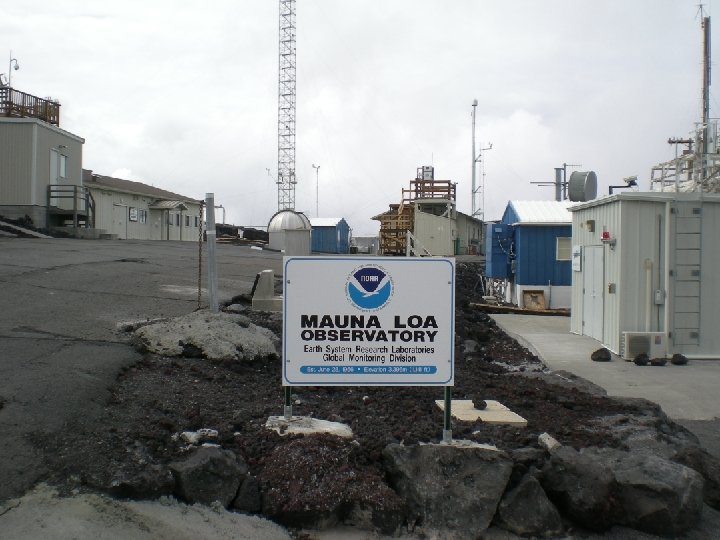
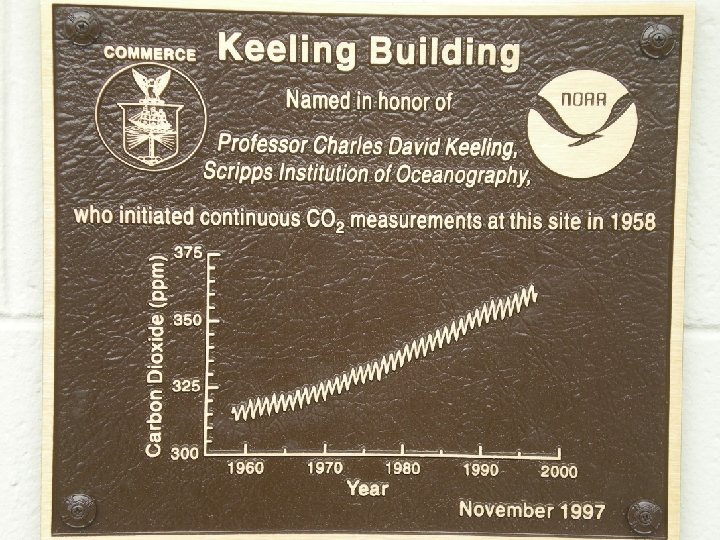
Mauna Loa Carbon Dioxide Record Pre-industrial background = 280 ppm Current level = 408 ppm

Clouds and Radiation * ** Ice clouds are net warmers. Absorption of infrared is greater than solar reflection. * *

Clouds and Radiation Water clouds are net coolers. Absorption of infrared is less than solar reflection.
")
Greenhouse Gas Trends Since 1979 Montreal Protocol (NOAA: Earth System Research Laboratory)
")
IPCC ESTIMATES OF RADIATIVE FORCING (RF)
 *change in net radiation arising from some external factor (e. g.")
Radiative Forcing (Definition) *change in net radiation arising from some external factor (e. g. , greenhouse gases, aerosols, etc. ) positive more energy in system warmer negative less energy in system cooler *relative to 1750 (pre-industrial baseline) *global annual average values
 ? (Annual values are departures from the 20 th")
Global Annual Temperature Anomalies (°C) ? (Annual values are departures from the 20 th century mean temperature)

Global Carbon Emission Estimates Source: CDIAC

Global Annual Temperature Anomalies
")
GLOBAL TEMPERATURES: 1970– 2013 (Trenberth et al. , 2014)

GLOBAL SOLAR RADIATION 1611 -2009

Change in Solar “Constant” over Time

Global Solar Radiation Global Temperature

Reconstructed Solar Output vs. Global Temperatures 0. 2 Reconstructed Solar Output Reconstructed Temperature History Thermometer Temperature History 1368 0. 0 1366 – 0. 2 – 0. 4 1364 – 0. 6 1600 1700 1800 1900 2000 Solar Output (W/sq. m) Temperature Departure (°C) 1370

GLOBAL SATELLITE TEMPERATURES 1979– 2017 El Niño Volcano

COMPARISON OF SURFACE AND SATELLITE TEMPERATURES 1979– 2016 Surface vs. Satellite Temperatures (Climate 4 you. com)

DJF Temperature Change from 1880 -1889 mean by 2040 -2049 predicted by the Max-Plank Institute model
 http: //data. giss. nasa. gov/gistemp/maps/")
Observed December-February Temperature Change (1988 -2017 minus 1951 -1980) http: //data. giss. nasa. gov/gistemp/maps/
 http: //data. giss. nasa. gov/gistemp/maps/")
Observed June-August Temperature Change (1988 -2017 minus 1951 -1980) http: //data. giss. nasa. gov/gistemp/maps/
 S. Pole")
Temperature Change by Latitude S. Pole N. Pole (Note different y-axis scales) S. Pole N. Pole

Global Precipitation over Continents Wetter Drier
 (1993– 2003) (IPCC FAR)")
Sea-Level Components (1961– 2003) (1993– 2003) (IPCC FAR)

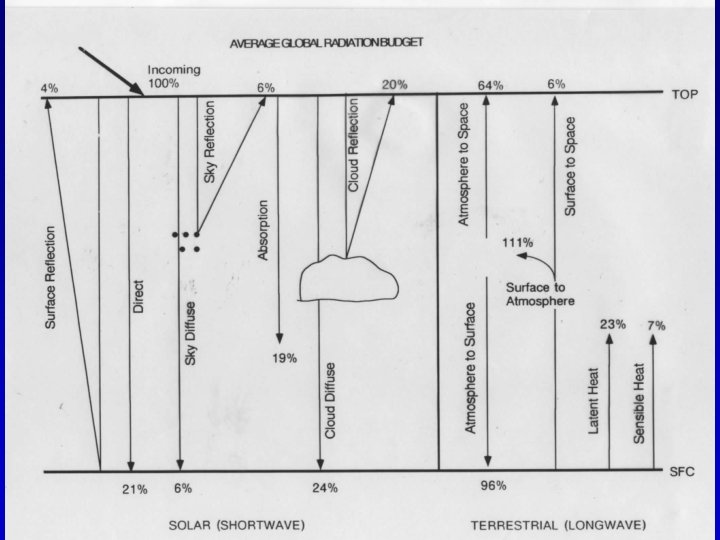
Quick Summary—Global Warming: • Change in one component of radiation balance can impact all other components • The 50% increase in atmospheric CO 2 levels since preindustrial times is caused by fossil fuel use • Surface temperatures have increased 0. 5°C– 1. 0°C over the past century in an irregular pattern of warming/cooling • Warming is strongest in the high latitudes and in winter, although warming is evident across most of the planet • Natural temperature fluctuations are large and related to factors like El Niño (warming) and volcanoes (cooling)
- Slides: 28