Evolution of Texas climate Richard Casteel Jackson School


- Slides: 19
Evolution of Texas climate Richard Casteel Jackson School of Geosciences 11 -24 -09
Outline • Modern day Texas climate • Climate change - varying resolutions – Geologic indicators – Soil indicators – Fossils and isotopes – Tree ring data • Current research
Modern Texas climate • • • Hot, dry summers Mild, dry winters Wet springs/falls High rate of PET Hot spot for climate change?
Geologic map of Texas
Geologic Map of Texas
Soil map of Texas • Dominated by: – Thin, rocky soils • Thicker in past – Upland soils – Cave deposits
Soil degradation - Sr isotopes • Carbon dated soil deposits Hall’s Cave • Gopher/vole tooth enamel – Diet • Hackberry seed fossils – Root position (Cooke et al, 2003)
Paleoclimate inferred from fossils and isotopes 1 0 -1 -2 Last glacial maximum -3 -4 -5 <----cooler-----warmer----> 2 -6 24 23 22 21 20 19 18 17 16 15 14 13 12 11 10 Time before present (ka) 9 8 7 6 5 4 3 2 1 0
24 -14 ka. • Cooler and wetter – Faunal evidence – Pollen data – Alluvium δ 13 C values of -21‰ • C 3 plant abundance 62 - 72 73 - 78 79 - 82 83 - 86 87 - 94
6 -2 ka. INFERRED TRENDS IN PALEOCLIMATE 1 Warm/ dry period 0 -1 -2 -3 -4 -5 <----cooler-----warmer----> 2 -6 24 23 22 21 20 19 18 17 16 15 14 13 12 11 10 Time before present (ka) 9 8 7 6 5 4 3 2 1 0
6 -2 ka. • δ 13 C values – Snail shells (Goodfriend and Ellis, 2000) – Alluvium and soil (Nordt et al, 1994) – More positive values = higher abundance C 4 plants
1698 -1980 • Post oak chronology • Annual resolution • Calibrated with modern record (Stahle and Cleaveland, 1998)
June PDSI derived from tree rings Central Texas 6 4 June PDSI 2 0 June PDSI -2 -4 -6 -8 1690 1710 1730 1750 1770 1790 1810 1830 1850 Date 1870 1890 1910 1930 1950 1970 (Data from Stahle and Cleaveland , 1988)
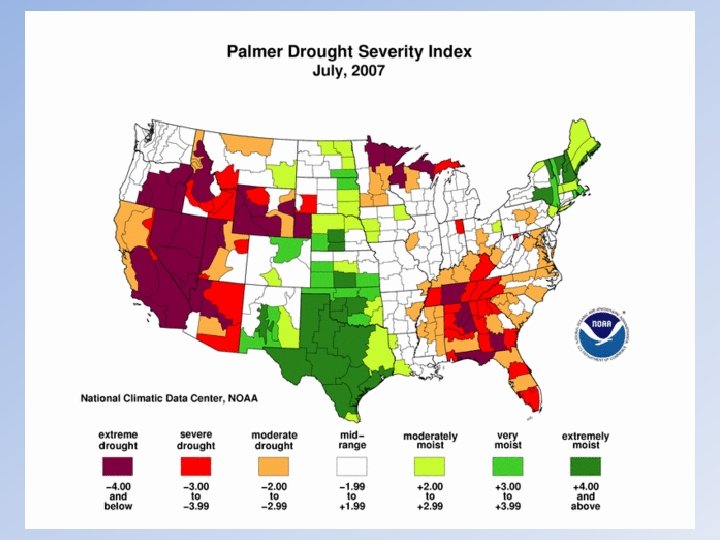
Drought of the 1950 s http: //www. ncdc. noaa. gov/paleo/pdsidata. html
Drought of the late 1850 s-1860 s http: //www. ncdc. noaa. gov/paleo/pdsidata. html
Drought of the 1770 s http: //www. ncdc. noaa. gov/paleo/pdsidata. html
Current research • Extend the high resolution climate record – Past drought for water planning – Bald cypress trees – Preliminary results http: //www. news 8 austin. com/content/your_news/default. asp? Ar. ID=255153
QUESTIONS?