Evolution of Proteins and Genomes Biochemistry and Molecular

Evolution of Proteins and Genomes Biochemistry and Molecular Genetics Computational Bioscience Program Consortium for Comparative Genomics University of Colorado School of Medicine David. Pollock@uchsc. edu www. Evolutionary. Genomics. com

Evolution of Proteins Jason de Koning

Description Focus on protein structure, sequence, and functional evolution Subjects structural comparison and prediction, biochemical adaptation, evolution of protein complexes, probabilistic methods for detecting patterns of sequence evolution, effects of population structure on protein evolution, lattice and other computational models of protein evolution, protein folding and energetics, mutagenesis experiments, directed evolution, coevolutionary interactions within and between proteins, and detection of adaptation, diversifying selection and functional divergence.

Reconstruction of Ancestral Function

How do You Understand a New Protein?
 Computational (structure prediction…)")
Structural and Functional Studies Experimental (NMR, X-tallography…) Computational (structure prediction…)

Comparative Sequence Analysis Looking at sets of sequences A common but wrong assumption: sequences are a random sample from the set of all possible sequences Mouse: Rat: Baboon: Chimp: …TLSPGLKIVSNPL… …TLTPGLKLVSDTL… …TVSPGLRIVSDGV… …TISPGLVIVSENL. . . Conserved proline Variable “High entropy”

Comparative Sequence Analysis Looking at sets of sequences In reality, proteins are related by evolutionary process

Confounding Effect of Evolution …TLSKRNPL… S F P T …TLFKRNPL… …TLSKRNT… …TLFKRNP… …TLSKRNT…

Confounding Effect of Evolution …TLSKRNPL… S F P T …TLFKRNPL… …TLSKRNT… …TLFKRNP… …TLSKRNT… Everytime there is an F, there is a P! Everytime there is an S, there is a T!

Ways to Deal with This… Most common: Ignorance is Bliss Some: Try to estimate the extent of the confounding (Mirny, Atchley) Remove the confounding (Maxygen) Include evolution explicitly in the model (Goldstein, Pollock, Goldman, Thorne, …)

Fitness Selective Pressure Folding Mouse: Rat: Baboon: Chimp: Stability Function Selection Stochastic Realizations A B C …TLSPGLKIVSNPL… …TLTPGLKLVSDTL… …TVSPGLRIVSDGV… …TISPGLVIVSENL. . .

Understanding Selective Pressure Folding Mouse: Rat: Baboon: Chimp: Stability Function Data Model A B C …TLSPGLKIVSNPL… …TLTPGLKLVSDTL… …TVSPGLRIVSDGV… …TISPGLVIVSENL. . .

Purines Pyrimidines DNA

What does DNA do? Replication Translation Folding m. RNA DNA Protein Function

Mutations result in genetic variation

Selective Pressure

Genetic changes …UGUACAAAG… Substitution Insertion Deletion …UGUAUAAAG… …UGUAAAAG… …UGUUACAAAG…

Substitutions Can Be: Purines: Transitions A G Transversions Pyrimidines: C T

Substitutions in coding regions can be: Cys Arg Lys UGU/AGA/AAG Silent Nonsense Missense UGU/CGA/AAG Cys Arg Lys UGU/GGA/AAG Cys Gly Lys First position: 4% of all changes silent Second position: no changes silent Third position: 70% of all changes silent (wobble position) UGU/UGA/AAG Cys STOP Lys

Homologous crossover Uneven crossover leading to gene deletion and duplication Gene conversion

Fate of a duplicated gene Keep on doing whatever it originally was doing Lose ability to do anything (become a pseudogene) Learn to do something new (neofunctionalization) Split old functions among new genes (subfunctionalization)

Homologies Gene duplication a Hemoglobin b Hemoglobin Speciation Mouse a Hb Rat a Hb Paralogs Mouse b Hb Orthologs Rat b Hb

Initial Population

Mistakes are Made

Elimination

Polymorphism

Fixation
 1 gene 2 alleles (variations), A")
Selection Differences in fitness (capacity for fertile offspring) 1 gene 2 alleles (variations), A and B 3 genotypes (diploid organism): AA, AB, BB Genotype Fitness AA AB BB ωAA = 1 (wild type) ωAB = 1 + SAB ωBB = 1 + SBB S > 0 advantageous S < 0 unfavorable S ~ 0 neutral
 =")
Evolution of Gene Frequencies q = frequency of B p = (1 -q) = frequency of A , , population: differential equation for p, q q(next generation) = q(this generation) + pq[ps. AB + q(s. BB-s. AB)] p 2 + 2 pq(s. AB+1) + q 2(s. BB+1)
 Genotype AA AB")
Frequency of B Fixation of an Advantageous Recessive Allele (s=0. 01) Genotype AA AB BB Fitness Value 1. 0 (recessive) 1. 01 Generation

Frequency of B Equilibration of an Overdominant Allele Genotype AA AB BB Generation Fitness Value 1. 02 1. 01

Probability of fixation = 1 -e-2 s 1 -e-2 Ns 1 N = 10 10 -02 N = 100 Fixation probability 10 -04 10 -06 = 2 s (large, positive S, large N) N = 1000 = 1/(2 N) when |s| < 1/(2 N) 10 -08 10 -10 N = 10, 000 10 -12 10 -14 -0. 01 0 0. 01 Selective advantage (s) 0. 02

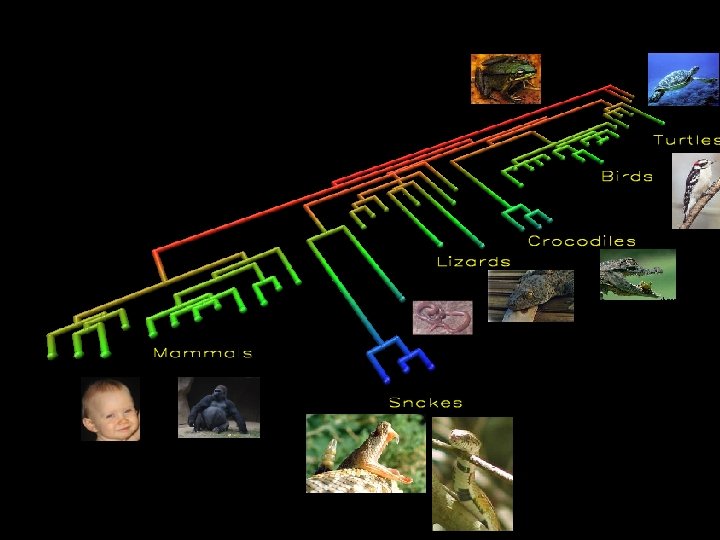
Real phylogenetic trees

The Rate of Evolution Depends on Constraints Human vs. Rodent Comparison Highest substitution rates pseudogenes introns 3’ flanking (not transcribed to mature m. RNA) 4 -fold degenerate sites Intermediate substitution rates 5’ flanking (contains promoter) 3’, 5’ untranslated (transcribed to m. RNA) 2 -fold degenerate sites Lowest substitution rates Nondegenerate sites
")
Selection of Species for DNA comparisons Human versus Chimpanzee Mouse Opossum Pufferfish Size (Gbp) 3. 0 2. 5 4. 2 0. 4 Time since divergence ~5 MYA ~ 65 MYA Sequence conservation (in coding regions) >99% ~80% Aids identification of… Recently changed sequences and genomic rearrangements ~150 MYA ~450 MYA ~70 -75% ~65% Both coding Both Primarily and non- coding and coding non-coding sequences

UCSC Genome Browser 39

Comparative analysis of multi-species sequences from targeted genomic regions Nature, 2003 40

Comparative Genomics in the CFTR Region Near CFTR 1. 8 Mb of human Ch 7, Sequenced for 12 ssp. How does a region change over evolutionary time? How much does it change? What types of changes are more/less common? Do some lineages have more of certain changes than others? How much comparative genomic data do we need? ? ?

Sequence Conservation 42

Looking backward from the human genome How much is still there after 450 my (Fugu) 43

Transposable Elements Gone Wild!

Transposable Elements Gone Wild! 45

Transposable Elements Gone Wild! 46

Transposable Elements Gone Wild! 47

Transposable Elements Gone Wild! Bov. B CR 1 48

Nucleotide Changes Big insertions/deletions are more common than nucleotide changes! In primates, large indels are the principal mechanism accounting for observed sequence differences 49

Identifying Functionally Important Regions How many comparative genomes do we need? Can’t we just use the mouse? Using 12 species, 561 Multi-Species Conserved Sequences (MCSs) were found False Pos. True Pos. False Neg. How can be found using just the Mouse genome (rather than all 12)

Multi-Species Conserved Sequences 950 of the 1, 194 MCSs are neither exonic nor lie less than 1 -kb upstream of transcribed sequence. Meaning they are otherwise hard to predict (Evolutionary Distance) Strong argument for comparative genomics: Need many species, and distant species – like cat, dog, fish - to ID conserved possibly-functional regions in humans! 51

Interpreting Evolutionary Changes Requires a Model …IGTLS… …IGRLS. . . In evolution: what is the rate R(T R) at which Ts become Rs? e. g. 0. 00005 / my 20 x 20 Substitution Matrix
- Slides: 52