EvidenceBased Policing What We Know How We Know

Evidence-Based Policing: What We Know, How We Know It SIPR Annual Lecture Scottish Police College 1 st October, 2009 Lawrence Sherman University of Cambridge

Fire

Suicide

Looking Backward Predictable? Preventable? • Risk Factors • Guideline Threshold • Odds per million • Policy for Action • Yes/No or Uncertainty? • Known Effect of Action?

Who To Blame? Fire Suicide • Me? • Simmons Family • Heather? • Leicestershire Police • 1992 Electrician? • CC Matt Baggott

The Shame of Blame • Blame assumes certainty: --prediction --prevention • Blame narrows research question: --one case --not 99. 99999% of cases --whodunit, not why it happened --not HOW to prevent such harm in future --not how to analyze SYSTEMS for improvement (learning) • All that blame prevents is fixing the problem itself

Looking Forward: Success Stories • Airplane Crashes down • Auto accident deaths down • Fire Deaths down • Making homes fireproof ? Evidence, Not Blame

What Kind of Evidence? • Not This Kind • But This Kind
 http: //www. policefoundation. org/pdf/Sherman. pdf")
Evidence-Based Policing (1998) http: //www. policefoundation. org/pdf/Sherman. pdf

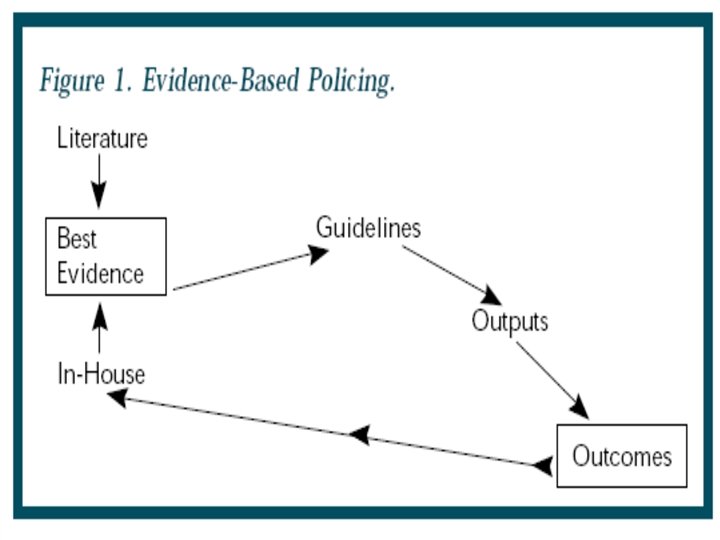
What Is Evidence-Based Policing? A decision-making process that uses reliable, unbiased quantitative evidence on prediction and prevention as a primary criterion for 1. 2. 3. 4. 5. 6. 7. Setting goals Setting priorities Making policies (patterns) Making decisions (cases) Managing compliance Assessing results Improving policies

EBP: A DRIVER Process Police using Evidence “dashboard”-- to • steer policy, • guide decisions turn-by-turn, sometimes U-turns!

DRIVER Process • • • Diagnosis—local evidence on the problem Response—reviews of published evidence Implementation-- local evidence Value-added—actual versus predicted Evaluation—Is this the best we can do? Revision—start all over again

Sherman: 1998

Evidence-Based Medicine: 1992 • Sir Iain Chalmers • Founder, Cochrane Collaboration-NHS • Not just a preference • Human Rights Issue ------------------“Policy makers and practitioners who intervene in the lives of other people not infrequently do more harm than good. ”

Hall of Shame: Dr. Benjamin Spock, Pediatrician

How To Kill Babies: use untested theory, not facts

Theory-Based Practice

David Hume’s Response Scottish Enlightenment: Insight from Edinburgh be more skeptical about what you think you know, and how you think you know it.

Testing the Theory: Back to Sleep

Inferring Cause From Trend? • Post Hoc Ergo Propter Hoc? • After this, then because of this?

Did Program Cause Crime Drop?

Or would it have dropped anyway? • • “Natural” Trend “History” Other factors “Spurious” explanations All ruled out by randomized controlled trials (RCTs) or other more rigourous tests

Randomized Controlled Trial RCT: COMPARISON or NET difference

Randomized Controlled Trials • British Invention • 1948 TB Cure test Sir Austin Hill • 1 million medical RCTs since then • “Gold Standard” for what works • Other research designs biased


Three Examples 1. Murder 2. Hot Spots 3. Domestic Common Assault

MAPPAs • Multi-Agency Prevention Partnership Agreements • Clinical Prediction: How Accurate? False negatives? • Statistical forecasting: more accurate • Prevention: How effective?

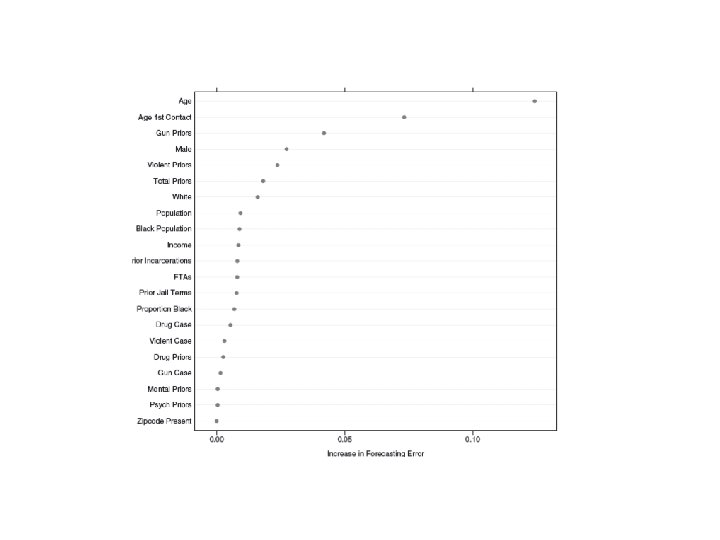
Forecasting Murder • JOURNAL OF THE ROYAL STATISTICAL SOCIETY • Berk, Sherman, et al, 2009 • Philadelphia Probation Cases • 300 -400 murders per year • 1. 5 million population • Rate = 14 X Scotland’s
")
Risk of Murder by Age at Time of Crime (Phila)
 Risk of Future Murder By Age of First Adult Disposition")
Berk (2006) Risk of Future Murder By Age of First Adult Disposition

Actually Happens Predicted to Happen 1. True Positive Predicted NOT To Happen 3. False Negative Actually does NOT Happen 2. False Positive 4. True Negative
 Neither High nor Low Risk (38%) Low Risk (60%)")
High Risk (2%) Neither High nor Low Risk (38%) Low Risk (60%)

High Risk 2% vs. Bottom 60% Two Years From Forecast Date Charges for Any Offence 8 X more Charges Serious Offence 10 X more Charges Murder or Attempt 75 X more

Average Number of Charges for ANY Offense Within Two Years of Probation Start High Neither Low

Average Number of Charges for SERIOUS Crimes Within Two Years of Probation Start High Neither Low

Average Charges for MURDER or Attempted Murder Within Two Years of Probation Start High Neither Low

3 points 1. If we need extra resources for extreme risk, they could come from risk-based assignment policies 2. Low Intensity for low-risk cases frees up officers for high intensity with high-risk cases 3. Tradeoff is uncertain, imperfect, but optimal

MAPPA: Multi-Agency Prevention Partnership Agreements • • Clinical to Statistical Prediction False Positive--False Negative Ratio What Works? What Evidence?

Second Example: HOT SPOTS Managing the high concentration of crime and disorder in a small number of high-risk but very small micro-locations

Reprise: Why Predict? • Prediction is Key To Prevention • Efficiency focuses on high risk, not low • “Peak probability, ” not “valley” (average)
")
Peaks and Valleys of Crime (Distribution of Violent Offenses in Tokyo)
")
15 -Year Trajectory of Blocks (Seattle: Weisburd, et al, 2004)

Greater Manchester Police: Tactical Experiments and Strategic Testing Extending the US Hot Spots Patrol Experiments

Uniformed Police Patrol: Putting Police Where the Crime Is • 3% of street addresses • 50% or more of all crime at certain times • Yet no police agency directs 50% patrol to 3% of addresses • Deterrent theory of patrol says they should • Experimental evidence shows it works • Displacement hypothesis disproven so far • Sherman and Weisburd, 1995, Minneapolis
 • Minutes police Present")
Optimal Patrol Time Per Hot Spot: 10 -15 Minutes (Minneapolis) • Minutes police Present • Minutes to first crime after Police leave the Hot Spot
 Curve")
Effects on Crime and Disorder Maximized by 14 -15 Minute Stops: Koper (1995) Curve Effect On Crime And Disorder Length of Stop Source: Koper (1995)

Experimental Hot Spots Improved Relative to Control Hot Spots Change In Crime

Research Design: GMP • • • Identify 200 Hot Spots small enough so that one police car can be seen from anywhere in the hot spot Make each hot spot far enough from other hot spots so police cars in one cannot be seen in other hot spots Add a “displacement cushion” around each hot spot to see if crime moves around the corner Assign 100 hot spots to 2 hours daily of extra PC patrol Assign 100 hot spots to standard PC coverage (no directed patrols Compare before-after crime trends

Randomized Controlled Trial RCT: COMPARISON or NET difference

Treatment Measures • • Minutes of PC or PCSO presence in each hot spot as measured by ARLS (automatic radio locator system) Arrests made in each hot spot Qualitative observations in PC, PCSO, and control hot spots Other agencies invited

Outcome Measures • • • Incidents of public crime, anti-social behaviour and disorder as reported by telephone to police Crimes occurring in public for which written reports are taken by police Quality of police-community interactions in three treatment groups

• Diploma, MSt • Applied Criminology & Police Management • Senior Command Course • Chief Inspector to CC • Crime analysis: Analysts and Sworn
![Alfred North Whitehead, 1861 -1947 “Universities [help] create the future”](http://slidetodoc.com/presentation_image_h/af7504b4f7073ccbd6327ce07e37f975/image-54.jpg "Alfred North Whitehead, 1861 -1947 “Universities [help] create the future”")
Alfred North Whitehead, 1861 -1947 “Universities [help] create the future”

Graduates Lead on Evidence • Third Example: Domestic Common Assault • • • Marcus Beale, DCC, Staffordshire M. St. (Cantab) 2009 Dissertation: Arrest policy for DV Found a victim-consultation pattern Never been tested • Then proposed RCT of VC versus Flat Arrest

First Domestic Violence Arrest Experiment: 1980 -84 • Minneapolis Police • Controlled Test • Arrest, mediation, separation • Arrest reduced repeat offending by 50%

Theory-Research Spiral

Sherman and Berk, ASR, 1984 Random Assignment of Arrest: Minneapolis Domestic Violence Experiment 300 Cases, misdemeanor, Rx: • Arrest • Advise – leave on premises • Order offender out – 24 hours
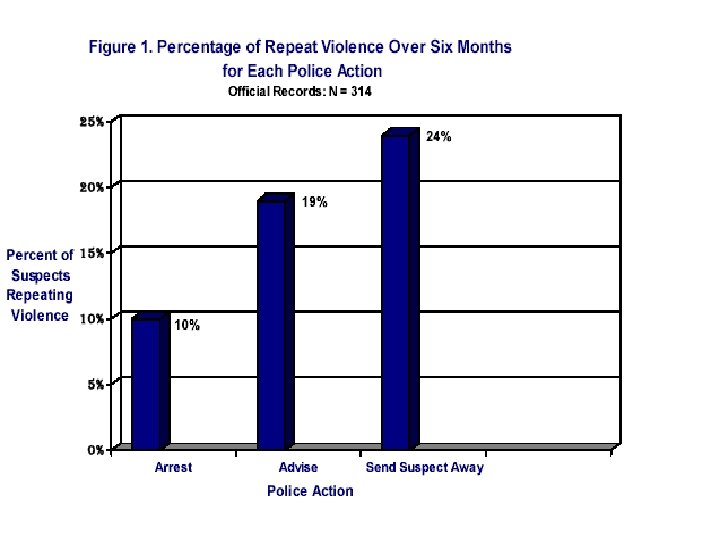

Science Replication • Can same results be found repeatedly? • Not original result for DV arrest • But subsequent results found in all 3 tests

Arrest Effects Depend on Employment: 1. Arrests deter employed men 2. Arrests make unemployed men more violent 3. Arrests deter men in areas of low unemployment 4. Arrests increase violence by men in areas of high unemployment
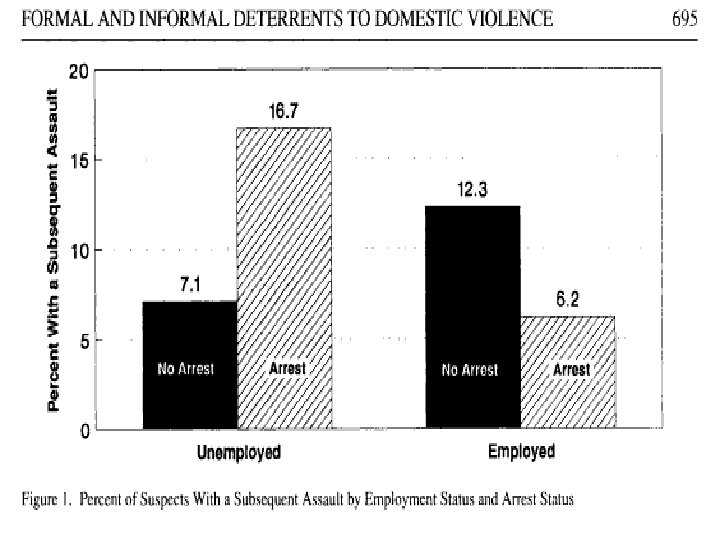

Milwaukee: Repeat domestic violence per 1, 000 suspects per year Subgroups Vary Employed Unemployed Arrested Warned Omaha: Repeat domestic violence per 1, 000 suspects per year Employed Unemployed Arrested Warned Miami: Percent of Offenders with repeat domestic violence Employed Unemployed Arrested Warned

Effect Also Varies By Neighbourhood • Arrest Increases Harm in Concentrated Poverty areas • Arrest Reduces Harm in Areas with medium to high social integration • Immigrant question uncertain—see Miami
: Policy Statement • The MPS")
English Policy on Common Assault DV • Met (2004): Policy Statement • The MPS will take a perpetrator-focused approach in domestic violence investigations. Where a power of arrest without warrant exists and there are reasonable grounds to justify arrest, the perpetrator shall be arrested immediately, if available. Failure to do so may amount to a neglect of duty and the reasons for not doing so must be clearly documented.
 Sometimes, presumptive arrest may cause more")
But One Thing We Know (From Randomized Trials) Sometimes, presumptive arrest may cause more violence than if no arrest—but that doing nothing is unacceptable.

Therefore, What’s Next? • Staffordshire Domestic Violence Experiment • Or a REx. Net: Randomized Experiment Network • Multiple sites • Same protocol: Random Assignment of Police Decision to Team of Volunteer Officers

Research Question How does mandatory arrest for domestic violence compare to “victim consultation? ” Definition: Discuss all options with victim, and help victim advise police on what might work best to stop the violence in short and long run, including arrest, and police then taking that advice.

The WISDOM Experiment Women’s Invitation to Support Domestic Offender Management

1. Hypothesis There will be less harm in the aftermath of a police response to domestic violence against women that is supported by a consultation with the victim than in the aftermath of presumptive arrest without victim consultation.

Rationale 1. Offender responses to arrest vary 2. Police have little knowledge of offender 3. Women victims have knowledge of a. offender’s behaviour patterns b. offender’s informal social controls 4. By suggesting to police other options besides arrest, victims may support more effective responses for reducing harm.

Specific Hypotheses List all variations of treatment delivery to be tested: 1. When suspect is present, victimsupported action will be followed by less harm than presumptive arrest 2. When suspect is absent, victimsupported action will be followed by less harm than an ongoing search for suspect

Agencies Participating • • • Staffordshire GMP Possibly others UK Abroad

Rex-NET • • Simultaneous Replication Detect cross-agency differences, or not Basis for national policy Sensitive to case-by-case differences Evidence from systematic reviews Some funded by NPIA Over 20 now posted at www. campbellcollaboration. org

7 RCT Tests of A Drug on Infant Mortality

From Joanna Shapland, et al, 2008, p. 27 Effects of Police-Led Restorative Justice on 2 -Year Re-Conviction in England
 high-risk is predictable • All predictions have")
What We Know • Some (not all) high-risk is predictable • All predictions have errors • Some policies do get better results, on average, when tested

How We Know It • Going Beyond Our David Hume, Skeptic Own Experience • Rules for Testing • Large N of cases • Same results seen by all • Not personal opinions • Systematic Observations (Hume)

Thank You SIPR Annual Lecture Scottish Police College 1 st October, 2009 Lawrence Sherman University of Cambridge
- Slides: 80