
Everything you wanted to know about your Hadoop

Everything you wanted to know about your Hadoop jobs William MONTAZ Xavier NOELLE

Who we are 2 William MONTAZ Xavier NOELLE SRE Lake
1 What we're trying to solve 3 2 Introducing Garmadon 3 4 Use case #1 Use case #2 Job troubleshooting Data lineage

What we're trying to solve
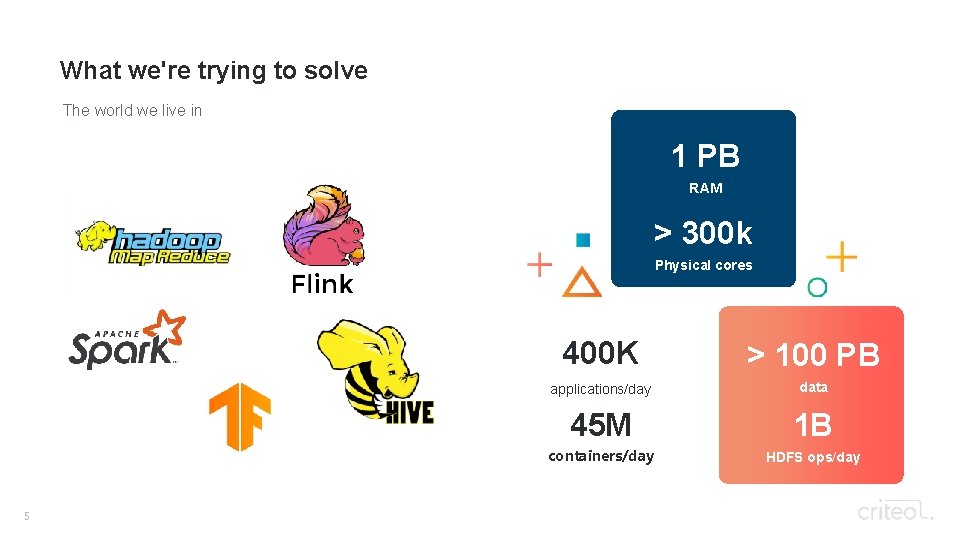
What we're trying to solve The world we live in 1 PB RAM > 300 k Physical cores 5 400 K > 100 PB applications/day data 45 M 1 B containers/day HDFS ops/day
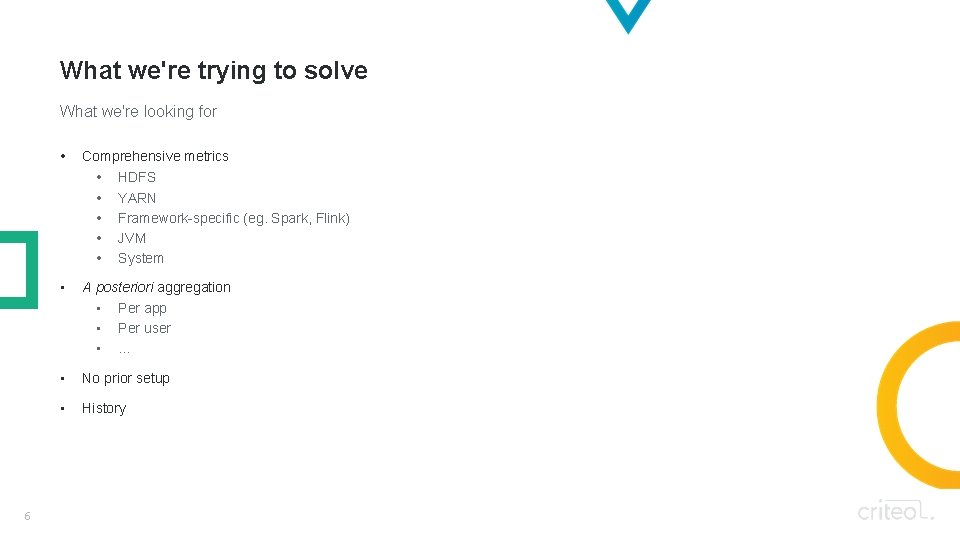
What we're trying to solve What we're looking for • Comprehensive metrics • • • A posteriori aggregation • • • 6 HDFS YARN Framework-specific (eg. Spark, Flink) JVM System Per app Per user … • No prior setup • History
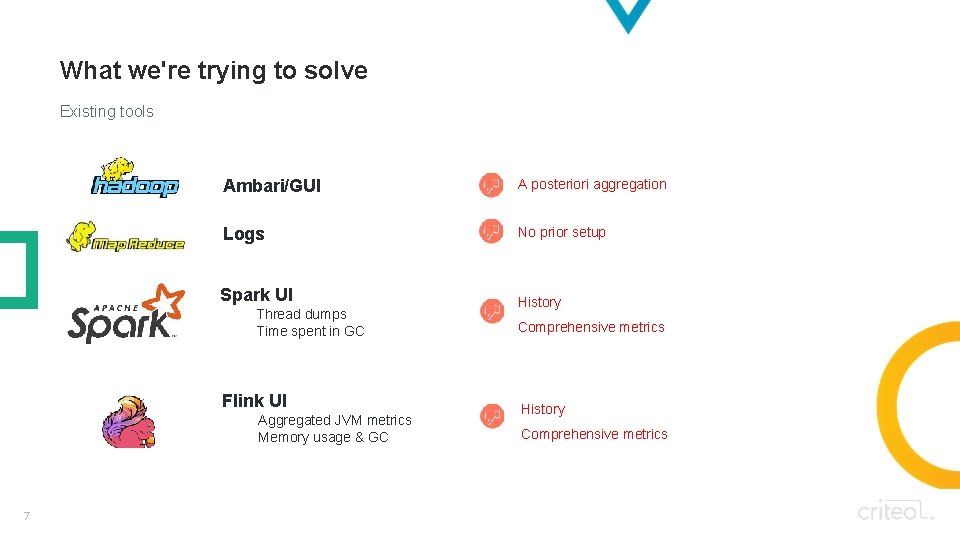
What we're trying to solve Existing tools Ambari/GUI A posteriori aggregation Logs No prior setup Spark UI History Thread dumps Time spent in GC Flink UI Aggregated JVM metrics Memory usage & GC 7 Comprehensive metrics History Comprehensive metrics
Introducing Garmadon
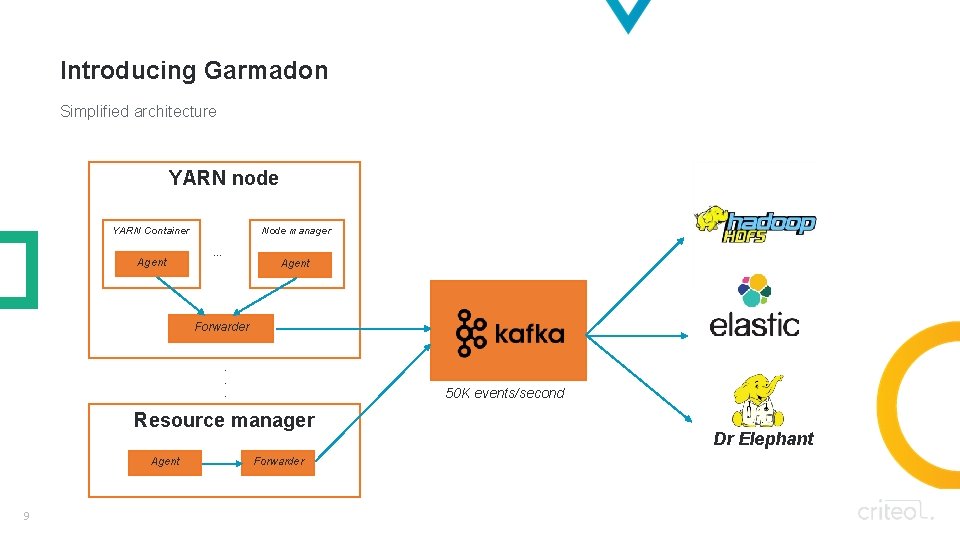
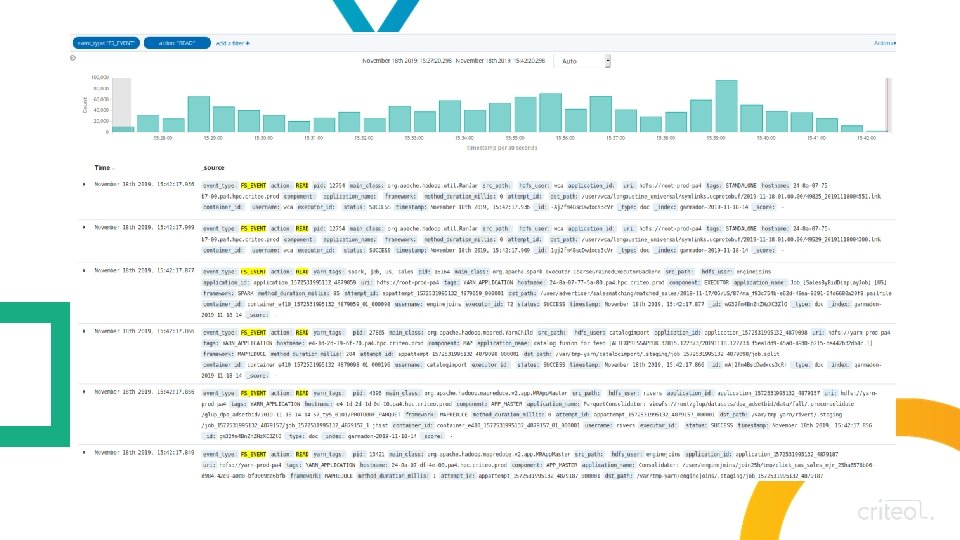
Introducing Garmadon Simplified architecture YARN node Node manager YARN Container . . . Agent Forwarder. . . 50 K events/second Resource manager Agent 9 Forwarder Dr Elephant
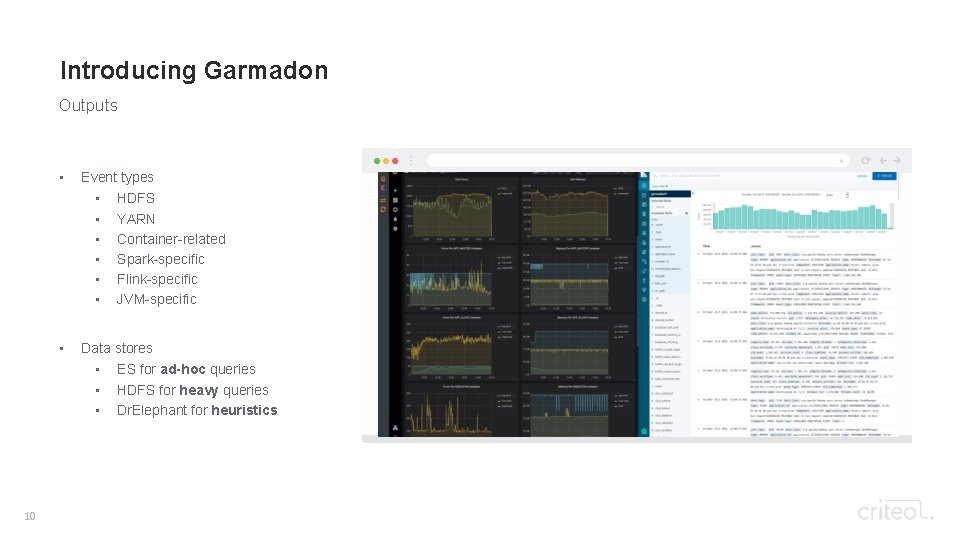
Introducing Garmadon Outputs • Event types • • Data stores • • • 10 HDFS YARN Container-related Spark-specific Flink-specific JVM-specific ES for ad-hoc queries HDFS for heavy queries Dr. Elephant for heuristics
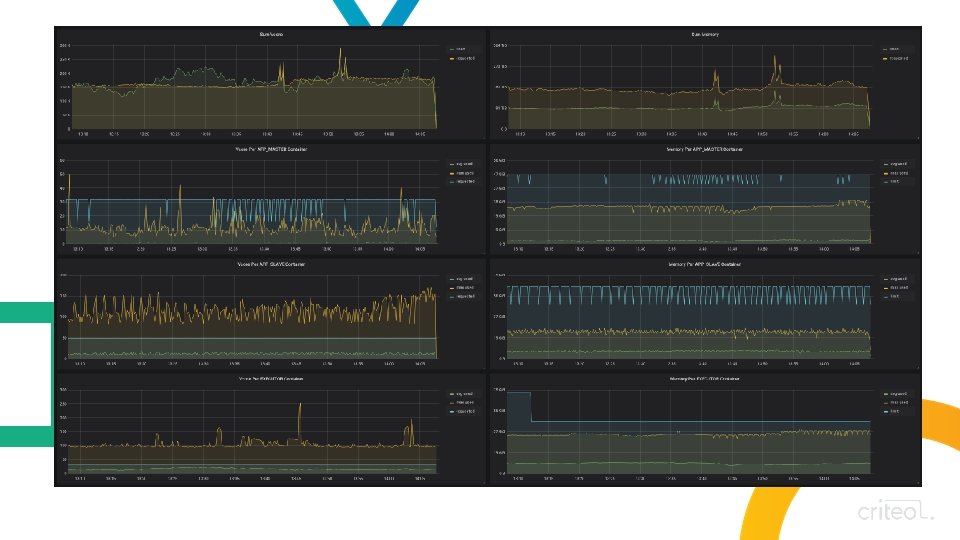
Introducing Garmadon Does it fit the bill? Comprehensive metrics • Cf previous slide A posteriori aggregation • • Metrics are sent with the finest granularity available Aggregation done by the reader No prior setup • • Agent injected through command line All jobs are in the scope History • • 13 Depends on the storage In our case, long-term (months) storage in HDFS
Use case #1 Job troubleshooting
Use case #1 – Job troubleshooting The context Spark application 15 • 2000 executors (20 GB/24 vcores per executor) • 3 -7 h runtime
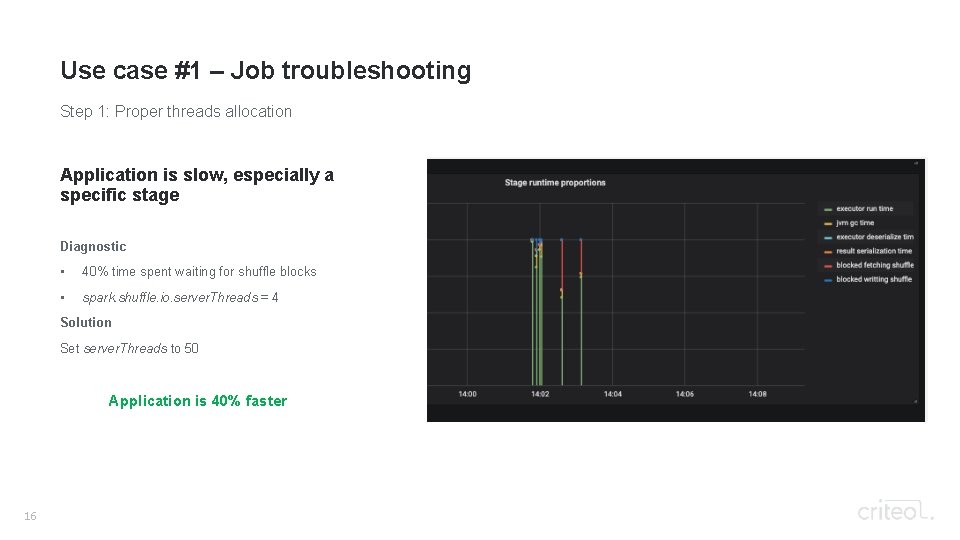
Use case #1 – Job troubleshooting Step 1: Proper threads allocation Application is slow, especially a specific stage Diagnostic • 40% time spent waiting for shuffle blocks • spark. shuffle. io. server. Threads = 4 Solution Set server. Threads to 50 Application is 40% faster 16
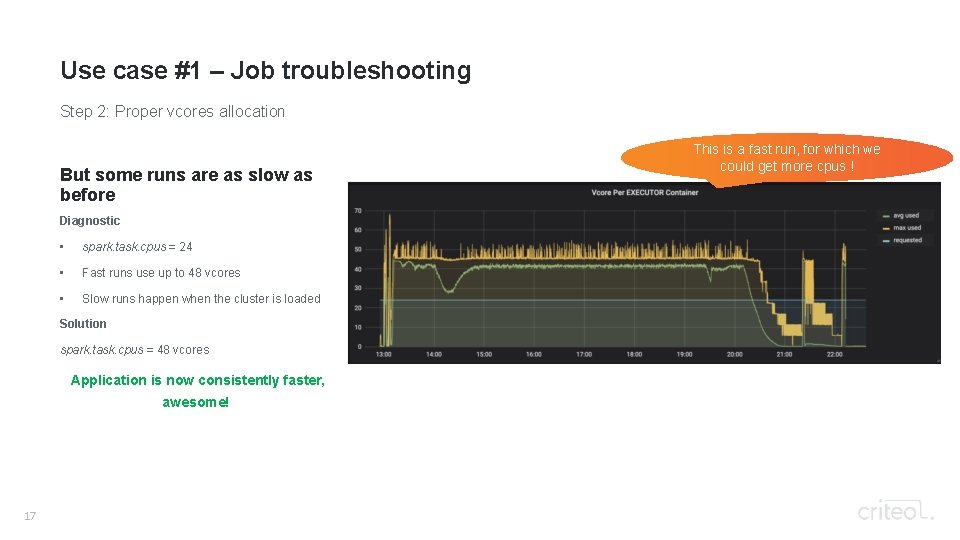
Use case #1 – Job troubleshooting Step 2: Proper vcores allocation But some runs are as slow as before Diagnostic • spark. task. cpus = 24 • Fast runs use up to 48 vcores • Slow runs happen when the cluster is loaded Solution spark. task. cpus = 48 vcores Application is now consistently faster, awesome! 17 This is a fast run, for which we could get more cpus !
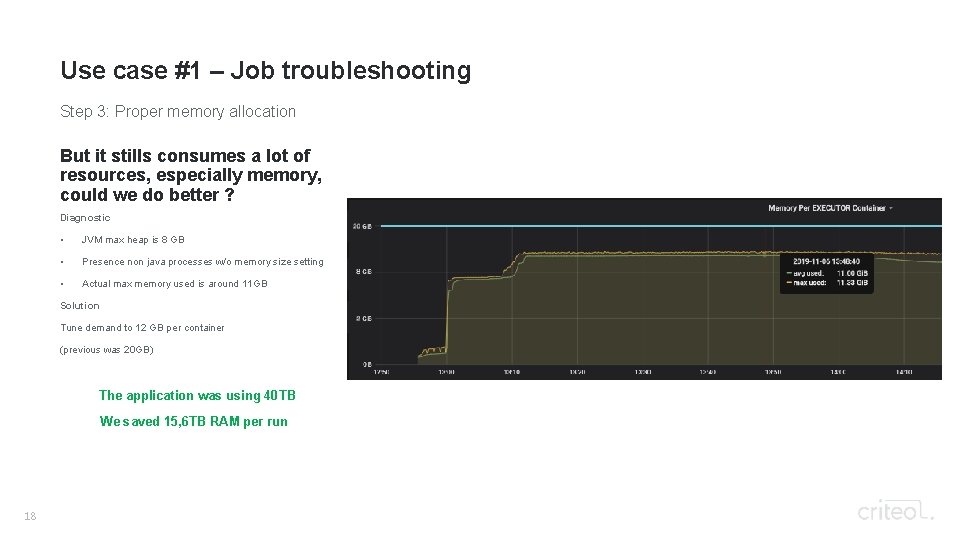
Use case #1 – Job troubleshooting Step 3: Proper memory allocation But it stills consumes a lot of resources, especially memory, could we do better ? Diagnostic • JVM max heap is 8 GB • Presence non java processes w/o memory size setting • Actual max memory used is around 11 GB Solution Tune demand to 12 GB per container (previous was 20 GB) The application was using 40 TB We saved 15, 6 TB RAM per run 18
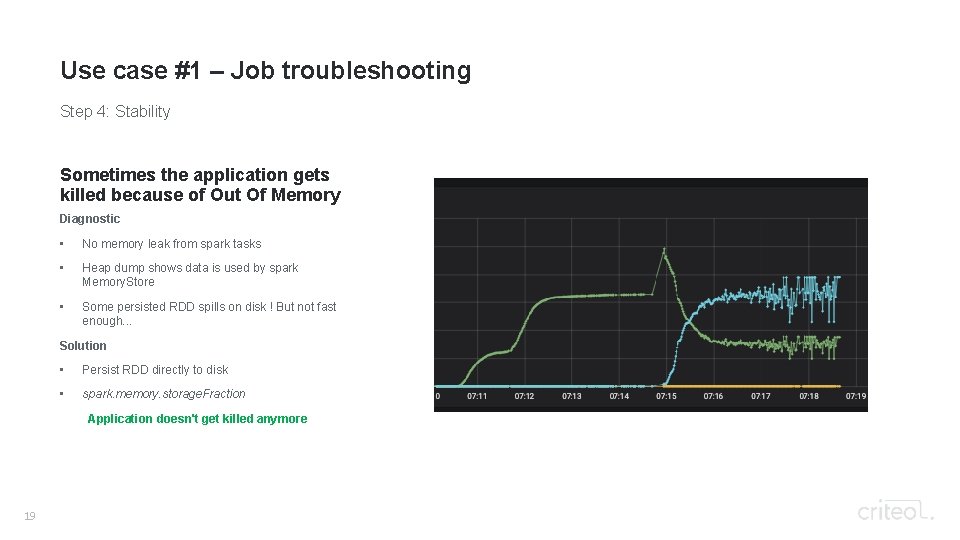
Use case #1 – Job troubleshooting Step 4: Stability Sometimes the application gets killed because of Out Of Memory Diagnostic • No memory leak from spark tasks • Heap dump shows data is used by spark Memory. Store • Some persisted RDD spills on disk ! But not fast enough. . . Solution • Persist RDD directly to disk • spark. memory. storage. Fraction Application doesn't get killed anymore 19

Use case #2 Data lineage
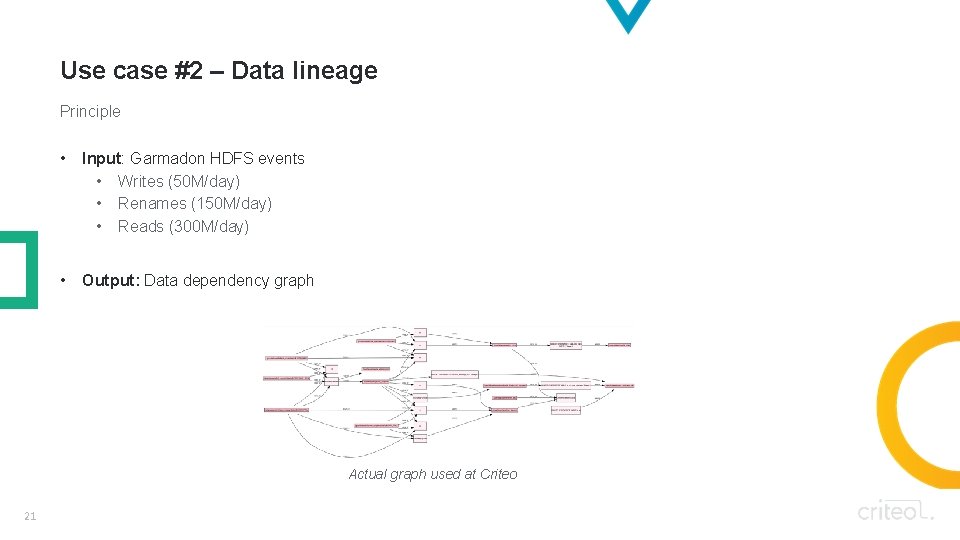
Use case #2 – Data lineage Principle • Input: Garmadon HDFS events • Writes (50 M/day) • Renames (150 M/day) • Reads (300 M/day) • Output: Data dependency graph Actual graph used at Criteo 21
Use case #2 – Data lineage How we're using it • Identification of & communication with data clients • Cluster migration • Backup strategy • SLA 22

Wrap-up
Wrap-up Key takeaways • Garmadon is • Granular • Historized • Transparent for users • Fit for big workloads • Use cases include • Jobs troubleshooting • Data lineage & strategy 24
Thank you! https: //github. com/criteo/garmadon
- Slides: 25