Everyday inductive leaps Making predictions and detecting coincidences


 p(t|ttotal) p(ttotal) posterior probability likelihood prior")
 p(t|ttotal) p(ttotal) posterior probability likelihood prior p(ttotal|t) 1/ttotal p(ttotal) assume random")
 are appropriate in different domains")


 Proportion of judgments below predicted value Probability matching ttotal Quantile of Bayesian posterior")
 Proportion of judgments below predicted value Probability matching ttotal Average over all prediction")


")
")
")

 75 years 76 years")


")
")


 People")

 r = 0.")


")
")
")
 by thinking about")


")


")

")
 by constructing Markov")
")
")
")
 A(x(t), x(t+1)) = 0. 5")
")
 A(x(t), x(t+1)) = 1")


")


- Slides: 98
Everyday inductive leaps Making predictions and detecting coincidences Tom Griffiths Department of Psychology Program in Cognitive Science University of California, Berkeley (joint work with Josh Tenenbaum, MIT)
Inductive problems • Inferring structure from data • Perception – e. g. structure of 3 D world from 2 D visual data hypotheses cube shaded hexagon
Inductive problems • Inferring structure from data • Perception – e. g. structure of 3 D world from 2 D visual data • Cognition – e. g. whether a process is random data hypotheses HHHHH fair coin two heads
Perception is optimal
Cognition is not
Everyday inductive leaps • Inferences we make effortlessly every day – making predictions – detecting coincidences – evaluating randomness – learning causal relationships – identifying categories – picking out regularities in language • A chance to study induction in microcosm, and compare cognition to optimal solutions
Two everyday inductive leaps Predicting the future Detecting coincidences
Two everyday inductive leaps Predicting the future Detecting coincidences
Predicting the future How often is Google News updated? t = time since last update ttotal = time between updates What should we guess for ttotal given t?
Reverend Thomas Bayes
Bayes’ theorem Posterior probability h: hypothesis d: data Likelihood Prior probability Sum over space of hypotheses
Bayes’ theorem h: hypothesis d: data
Bayesian inference p(ttotal|t) p(t|ttotal) p(ttotal) posterior probability likelihood prior
Bayesian inference p(ttotal|t) p(t|ttotal) p(ttotal) posterior probability likelihood prior p(ttotal|t) 1/ttotal p(ttotal) assume random sample (0 < ttotal)
The effects of priors Different kinds of priors p(ttotal) are appropriate in different domains e. g. wealth e. g. height
The effects of priors
Evaluating human predictions • Different domains with different priors: – a movie has made $60 million [power-law] – your friend quotes from line 17 of a poem [power-law] – you meet a 78 year old man [Gaussian] – a movie has been running for 55 minutes [Gaussian] – a U. S. congressman has served 11 years [Erlang] • Prior distributions derived from actual data • Use 5 values of t for each • People predict ttotal
people Gott’s rule empirical prior parametric prior
p(ttotal|tpast) Proportion of judgments below predicted value Probability matching ttotal Quantile of Bayesian posterior distribution
p(ttotal|tpast) Proportion of judgments below predicted value Probability matching ttotal Average over all prediction tasks: • • • Quantile of Bayesian posterior distribution movie run times movie grosses poem lengths life spans terms in congress cake baking times
Predicting the future • People produce accurate predictions for the duration and extent of everyday events • Strong prior knowledge – form of the prior (power-law or exponential) – distribution given that form (parameters) • Contrast with “base rate neglect” (Kahneman & Tversky, 1973)
Two everyday inductive leaps Predicting the future Detecting coincidences
November 12, 2001: New Jersey lottery results were 5 -8 -7, the same day that American Airlines flight 587 crashed
"It could be that, collectively, the people in New York caused those lottery numbers to come up 911, " says Henry Reed. A psychologist who specializes in intuition, he teaches seminars at the Edgar Cayce Association for Research and Enlightenment in Virginia Beach, VA. "If enough people all are thinking the same thing, at the same time, they can cause events to happen, " he says. "It's called psychokinesis. "
The bombing of London (Gilovich, 1991)
The bombing of London (Gilovich, 1991)
John Snow and cholera (Snow, 1855)
(Halley, 1752) 75 years 76 years
The paradox of coincidences How can coincidences simultaneously lead us to irrational conclusions and significant discoveries?
A common definition: Coincidences are unlikely events “an event which seems so unlikely that it is worth telling a story about” “we sense that it is too unlikely to have been the result of luck or mere chance”
Coincidences are not just unlikely. . . HHHHH vs. HHTHTHTTHT
Bayesian causal induction Hypotheses: Priors: cause chance a novel causal relationship exists no such relationship exists p(cause) p(chance) Data: Likelihoods: d p(d|cause) p(d|chance)
Bayesian causal induction Prior odds high low ? high cause low Likelihood ratio (evidence) chance ?
Bayesian causal induction Prior odds high low coincidence high cause low Likelihood ratio (evidence) chance ?
What makes a coincidence? A coincidence is an event that provides evidence for causal structure, but not enough evidence to make us believe that structure exists
What makes a coincidence? A coincidence is an event that provides evidence for causal structure, but not enough evidence to make us believe that structure exists likelihood ratio is high
What makes a coincidence? A coincidence is an event that provides evidence for causal structure, but not enough evidence to make us believe that structure exists posterior odds are middling likelihood ratio is high prior odds are low
HHHHH HHTHTHTTHT posterior odds are middling likelihood ratio is high prior odds are low
Bayesian causal induction Hypotheses: Priors: Data: Likelihoods: cause chance C C E E 1 - frequency of effect in presence of cause 0 < p(E) < 1 p(E) = 0. 5
coincidence HHHHH posterior odds are middling likelihood ratio is high prior odds are low HHTHTHTTHT chance posterior odds are low likelihood ratio is low prior odds are low
Empirical tests • Is this definition correct? – from coincidence to evidence • How do people assess complex coincidences? – the bombing of London – coincidences in date
Empirical tests • Is this definition correct? – from coincidence to evidence • How do people assess complex coincidences? – the bombing of London – coincidences in date
coincidence HHHHH posterior odds are middling prior odds are low likelihood ratio is high cause HHHHHHHHHH posterior odds are high likelihood ratio is very high prior odds are low
From coincidence to evidence coincidence evidence for a causal relation • Transition produced by – increase in likelihood ratio (e. g. , coin flipping) – increase in prior odds (e. g. , genetics vs. �ESP)
Testing the definition • Provide participants with data from experiments • Manipulate: – cover story: genetics vs. ESP (prior) – data: number of heads/males (likelihood) – task: “coincidence or evidence? ” vs. “how likely? ” • Predictions: – coincidences affected by prior and likelihood – relationship between coincidence and posterior
Proportion “coincidence” 55 59 47 51 55 59 63 70 Number of heads/males 87 99 Posterior probability 47 51 63 70 r = -0. 98
Empirical tests • Is this definition correct? – from coincidence to evidence • How do people assess complex coincidences? – the bombing of London – coincidences in date
Complex coincidences • Many coincidences involve structure hidden in a sea of noise (e. g. , bombing of London) • How well do people detect such structure? • Strategy: examine correspondence between strength of coincidence and likelihood ratio
The bombing of London
Change in. . . Number Ratio Location Spread (uniform) People
Bayesian causal induction T X Priors: Data: Likelihoods: chance cause Hypotheses: X X T T T X X X 1 - bomb locations uniform + regularity uniform
Change in. . . People Bayes Number Ratio Location Spread (uniform) r = 0. 98
75 years 76 years
Coincidences in date May 14, July 8, August 21, December 25 vs. August 3, August 3
People
Bayesian causal induction chance cause Hypotheses: B B B B P P P P Priors: Data: birthdays of those present Likelihoods: 1 - uniform + regularity August uniform
People Bayes Regularities: Proximity in date Same day of month Same month
Coincidences • Provide evidence for causal structure, but not enough to make us believe that structure exists • Intimately related to causal induction – an opportunity to revise a theory – a window on the process of discovery • Guided by a well calibrated sense of when an event provides evidence of causal structure
The paradox of coincidences Status of current theory Consequence false significant discovery true false conclusion The utility of attending to coincidences depends upon how much you know already
Two everyday inductive leaps Predicting the future Detecting coincidences
Subjective randomness • View randomness as an inference about generating processes behind data • Analysis similar (but inverse) to coincidences – randomness is evidence against a regular generating process (Griffiths & Tenenbaum, 2003)
Other cases of causal induction A B (Griffiths, Baraff, & Tenenbaum, 2004)
Aspects of language acquisition (Goldwater, Griffiths, & Johnson, 2006)
Probability Categorization x (Sanborn, Griffiths, & Navarro, 2006)
Conclusions • We can learn about cognition (and not just perception) by thinking about optimal solutions to computational problems • We can study induction using the inferences that people make every day • Bayesian inference offers a way to understand these inductive inferences
Magic tricks are regularly used to identify infants’ ontological commitments Can we use a similar method with adults? (Wynn, 1992)
Ontological commitments (Keil, 1981)
What’s a better magic trick?
What’s a better magic trick? Applicable predicates milk water a brick a vase a rose a daffodil a dove a blackbird a man a girl • Participants rate the quality of 45 transformations, 10 appearances, and 10 disappearances – direction of transformation is randomized between subjects • A second group rates similarity • Objects are chosen to lie at different points in a hierarchy
a girl a man a blackbird a man a dove a blackbird a daffodil a blackbird a rose a dove a vase a dove a brick a daffodil water a daffodil a girl a rose a man a rose a blackbird a vase a dove a vase a daffodil a brick a rose a brick a vase water a brick water milk What’s a better magic trick?
a girl a man a blackbird a man a dove a blackbird a daffodil a blackbird a rose a dove a vase a dove a brick a daffodil water a daffodil a girl a rose a man a rose a blackbird a vase a dove a vase a daffodil a brick a rose a brick a vase water a brick water milk Ontological asymmetries
Analyzing asymmetry Applicable predicates milk water a brick a vase a rose a daffodil a dove a blackbird a man a girl • Build a regression model: – similarity – appearing object – disappearing object – contains people – direction in hierarchy (-1, 0, 1) • All factors significant • Explains 90. 9% of variance
Summary: magic tricks • Certain factors reliably influence the estimated quality of a magic trick • Magic tricks might be a way to investigate our ontological assumptions – inviolable laws that are otherwise hard to assess • A Bayesian theory of magic tricks? – strong evidence for a novel causal force – causal force is given low prior probability
A reformulation: unlikely kinds • Coincidences are events of an unlikely kind – e. g. a sequence with that number of heads • Deals with the obvious problem. . . p(10 heads) < p(5 heads, 5 tails)
Problems with unlikely kinds • Defining kinds August 3, August 3 January 12, March 22, July 19, October 1, December 8
Problems with unlikely kinds • Defining kinds • Counterexamples HHHH > HHTT P(4 heads) < P(2 heads, 2 tails) HHHH > HHHHTHTTHHHTHTTHHH P(4 heads) > P(15 heads, 8 tails)
Sampling from categories Frog distribution P(x|c)
Markov chain Monte Carlo • Sample from a target distribution P(x) by constructing Markov chain for which P(x) is the stationary distribution • Markov chain converges to its stationary distribution, providing outcomes that can be used similarly to samples
Metropolis-Hastings algorithm p(x)
Metropolis-Hastings algorithm p(x)
Metropolis-Hastings algorithm p(x)
Metropolis-Hastings algorithm p(x) A(x(t), x(t+1)) = 0. 5
Metropolis-Hastings algorithm p(x)
Metropolis-Hastings algorithm p(x) A(x(t), x(t+1)) = 1
A task Ask subjects which of two alternatives comes from a target category Which animal is a frog?
Collecting the samples Which is the frog? Trial 1 Trial 2 Trial 3
Sampling from natural categories Examined distributions for four natural categories: giraffes, horses, cats, and dogs Presented stimuli with nine-parameter stick figures (Olman & Kersten, 2004)
Choice task
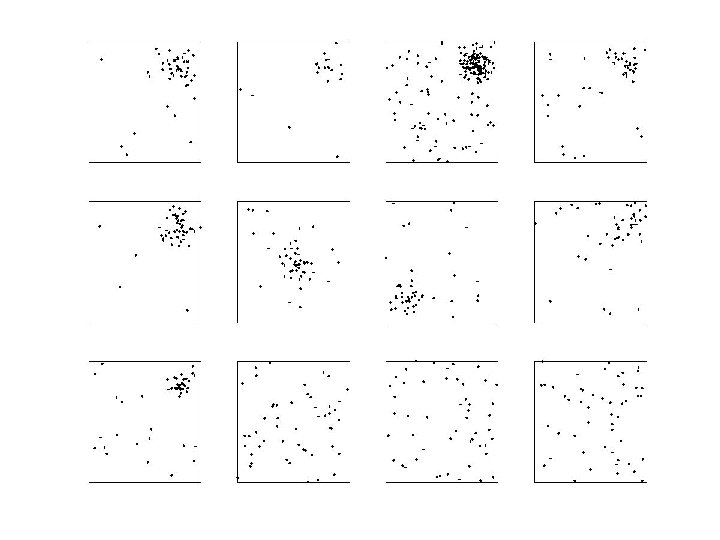
Samples from Subject 3 (projected onto a plane)
Mean animals by subject S 1 giraffe horse cat dog S 2 S 3 S 4 S 5 S 6 S 7 S 8
Markov chain Monte Carlo with people • Rational models can guide the design of psychological experiments • Markov chain Monte Carlo (and other methods) can be used to sample from subjective probability distributions – category distributions – prior distributions