Evaluation of well tests using radial composite model


 ØFlowing")


- Slides: 9
Evaluation of well tests using radial composite model and Dietz shape factor Hana Baarová Technical University in Liberec, Czech Republic
1. Introduction • Purpose of well testing 2. Radial Homogeneous Flow Model • Assumptions • Log-log diagnostic plot • Semi log diagnostic plot • Methods to obtain permeability (k), transmissivity (kh) and total skin 3. Radial Composite Flow Model • Scheme and assumptions • Acidization, gas fingering, moving water front • Log-log diagnostic plot • Semi log diagnostic plot 4. Dietz Correction Shape Factor • Assumptions • Cartesian plot – irregular drainage area, position of the well • Improvement in deliverability calculation 5. Conclusions
1. Introduction - Well testing workflow ØPressure transient analysis data (isochronal pumping test) ØFlowing periods (drawdowns) non-Darcy skin analysis - true skin (S) and rate-dependent skin (Sd) Deliverability - LIT analysis to get AOF Log-log diagnostic plot Test overview MTD ETD Flow model LTD Boundary model www. goexpro. com ØTransient data (build-ups) Early time data (ETD) - wellbore storage coefficient Middle time data (MTD) – flow model to get permeability (k) and total skin (St) Late time data (LTD) – boundary model to estimate boundary condition Deliverability – semi theoretical derivation of absolute open flow potential (AOF)
2. Radial Homogeneous Flow Model ØCylindrical homogeneous reservoir with well situated in the middle www. fekete. com Semi log plot(Radial flow plot) of the last buildup Results For the layer: k, kh, pi For the well: s, Cd Slope of the straight line m Log-log plot of the last buildup Lower k Wellbore storage Decay of wellbore effect Radial homogeneous flow regime Test overview storage effect Heterogeneity? Zero slope line Last buidup
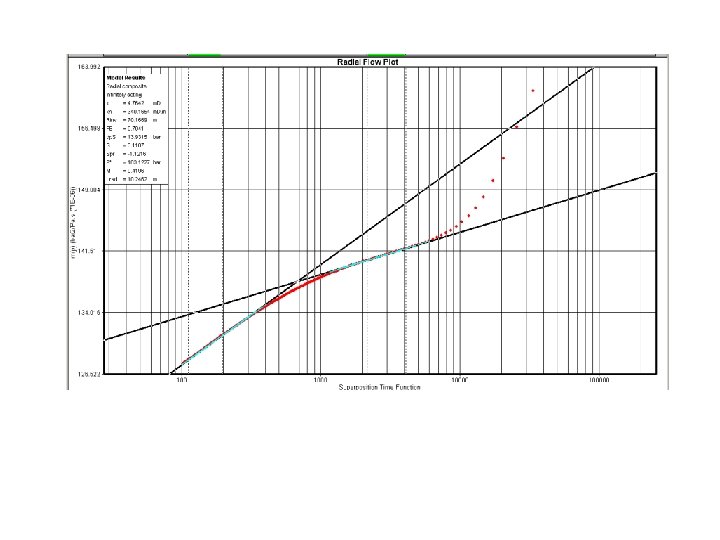
3. Radial Composite Flow Model Lrad ØInner and outer region Ø Due to acidization www. siam. org ØChange in gas saturation: gas fingering , moving water front ØSteam front, CO 2 miscible flooding front www. fekete. com Inner zone radial flow Outer zone radial flow Mobility ratio, Pseudoradial skin, Distance Lrad Decrease in transmissivity Short duration of WBS (Not a double slope) • Mobility Ratio • Storativity Ratio • Distance to the radial discontinuity
4. Dietz Correction Shape Factor CA ØLayer parameter, default value 31. 62 ØAccounts for the drainage area shape and the well position ØBetter calculation of AOF transient, closed system CA estimated from the Cartesian plot of the extended drawdown Default CA = 31. 62 AOF Trans 165 063 m/h 3 AOF Lit 154 998 m 3/h CA = 2. 3473 Improved AOF Trans 153 840 m 3/h
5. Conclusions Well showing such a change in transmissivity in log-log plot Ø Radial composite model helpful (M, Lrad, ω, k 2) ØAcidization ØGas fingering effect ØMoving water front AOF´s from transient flow and drawdown´s not coherent ØIrregular drainage area shape ØDietz shape factor for closed system Ø(low permeable wells only) Inner zone radial flow Outer zone radial flow