EVALUATION OF SYSTOLIC FUNCTION ECHOCARDIOGRAPHYANGIOGRAPHY DEEPAK NANDAN SYSTOLE


² - (LVESD)² = --------- X 100 (LVEDD)² If apical contractility")
 – Assumes symmetric contraction • Ejection fraction")


3 –")

")


 x Average velocity")


/p Vpm")


SV( 0. 0136) LVSP&LVDP=MEAN")
SV(0. 0136) � LVSW –good measure in the absence of vol or pressure")


- Slides: 68
EVALUATION OF SYSTOLIC FUNCTION ECHOCARDIOGRAPHY/ANGIOGRAPHY DEEPAK NANDAN
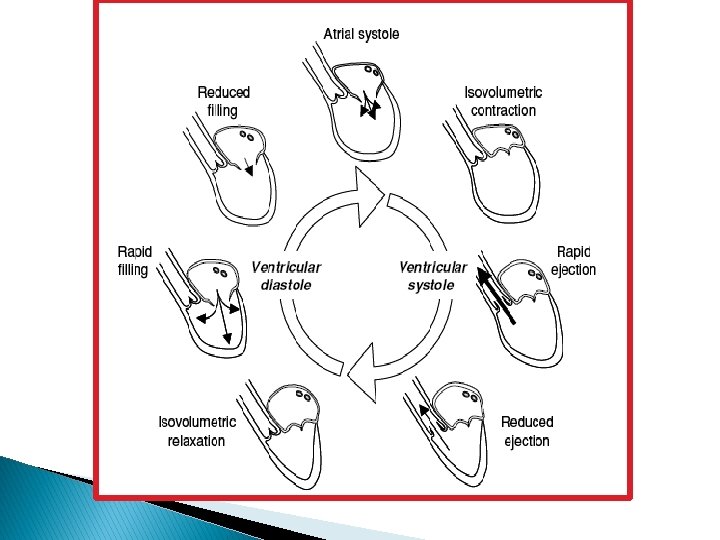
� “SYSTOLE”- CONTRACTION � “DIASTOLE”-TO SEND APART
� Systolic function is affected by preload afterload, contractility and heart rate. � Asynchronous systolic contraction also may affect systolic function
LV SYSTOLIC FUNCTION � Quantitative ◦ LV VOLUME echo ◦ LV MASS ◦ EJECTION INDICES STROKE VOLUME EJECTION FRACTIONAL SHORTENING VELOCITY OF CIRCUMFERENCIAL FIBRE SHORTENING
Quantify LV function -MODES � M-Mode � Modified Simpson’s Method � Single plane area-length method � Velocity of Circumferential Shortening � Mitral Annular Excursion � E-point to septal separation � Rate of rise of MR jet � Index of myocardial performance � Subjective assessment
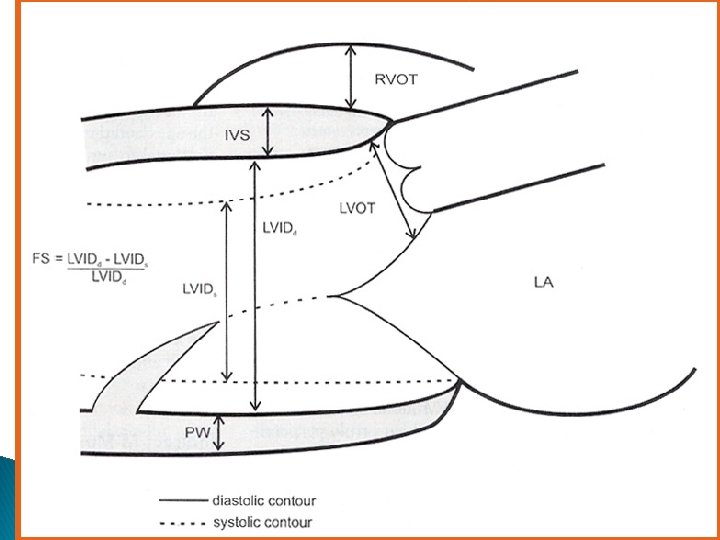
M-Mode Quantification � Use Parasternal Short-Axis or Long-Axis views to measure LVEDD and LVESD � May take several measurements at different levels and calculate average � Assumes that no significant regional wall motion abnormalities are present
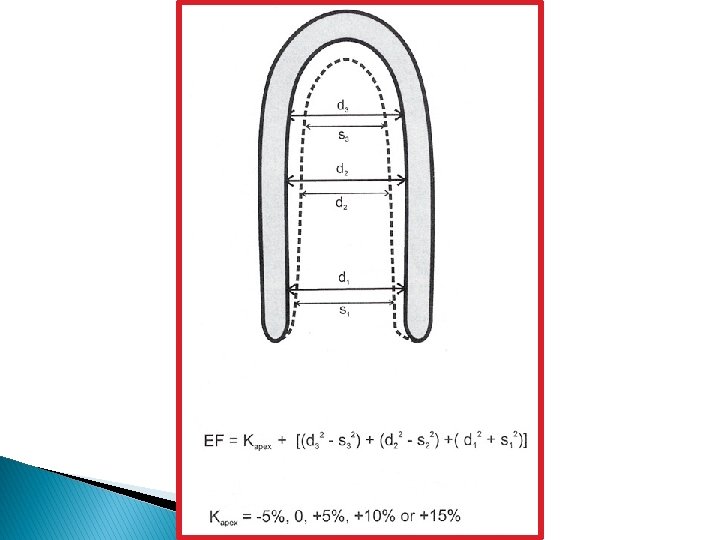
� Uncorrected LVEF (LVEDD)² - (LVESD)² = --------- X 100 (LVEDD)² If apical contractility is normal Corrected LVEF = Unc LVEF +(100 – Unc LVEF) X 15%) 5% hypokinetic, 0% akinetic, -5% dyskinetic, 10% aneurysm -
Global Myocardial Function • Fractional shortening (FS) – Assumes symmetric contraction • Ejection fraction (EF)
M-MODE-LINEAR MEASUREMENTS
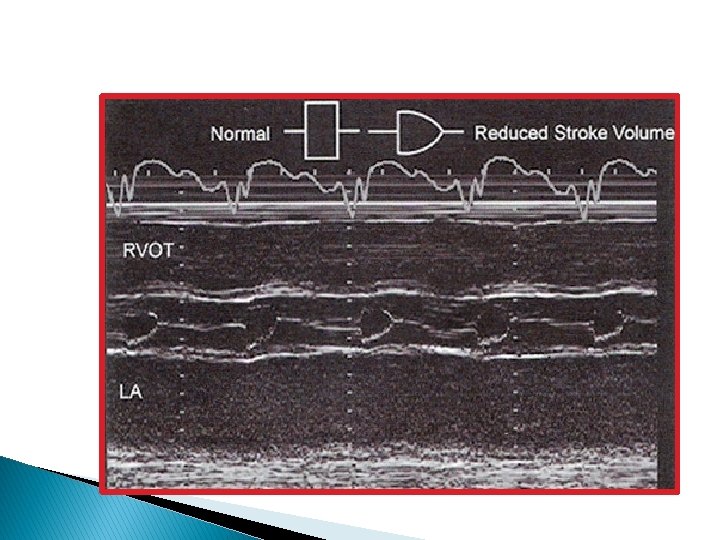
INDIRECT M-MODE MARKERS � EPSS � GRADUAL � MEAN CLOSURE OF AORTIC VALVE Vcf-rate of shortening of LV
EPSS NORMAL ≤ 6 mm EF<50% >7 mm EF≤ 35% ≥ 13 mm
Mitral Annular Excursion toward LV Apex � M-mode tracings in systole � The magnitude of systolic motion is proportional to the longitudinal shortening of the LV � Normal mitral annular systolic motion is 8 mm+ (average 12 +/- 2 on apical 4 or apical 2 views) � If motion is < 8 mm, the EF is likely < 50%
Velocity of Circumferential shortening � Vcf is the mean velocity of LV shortening through the minor axis � Vcf � ET = FS/ET is the time between LV isovolumetric contraction and isovolumetric relaxation � Measure by obtaining M-mode of AV opening to AV closure, aortic flow by doppler, or by an external pulse recording of carotid artery � NL values are > 1. 0 c/s � Slow Vcf may suggest diminished systolic function
2 -D MEASUREMENTS
Ejection Fraction • Quantitative - accuracy, reproducibility limited - assumes shape of LV cavity - best in symmetric ventricles
SIMPSONS RULE RULE OF DISC
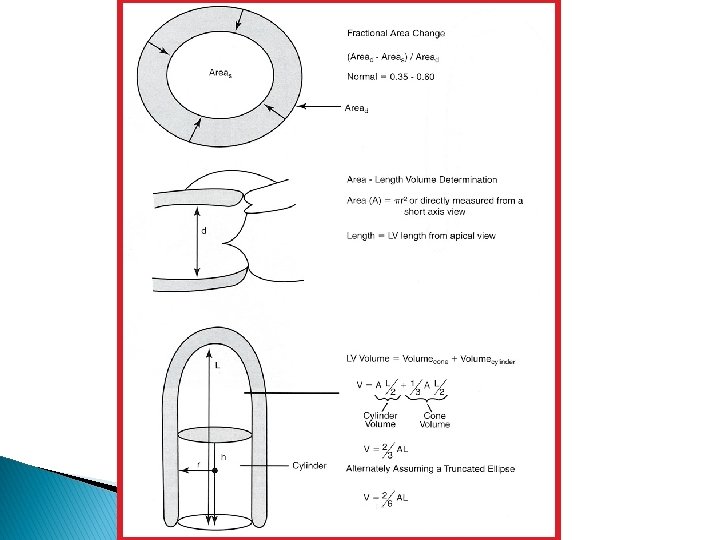
Simpson’s Rule – the biplane method of LV-ED LV-ES disks � Volume left ventricle LV-ED - manual tracings in systole and diastole - area divided into series of disks A 4 C - volume of each disc(πr 2 x h ) summed = ventricular volume A 2 C LV-ES
LEFT VENTRICULAR MASS
TEICHOLZ /CUBED FORMULA
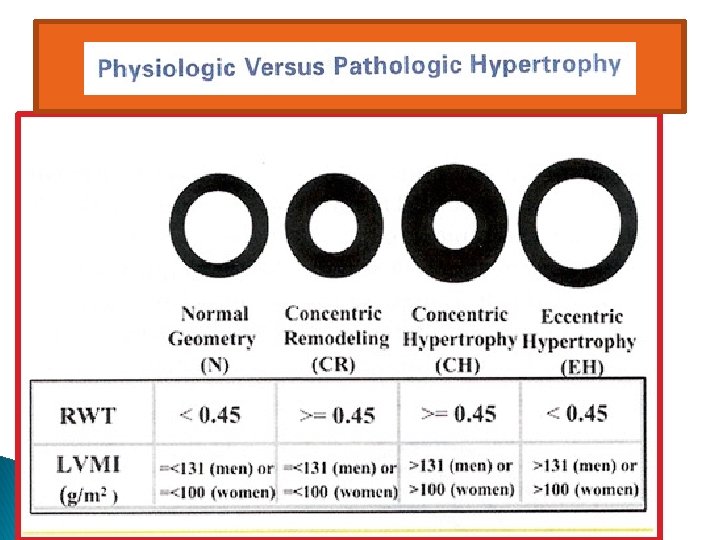
LV Mass Quantification � 2 D M-Mode method using parasternal short axis view or parasternal long axis view � Assumes that LV is ellipsoid (2: 1 long/short axis ratio) � Measurements made at end diastole � � ASE approved cube formula: LV mass (g) = 1. 04 [(LVID + PWT + IVST)3 - (LVID)3] X 0. 8 + 0. 6 LV mass index (g/m 2) = LV mass / BSA � Small errors in M-Mode cause large errors in mass values. Can have off axis/tangential cuts due to motion.
LV Mass Quantification � LV mass = 1. 04[(IVS + LVID + PWT)3 – (LVID)3] – 13. 6 g NL LV mass index for males: 93± 22 g/m 2 NL LV mass index for females: 76± 18 g/m 2
LV MASS BY 2 -D
RWT = 2(PWT/LVID)
REGIONAL LEFT VENT FUNCTION
Regional Myocardial Function • Assessment of motion of regions of the myocardium • Useful for detection of myocardial ischemia – Leads to decreased or paradoxical motion of the wall in affected areas • Regions can be roughly mapped to coronary arteries
NONISCHEMIC RWMA
DIFF ISCHEMIC VS NONISCHEMIC
LBBB
DOPPLER EVALUVATION OF GLOBAL LVF
SCHEMATIC REP OF ASSESSMENT OF LV VOL
Stroke Volume and Cardiac Output Flow = Cross sectional area (CSA) x Average velocity not usually measured directly VTI = velocity-time integral Area under the velocity curve for a single beat Represents ‘stroke distance’ SV = VTI * CSA
Stroke Volume Measurement of VTI Measurement of CSA
Pitfalls in Echo Calculation of CO � Accurate measurement of CSA ◦ Weakest link in the calculation ◦ VTI very good for assessing change in cardiac output with therapy, by following changes in VTI, since CSA is largely invariant in an individual � Measures forward flow only ◦ Regurgitant fraction not considered ◦ May over-estimate systemic cardiac output � Echocardiographic window in mechanically ventilated patients may be poor
WALL STRESS
LEFT VENTRICULAR dp/dt
CW doppler to measure rate of rise of MR jet may correlate to LVEF A slow rate of rise may indicate poor systolic function Must have MR present, and good doppler study present (more difficult with eccentric jets)
INDEX OF MYOCARDIAL PERFORMANCE
Index of Myocardial Performance Uses systolic and diastolic time intervals to evaluate global ventricular performance Systolic dysfunction causes prolonged isovolumetric contraction time (ICT) and a shortened ejection time (ET). IMP = (ICT + IRT)/ET
Index of Myocardial Performance � Normal LV: 0. 39 +/- 0. 05 � LV, DCM: 0. 59 +/- 0. 10 � Normal RV: 0. 28 +/- 0. 04 � Primary Pulm Htn: 0. 93 +/- 0. 34 � Use PW of AV inflow signal, or CW to get AV regurgitant signal � Also need to measure interval between AV closure and opening (AVco) � PW or CW to capture semilunar outflow signal to measure ejection time (ET) IMP = (AVco – ET)/ET
Summary � LV Mass Quantification: M-mode, Arealength method, Truncated ellipsoid method, and Subjective assessment. � LV Volume Quantification: M-mode, Subjective assessment � LV Function Quantification: Modified Simpson’s and Subjective Assessment by region. Also by M-mode, Single plane area length method, Velocity of Circumferential Shortening, Mitral Annular Excursion, EPSS, Rate of Rise of MR jet, Index of myocardial performance, etc
ANGIOGRAPHIC ASSESSMENT OF LV FUNCTION
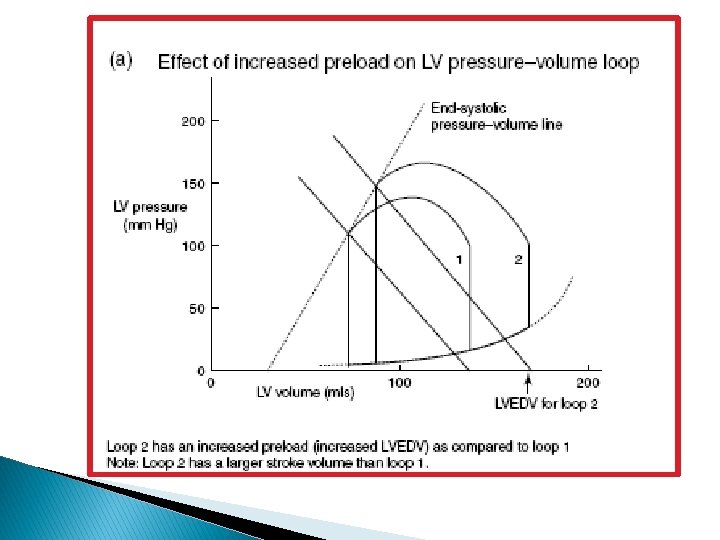
LV PRELOAD � Amout of passive tension or strectch on the ventricular walls prior to systole � This load determines end diastolic sarcomere length and force of contraction � This inturn decides stroke volume and cardiac output
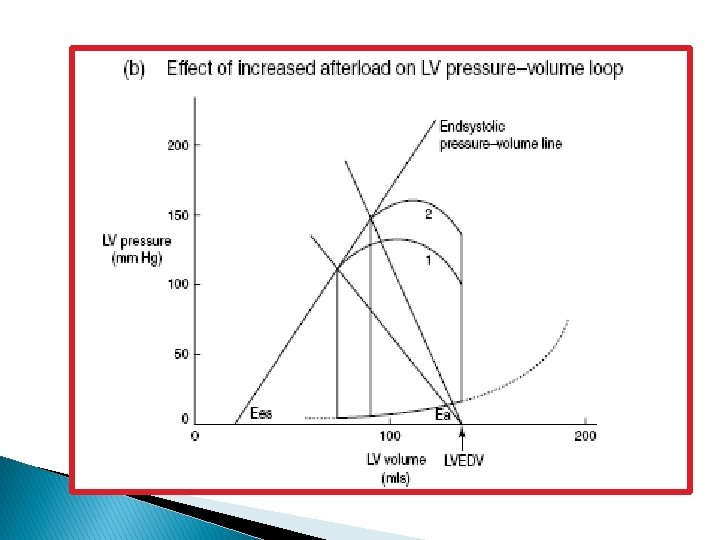
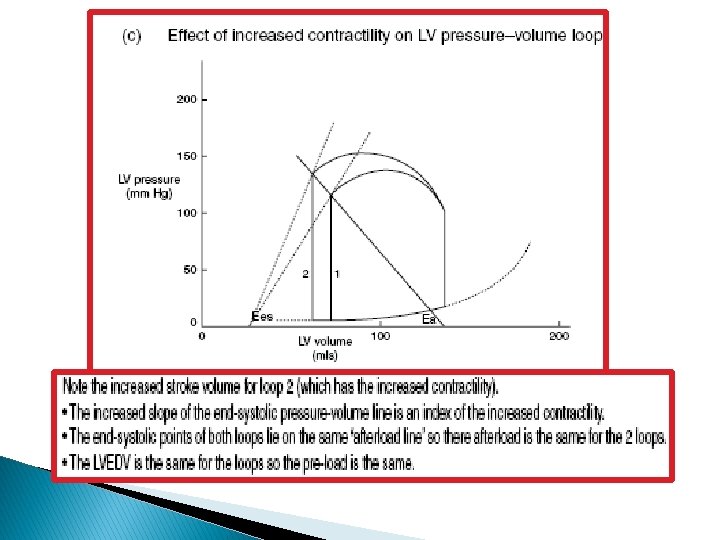
AFTERLOAD AND CONTRACTILITY � Afterload is the wall stress during ejection � Three major components are-peripheral resistance, arterial compliance, & peak intraventricular pressure. � Contractility is the inherent property of the myocardium to contract independent of the changes in pre & afterload
EVALUATION OF SYSTOLIC PERFO � CONTRACTILITY INDICES Isovolumic indices Maximum dp/dt Maximum (dp/dt)/p Vpm or peak([dp/dt]/28 p) (dp/dt)/Pd at Pd=40 mm hg Ejection phase indices LVSWI EF MNSER(mean normalised syst eject rate) Mean Vcf
Isovolumic indices � Dp/dt-max rate of rise of LV systolic pressure -oldest & widely used � Nl-1610± 290 mm. Hg/sec
EJECTION INDICES
LVSW � Area within PV diagrams-most accurate � Other methods LVSW=(LVSP−LVDP)SV( 0. 0136) LVSP&LVDP=MEAN SYST/DIAST PR SV=STROKE VOL IN ml 0. 0136=for converting mm Hg-ml into g-m
LVSW=(Ao. SP−PCWP)SV(0. 0136) � LVSW –good measure in the absence of vol or pressure overload � Nl-90± 30 g-m � Values ≤ 25 indicate severe Lv syst failure & <20 prognosis is grave. � But reflects syst performance only when ventricle is homogenous in consistency-DCMP � In ext MI LVSW may be depressed even if contractility is normal
� Lv syst function can be assessed using only volume data from P-V diagram � EF=[(LVEDV−LVESV)/LVEDV] � EF/ Ejection time obtained from Ao pressure tracing =Mean normalised syst ejection rate MNSER=(LVEDV−LVESV)/(LVEDVх. ET) NL-EF(angio)=. 72± 0. 08 Nl MNSER(angio)=3. 32± 0. 84 EDV/sec
� Vcf=velocity shortening of the circumferential fiber � Rate of shortening of lv myo fiber in a circmferential plane at the midpoint of the long axis of the ventricle � Mean. Vcf=end diast endocardial circum fiber length −end syst length � Vcf=(Ded−Des)/Ded(ET) � Nl-1. 83± 0. 56 ED circ/sec
� Drawbacks-influenced by preload & afterload � An Lvef≤. 40 indicates depressed lv contractility, if there is no loading to account for the reduction. � Interpretation of ejection phase indices are improved by consideration of the preload & afterload.
PRESSURE VOLUME LOOPS
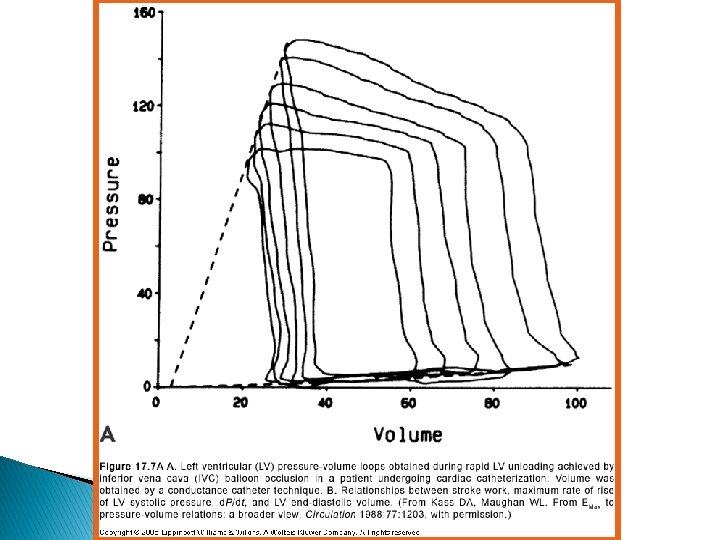
ESPVR � Fundamental principle of end-systolic Pv analysis is that, at end-systole there is a single line relating LV chamber vol to pressure, unique for the level of contractility & independent of loading conditions. � Most reliable index of contractility � Insensitive to changes in pre, afterload& heart rate � Slope of the end syst pr vol curve is called elastance-sensitive parameter
Other indices � LVdp/dt � Slope max and EDV of this as an index of contractility
Stress-shortening relationship � Inverse relation between the two � ↑afterload→↑syst wallstress→↓myocardial shortening
THANK YOU