Evaluation of Laboratory Data in Nutrition Assessment Laboratory

Evaluation of Laboratory Data in Nutrition Assessment

Laboratory Data and the NCP • Used in nutrition assessment (a clinical sign supporting nutrition diagnosis) • Used in Monitoring and Evaluation of the patient response to nutritional intervention

Specimen Types • Serum: the fluid from blood after blood cells and clot removed • Plasma: fluid from blood centrifuged with anticoagulants • Erythrocytes: red blood cells • Leukocytes: white blood cells • Other tissues: scrapings and biopsy samples • Urine: random samples or timed collections • Feces: random samples or timed collections • Less common: saliva, nails, hair, sweat

Interpretation of Routine Medical Laboratory Tests • Clinical Chemistry Panels • Basic metabolic panel • Comprehensive metabolic panel • Complete blood count • Urinalysis • Hydration status
 Also called Chem 7 Includes • Electrolytes:")
Clinical Chemistry Panels: Basic Metabolic Panel (BMP) Also called Chem 7 Includes • Electrolytes: Na+, K+, Cl-, HCO 3 or total CO 2 • Glucose • Creatinine • BUN

Basic Metabolic Panel Charting Shorthand Na Cl BUN BMP glucose K+ CO 2 Creatinine
: Comprehensive Metabolic Panel Includes • BMP except CO 2 • Albumin")
Clinical Chemistry Panels(CMP): Comprehensive Metabolic Panel Includes • BMP except CO 2 • Albumin • Serum enzymes (alkaline phosphatase, AST [SGOT], ALT [SGPT] • Total bilirubin • Total calcium Phosphorus, total cholesterol and triglycerides often ordered with the CMP
 • • Red blood cells Hemoglobin concentration")
Clinical Chemistry Panels: Complete Blood Count (CBC) • • Red blood cells Hemoglobin concentration Hematocrit Mean cell volume (MCV) Mean cell hemoglobin (MCH) Mean cell hemoglobin concentration (MCHC) White blood cell count (WBC) Differential: indicates percentages of different kinds of WBC

Clinical Chemistry Panels: Urinalysis Specific gravity 1. 010 -1. 025 mg/ml p. H 6 -8 (normal diet) Protein 2 -8 mg/dl Glucose Ketones Blood Bilirubin Urobilinogen Nitrite Leukocyte esterage Not detected Negative Not detected 0. 1 -1 units/dl Negative

Types of Assays • Static assays: measures the actual level of the nutrient in the specimen (serum iron, white blood cell) • Functional Assays: measure a biochemical or physiological activity that depends on the nutrient of interest (serum ferritin, TIBC) • (Functional assays are not always specific to the nutrient)

Assessment of Nutrient Pool

 •")
Role of the Kidney HOMEOSTASIS • Electrolytes: sodium, potassium, chloride • Water (osmolality) • Acid-base: bicarbonate (ECFV buffer) • Minerals: calcium, phosphorus, magnesium • Waste material: urea (protein), creatinine (muscle), uric acid (nucleic acids)

Classification of LFTs Group I: Markers of liver dysfunction ▫ ▫ Serum bilirubin: total and conjugated Urine: bile salts and urobilinogen Total protein, serum albumin and albumin/globulin ratio Prothrombin Time
")
Classification of LFTs Group II: Markers of hepatocellular injury ▫ ▫ Alanine aminotransferase (ALT) Aspartate aminotransferase (AST)
 g-glutamyltransferase")
Classification of LFTs Group III: Markers of cholestasis ▫ ▫ Alkaline phosphatase (ALP) g-glutamyltransferase (GGT)

Limitations of LFTs • Normal LFT values do not always indicate absence of liver disease ▫ Liver a has very large reserve capacity • Asymptomatic people may have abnormal LFT results ▫ Diagnosis should be based on clinical examination

Common serum liver chemistry tests

Bilirubin • A byproduct of red blood cell breakdown • It is the yellowish pigment observed in jaundice • High bilirubin levels are observed in: ▫ Gallstones, acute and chronic hepatitis

Serum bilirubin levels • Normal ▫ 0. 2 – 0. 8 mg/d. L • Unconjugated (indirect): ▫ 0. 2 – 0. 7 mg/d. L • Conjugated (direct): ▫ 0. 1 – 0. 4 mg/d. L • Latent jaundice: ▫ Above 1 mg/d. L • Jaundice: ▫ Above 2 mg/d. L

Assessment of Hydration Status • Dehydration: a state of negative fluid balance caused by decreased intake, increased losses, or fluid shifts • Overhydration or edema: increase in extracellular fluid volume; fluid shifts from extracellular compartment to interstitial tissues • Caused by increase in capillary hydrostatic pressure or permeability • Decrease in colloid osmotic pressure • Physical inactivity • Use laboratory and clinical data to evaluate patient

Hypovolemia Isotonic fluid loss from the extracellular space caused by • Fluid loss (bleeding, fistulas, nasogastric drainage, excessive diuresis, vomiting and diarrhea) • Reduced fluid intake • Third space fluid shift, when fluid moves out of the intravascular space but not into intracellular space (abdominal cavity, pleural cavity, pericardial sac) caused by increased permeability of the capillary membrane or decrease on plasma colloid osmotic pressure
 • Central venous")
Symptoms of Hypovolemia • Orthostatic Hypotension (caused by change in position) • Central venous and pulmonary pressures • Increased heart rate • Rapid weight loss • Decreased urinary output • Patient cool, clammy • Decreased cardiac output • Ask the medical team!!

Treatment of Hypovolemia • Replace lost fluids with fluids of similar concentration • Restores blood volume and blood pressure • Usually isotonic fluid like normal saline or lactated Ringer’s solution given IV
 in the extracellular compartment •")
Hypervolemia • Excess of isotonic fluid (water and sodium) in the extracellular compartment • Osmolality is usually not affected since fluid and solutes are gained in equal proportion • Elderly and those with renal and cardiac failure at risk

Causes of Hypervolemia • Results from retention or excessive intake of fluid or sodium or shift in fluid from interstitial space into the intravascular space • Fluid retention: renal failure, CHF, cirrhosis of the liver, corticosteroid therapy, hyperaldosteronism • Excessive intake: IV replacement tx using normal saline or Lactated Ringer’s, blood or plasma replacement, excessive salt intake

Causes of Hypervolemia • Fluid shifts into vasculature caused by remobilization of fluids after burn tx, administration of hypertonic fluids, use of colloid oncotic fluids such as albumin

Symptoms of Hypervolemia • No single diagnostic test, so signs and symptoms are key • Cardiac output increases • Pulse rapid and bounding • BP, CVP, PAP and pulmonary artery wedge pressure rise • As the heart fails, BP and cardiac output drop • Distended veins in hands and neck

Symptoms of Hypervolemia • Anasarca: severe, generalized edema • Pitting edema: leaves depression in skin when touched • Pulmonary edema: crackles on auscultation • Patient SOB and tachypneic • Labs: low hematocrit, normal serum sodium, lower K+ and BUN (or if high, may mean renal failure) • ABG: low O 2 level, Pa. CO 2 may be low, causing drop in p. H and respiratory alkalosis

Treatment of Hypervolemia • Restriction of sodium and fluid intake • Diuretics to promote fluid loss; morphine and nitroglycerine to relieve air hunger and dilate blood vessels; digoxin to strengthen heart • Hemodialysis or CAVH

Dehydration • Excessive loss of free water • Loss of fluids causes an increase in the concentration of solutes in the blood (increased osmolality) • Water shifts out of the cells into the blood • Causes: prolonged fever, watery diarrhea, failure to respond to thirst, highly concentrated feedings, including TF

Symptoms of Dehydration • • • Thirst Fever Dry skin and mucus membranes, poor skin turgor, sunken eyeballs Decreased urine output Increased heart rate with falling blood pressure Elevated serum osmolality; elevated serum sodium; high urine specific gravity

Treatment of Dehydration • Use hypotonic IV solutions such as D 5 W • Offer oral fluids • Rehydrate gradually

Laboratory Values and Hydration: BUN Lab Test Hypovolemia Hypervolemia Other factors influencing result BUN Increases Decreases Low: inadequate dietary protein, severe liver Normal: failure 10 -20 mg/dl High: prerenal failure; excessive protein intake, GI bleeding, catabolic state; glucocorticoid therapy Creatinine will also rise in severe hypovolemia Adapted from Charney and Malone. ADA Pocket Guide to Nutrition Assessment, 2004.

Laboratory Values and Hydration Status: BUN: Creatinine Ratio Lab Test BUN: creatinine ratio Normal: 10 -15: 1 Hypo. Hypervolemia Increases Decreases Other factors influencing result Low: inadequate dietary protein, severe liver failure High: prerenal failure; excessive protein intake, GI bleeding, catabolic state; glucocorticoid therapy Adapted from Charney and Malone. ADA Pocket Guide to Nutrition Assessment, 2004.

Laboratory Values and Hydration: HCT Lab Test Hypovolemia Hypervolemia Other factors influencing result Hemato. Increases Decreases Low: anemia, hemorrhage crit with subsequent hemodilution (occurring Normal: after approximately 12 -24 Male: hours) 42 -52% High: chronic hypoxia Female: 37 (chronic pulmonary disease, -47% living at high altitude, heavy smoking, recent transfusion) Adapted from Charney and Malone. ADA Pocket Guide to Nutrition Assessment, 2004.

Laboratory Values and Hydration: Alb, Na+ Lab Test Hypovolemia Hypervolemia Other factors influencing result Serum albumin Low: malnutrition; acute phase response, liver failure High: rare except in hemoconcentration Serum sodium Typical- , normal ly or can be normal or Serum sodium generally reflects fluid status and not sodium balance Adapted from Charney and Malone. ADA Pocket Guide to Nutrition Assessment, 2004.

Laboratory Values and Hydration Status Lab Test normal Hypovolemia Hypervolemia Serum osmolality (285 -295 mosm/kg) Typically but can be normal or Urine sp. Gravity 1. 003 -1. 030 Urine osmolality (200 -1200 mosm/kg) Other factors influencing result Low: diuresis, hyponatremia, sickle cell anemia High: SIADH, azotemia, Adapted from Charney and Malone. ADA Pocket Guide to Nutrition Assessment, 2004.
 • ↑ renal losses (diuresis) • ↑ GI")
Hypokalemia (K+< 3. 5 m. Eq/L) • ↑ renal losses (diuresis) • ↑ GI losses (diarrhea, vomiting, fistula) • K+ wasting meds (thiazide and loop diuretics, etc) • Shift into cells (anabolism, refeeding, correction of glucosuria or DKA) • Inadequate intake
 • Decreased renal excretion as in acute or chronic")
Hyperkalemia (K+>5. 0 m. Eq/L) • Decreased renal excretion as in acute or chronic renal failure • Medications, e. g. potassium sparing diuretics, beta blockers, ACE inhibitors • Shift out of cells (acidosis, tissue necrosis, GI hemorrhage, hemolysis)

Serum Calcium • Normal serum 9. 0 -10. 5 mg/d. L (includes ionized calcium and calcium bound to protein, primarily albumin, and ions) • Ionized calcium: 4. 5 -5. 6 mg/d. L • Normal levels maintained by hormonal regulation using skeletal reserves • Ionized calcium is more accurate, especially in pt with hypoalbuminemia; evaluate before repleting Ca+ Charney and Malone, 2004, p. 89
 •")
Hypocalcemia (serum calcium <9. 0 mg/d. L; ionized Ca+ <4. 5 mg/d. L) • • • Hypoalbuminemia Hypoparathyroidism Hypomagnesemia Renal failure, renal tubular necrosis Vitamin D deficiency or impaired metabolism
 •")
Hypercalcemia (serum calcium >10. 5 mg/d. L; ionized Ca+ >5. 6 mg/d. L) • Hyperparathyroidism • Some malignancies, especially breast, lung, kidney; multiple myeloma, leukemia, lymphoma • Medications: thiazide diuretics, lithium, vitamin A toxicity • Immobilization • Hyperthyroidism Charney and Malone, 2004, p. 91
 • Serum phos a poor")
Serum Phosphorus (normal 3. 0 -4. 5 mg/d. L) • Serum phos a poor reflection of body stores because <1% is in ECF • Bones serve as a reservoir
 • Impaired absorption (diarrhea, Vitamin D deficiency, impaired metabolism)")
Hypophosphatemia (<3. 0 mg/d. L) • Impaired absorption (diarrhea, Vitamin D deficiency, impaired metabolism) • Medications: phosphate binding antacids, sucralfate, insulin, steroids) • Alcoholism, especially during withdrawal • Intracellular shifts in alkalosis, anabolism, neoplasms • Refeeding syndrome • Increased losses: hyperparathyroidism, renal tubular defects, DKA recovery, hypomagnesemia, diuretic phase of ATN Charney and Malone, 2004, p. 93
 • Decreased renal excretion: acute or chronic renal failure")
Hyperphosphatemia (>4. 5 mg/d. L) • Decreased renal excretion: acute or chronic renal failure (GFR<20 -25 m. L/min); hypoparathyroidism • Increased cellular release: tissue necrosis, tumor lysis syndrome • Increased exogenous phosphorus load or absorption, phosphorus containing laxatives or enemas, vitamin D excess • Acidosis
 • Decreased")
Hypomagnesemia <1. 3 m. Eq/L (normal 1. 3 -2. 1 m. Eq/L) • Decreased absorption: prolonged diarrhea, intestinal or biliary fistula, intestinal resection or bypass, steatorrhea, ulcerative colitis; upper GI fluid loss, gastric suctioning, vomiting • Renal losses: osmotic diuresis, DM with glucosuria, correction of DKA, renal disease with magnesium wasting, hypophosphatemia, hypercalcemia, hyperthyroidism • Alcoholism • Inadequate intake: malnutrition • Medications • Intracellular shift: acute pancreatitis • Refeeding syndrome
 • Acute or chronic renal failure")
Hypermagnesemia (>2. 1 m. Eq/L) • Acute or chronic renal failure

Assessment for Protein-Calorie Malnutrition • Hormonal and cell-mediated response to stress • Negative acute-phase respondents • Positive acute-phase respondents • Nitrogen balance

Assessment for Protein-Calorie Malnutrition–cont’d • Hepatic transport proteins • Albumin • Transferrin • Prealbumin • Retinol-binding protein • C-reactive protein • Creatinine • Immunocompetence

Hormonal and Cell-Mediated Response to Inflammatory Stress • Acute illness or trauma causes inflammatory stress • Cytokines (interleukin-1, interleukin-6 and tumor necrosis factor) reorient hepatic synthesis of plasma proteins • Although protein-energy malnutrition can occur simultaneously, interpretation of plasma proteins is problematic

Hormonal and Cell-Mediated Response to Inflammatory Stress • Negative acute-phase respondents (albumin, transthyretin or prealbumin, transferrin, retinol-binding protein) decrease • Positive acute-phase reactants (C-reactive protein, orosomucoid, fibrinogen) increase • The change in these proteins is proportional to the physiological insult

Nitrogen Balance Studies • Oldest biochemical technique for assessment protein status • Based on the fact that 16% of protein is nitrogen • Nitrogen intake is compared to nitrogen output, adjusted for insensible losses (skin, hair loss, sweat)

Nitrogen Balance Studies • Nitrogen balance in healthy adults is 0 • Nitrogen balance is positive in growing children, pregnant women, adults gaining weight or recovering from illness or injury • Nitrogen balance is negative during starvation, catabolism, PEM
 –(urinary nitrogen [g/24")
Nitrogen Balance Calculations • Nitrogen balance = nitrogen intake (g/24 hours) –(urinary nitrogen [g/24 hours) + 2 g/24 hours • Use correction of 4 g/24 hours if urinary urea nitrogen is used • Nitrogen intake = (grams protein/24 hours)/6. 25

Nitrogen Balance Challenges • Urea nitrogen is highly variable as a percent of total nitrogen excreted • It is nearly impossible to capture an accurate nitrogen intake for patients taking food po • Most useful in evaluating the appropriateness of defined feedings, e. g. enteral and parenteral feedings

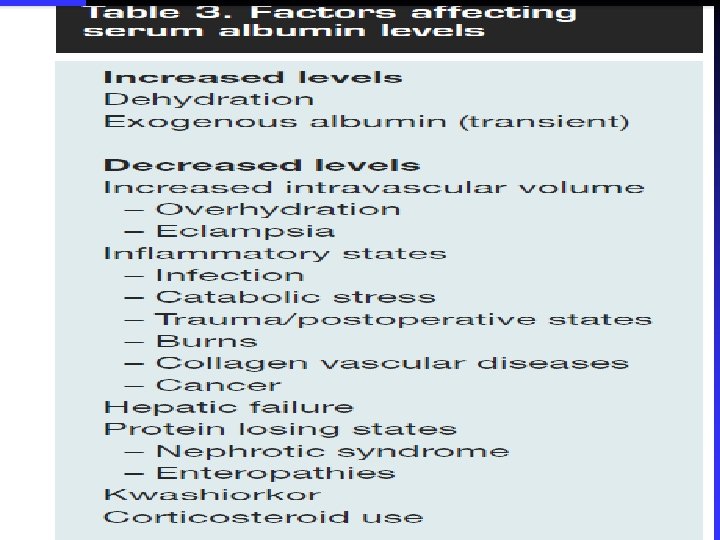
Visceral Proteins: Serum Albumin • • • Reference range: 3. 5 -5. 2 g/dl Abundant in serum, stable (half-life 3 weeks) Preserved in the presence of starvation (marasmus) • Negative acute phase reactant (declines with the inflammatory process) • Large extravascular pool (leaves and returns to the circulation, making levels difficult to interpret) • Therefore, albumin is a mediocre indicator of nutritional status, but a very good predictor of morbidity and mortality

Visceral Proteins: Plasma Transferrin • • Reference range: 200 -400 mg/dl Half-life: 1 week Negative acute phase respondent Increases when iron stores are depleted so affected by iron status as well as protein-energy status • Responds too slowly to be useful in an acute setting
 • • • Reference range: 19 -43 mg/dl Half-life: 2")
Visceral Proteins: Transthyretin (Prealbumin) • • • Reference range: 19 -43 mg/dl Half-life: 2 days Negative acute-phase reactant Zinc deficiency reduces levels Due to short half-life, it is useful in monitoring improvements in proteinenergy status if baseline value is obtained near the nadir as inflammatory response wanes

Visceral Proteins: Retinol-Binding Protein • • Reference range: 2. 1 -6. 4 mg/dl Half-life: 12 hours Negative acute-phase protein Unreliable when vitamin A (retinol) status is compromised • Elevated in the presence of renal failure, regardless of PEM status

Visceral Proteins: C-Reactive Protein • Positive acute-phase reactant • Increases within 4 -6 hours of injury or illness • Can be used to monitor the progress of the stress reaction so aggressive nutrition support can be implemented when reaction is subsiding • Mildly elevated CRP may be a marker for increased risk for cardiovascular disease

Inflammation • hs-CRP • Homocysteine

Urinary Creatinine • Formed from creatine, produced in muscle tissue • The body’s muscle protein pool is directly proportional to creatinine excretion • Skeletal muscle mass (kg) = 4. 1 = 18. 9 x 24 hour creatinine excretion (g/day) • Confounded by meat in diet • Requires 24 -hour urine collection, which is difficult

Markers of Malabsorption • • • Fecal fat Fat-soluble vitamins Vitamin D

Lipid Indices of Cardiovascular Risk • • • Total cholesterol LDL HDL: HDL 2 a, HDL 2 b, HDL 2 c, HDL 3 a, HDLdb IDL VLDL Lp(a)

Nutrition Diagnoses and Laboratory Indices • Nutrition-related labs can be used either as diagnostic labels or a clinical sign


Lipids profile: Lipid profile: A pattern of lipids in the blood. • A lipid profile usually includes the levels of total cholesterol, high-density lipoprotein (HDL) cholesterol, triglycerides, and Using these values, a laboratory may also calculate: Very low-density lipoprotein and Cholesterol : HDL ratio it Ordered to determine the risk of heart disease •

Cholesterol levels: High level associated with heart disease Good level: below 200 mg/dl (low risk of heart disease). Border line: 240 mg/dl (if higher at high risk) Notes: Measuring blood cholesterol level not need fasting? Cholesterol level is not affected by single meal but affected by long term pattern of eating (change from high fat diet to low fat diet for several weeks) Cholesterol level is elevated during pregnancy (till 6 weeks after delivery) Some drugs are known to increase cholesterol levels as anabolic steroids, beta blockers, epinephrine, oral contraceptives and vitamin D.
: LDL: bad cholesterol \" carry cholesterol from liver")
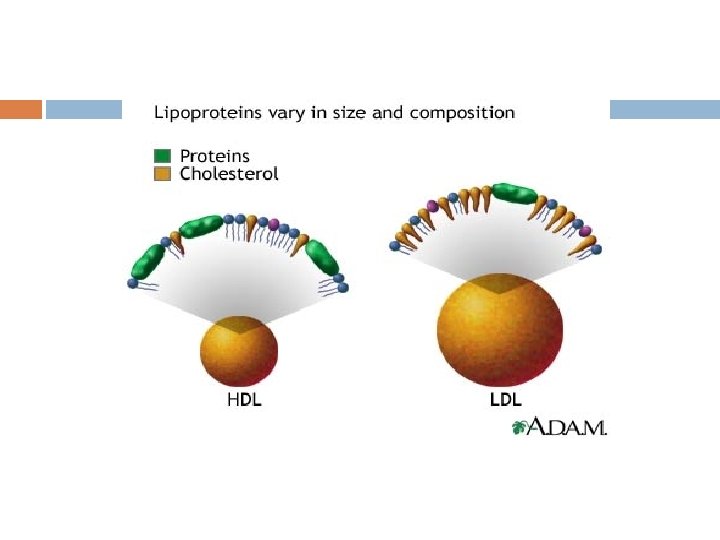
1 - LDL (low density lipoprotein): LDL: bad cholesterol " carry cholesterol from liver to blood then to organs It has less protein content and contains more cholesterol. LDL cholesterol is easy to stick to the walls of blood vessels. High LDL in blood associated with atherosclerosis, heart disease and myocardial infraction Reducing LDL levels is a major treatment target for cholesterollowering medications. Because high LDL in blood will deposited in blood artery and trigger clot formation

Preparation: Blood should be collected after a 12 -hour fast (no food or drink, except water). For the most accurate results, wait at least 2 months after a heart attack, surgery, infection, injury or pregnancy to check LDL levels. Goal values: Less than 70 mg/d. L for those with heart or blood vessel disease and for other patients at very high risk of heart disease (those with metabolic syndrome) Less than 100 mg/d. L for high risk patients (e. g. , some patients who have multiple heart disease risk factors) if you have heart disease or diabetes. Less than 130 mg/d. L for individuals who are at low risk for coronary artery disease. if you have 2 or LDL less than 160 mg/d. L if you have 0 or 1 risk factor. more risk factors. Measuring LDL-C level: LDL level calculated either : directly or by equation LDL= Total cholesterol -(HDL+TG/5)
 : HDL: good cholesterol, carry cholesterol from organs and blood")
HDL (high density lipoprotein) : HDL: good cholesterol, carry cholesterol from organs and blood to liver to get rid of it It removes excess cholesterol from tissues (it cleans blood). High levels linked to a reduced risk of heart and blood vessel disease. The higher your HDL level, the better.

Goal value: § Greater than 40 mg/d. L § A good level of HDL is 60 mg/dl or more. Preparation: § This test may be measured any time of the day without fasting. However, if the test is drawn as part of a total lipid profile, it requires a 12 -hour fast (no food or drink, except water). For the most accurate results, wait at least two months after a heart attack, surgery, infection, injury or pregnancy to check HDL levels.
 Directly linked to risk of heart and blood vessel disease. Goal")
Total Cholesterol (TC) Directly linked to risk of heart and blood vessel disease. Goal values: 75 -169 mg/d. L for those age 20 and younger 100 -199 mg/d. L for those over age 21 Preparation: This test may be measured any time of the day without fasting. However, if the test is drawn as part of a total lipid profile, it requires a 12 -hour fast (no food or drink, except water). For the most accurate results, wait at least two months after a heart attack, surgery, infection, injury or pregnancy to check cholesterol levels.

TG levels: TG test needs 12 hrs fasting because its level is effected by meal (fatty meal, high carbohydrates meal) Level should be: Less than 150 mg/dl High TG leads to fatty liver
 Enzymes and")
Laboratory Testing • • • CBC Lipids electrolytes BNP (B-type Natriuretic peptide) Enzymes and Proteins

Laboratory Findings Troponin I • • • Earliest increase - 4 -6 hours Peak hours 10 -24 Duration of increase 4 -7 days Specificity 95% Sensitivity at peak >98%

Laboratory Findings CK Total • • • Earliest increase 4 -8 hours Peak hours 24 -36 hours Duration of Increase 36 -48 hours Specificity 57 -88% Sensitivity at peak 93 -100%

Laboratory Findings CK-MB • • • Earliest increase 3 -4 hours Peak hours 15 -24 Duration of Increase 24 -36 hours Specificity 93 -100% Sensitivity at peak 94 -100%
 n A cytoplasmic enzyme found in skeletal, muscle, liver, heart, kidney")
Lactate Dehydrogenase (LDH) n A cytoplasmic enzyme found in skeletal, muscle, liver, heart, kidney and red blood cells n 5 izoenzymes, composed of 4 subunit peptides of 2 distinct types: M (muscle ), H (heart)
 n 29")
In healthy adults: n 14 -26 % LD 1 (slow removal ) n 29 -39% LD 2 n 20 -26% LD 3 n 8 -16 % LD 4 n 6 -16 % LD 5 (rapid disappearance )
 n n n Widely distributed in many tissues Highest concentrations")
Aspartate aminotransferase (AST ) n n n Widely distributed in many tissues Highest concentrations are found in cardiac tissue, liver and skeletal muscle. Clinical utility in hepatocellular disorders and skeletal involvement. n Unuseful in diagnosis of AMI n Beginsto rise within 6 -8 hr. n Makes a peak at 24 hr. n Generally returns to normal within 5 days.

- Slides: 85