Evaluation of HYCOM Upper Ocean Mixing Parameterizations S


- Slides: 25
Evaluation of HYCOM Upper Ocean Mixing Parameterizations S. Daniel Jacob 1, Lynn K. Shay 2, George R. Halliwell 2 and David Le Vine 3 1 2 3 GEST, UMBC/ NASA GSFC, Greenbelt, MD 20771 MPO, RSMAS, University of Miami, FL 33149 NASA GSFC , Greenbelt, MD 20771 A. Wallcraft (NRL Stennis), M. Powell (NOAA HRD), O. M. Smedstad Partial Funding from NOAA Joint Hurricane Testbed, NSF US Weather Research Program
Upper Ocean Mixing and Hurricane Intensity • Based on Observational Analysis (Jacob et al. , JPO 2000) – Entrainment is the dominant mechanism in the mixed layer cooling. – Mixed layer heat and mass budgets strongly depend upon the entrainment scheme used. • Numerical Modeling (Jacob and Shay, JPO, 2003): – Measured and simulated quantities based on different hypothesis are used to compute entrainment mixing. – Bulk schemes in using MICOM
MOVIE 1 Gaspar KT PRT DDF
GILBERT UPPER OCEAN RESPONSE EXPERIMENT Shay et al. JGR 1992
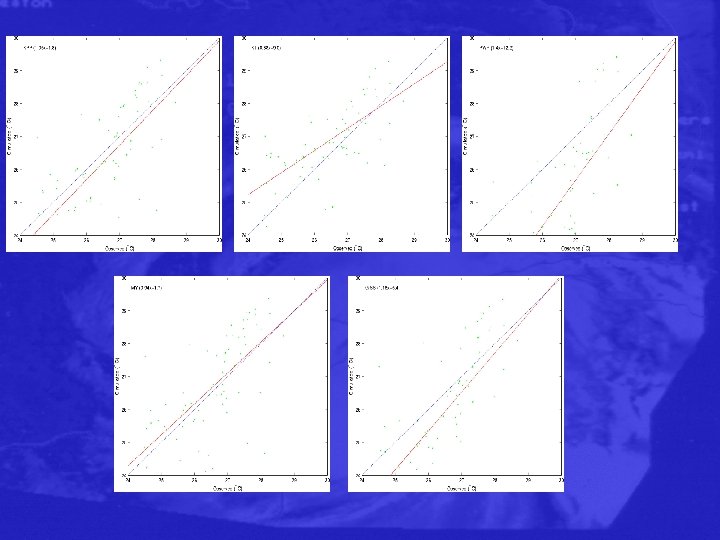
ALL MODEL-DATA COMPARISON STORM WAKE 1 WAKE 2
OBJECTIVES Mixing Schemes l Hybrid Coordinate Ocean Model • Evaluate higher order turbulence closure schemes for hurricane forcing based on the data acquired during the three storms l Precipitation Effects • TRMM measurements • Large rain-rates of more than 15 mm/hr have been observed. • Mixing effects • Heat Fluxes
Data Resources Data were acquired in 2002 as part of the NSF USWRP in two additional storms Isidore and Lili in the Caribbean and Gulf of Mexico Region. • Overall, number of profiles available for comparison include: • 339 Temperature Profiles from AXBTs, AXCPs and AXCTDs • 178 Current Profiles from AXCPs • 134 Salinity Profiles from AXCTD • Other data includes • Aircraft acquired atmospheric forcing data for specifying boundary layer forcing • 1988 year day 200 data for model initialization for Gilbert
Hurricane Gilbert Case • Configuration – – Domain: Gulf of Mexico Resolution: 0. 07 20/22/50 Levels/ Layers Closed Boundaries • Initial Conditions – Quiescent and Realistic – No Precip vs Precip for Quiescent conditions
TEMPERATURE-SALINITY DIAGRAM
WIND FIELD STRUCTURE 16 SEP 88 06 UTC
Gaspar MY 2. 5 Hycom Q Movie KPP PWP
2 Rmax
TEMPERATURE-SALINITY DIAGRAM Case E GCW Case C Case Q
MICOM HYCOM 1988 Yearday 200 to 258 with COADS climatological forcing with KT scheme Center position is accurate within 0. 3°, Strength consistent with data
KPP MY PWP GISS
PRECIP STRUCTURE 16 SEP 88 06 UTC mm/day
OCEAN RESPONSE at 06 UTC, 16 SEP 1988 MLT MLS KPP KPP NO PRECIP WITH PRECIP
ΔOCEAN RESPONSE at 06 UTC, 16 SEP 1988 KPP PWP ΔMLT MY 2. 5 GISS
ΔOCEAN RESPONSE at 06 UTC, 16 SEP 1988 KPP PWP MY 2. 5 GISS ΔMLS
No Precip 2 Rmax Precip
2 Rmax PWP
WIND FIELD STRUCTURE 22 SEP 02 12 UTC
KPP GISS
SUMMARY • HYCOM simulations also show a strong oceanic ML budget dependence on the entrainment closure scheme in the directly forced region. – Implications for storm intensity. • Initial comparisons with data indicates better performance of KPP and MY 2. 5 for the Gilbert case. Comparisons will be performed with 50 levels/layers and also in Isidore and Lili cases. • The PWP scheme simulates coolest and most saline mixed layer without precipitation. Due to the stabilizing effect of precipitation, mixed layer cooling is reduced by ~0. 5° C when rainfall is added. • A freshening of 0. 25 PSU is seen in simulations with added precipitation. This counteracts mixing of more saline water from below.