Evaluation of CarrizoWilcox Groundwater Elevations and Changes in


 Actual > DFC (Positive Difference)")


- Slides: 16
Evaluation of Carrizo-Wilcox Groundwater Elevations and Changes in Rusk County for 2018 Bill Hutchison, Ph. D. , P. E. , P. G. Rusk County GCD Board Meeting August 5, 2019
Background • Hydrex Environmental completed a comparison of actual groundwater elevation with DFCs for 2017 data • Relied on GIS-based interpolation and averaging • Missing or anomalous data can unreasonably skew results • Proposal dated November 5, 2018 outlined an alternative approach that relies on point comparisons • Less reliance on averaging and interpolation • Missing or anomalous data are easier to handle • Work was authorized in January 2019
Tasks 1. Compare RCGCD data with TWDB database 2. Compare Actual RCGCD data with GAM estimates from DFC simulation 3. Present summary of point by point comparison 4. Interpret comparison with rainfall data 5. Develop spreadsheet template for future updates 6. Prepare draft report 7. Present results at RCGCD Board meeting
Task 1 – RCGCD Data and TWDB Data • Well number inconsistencies • Not fully completed
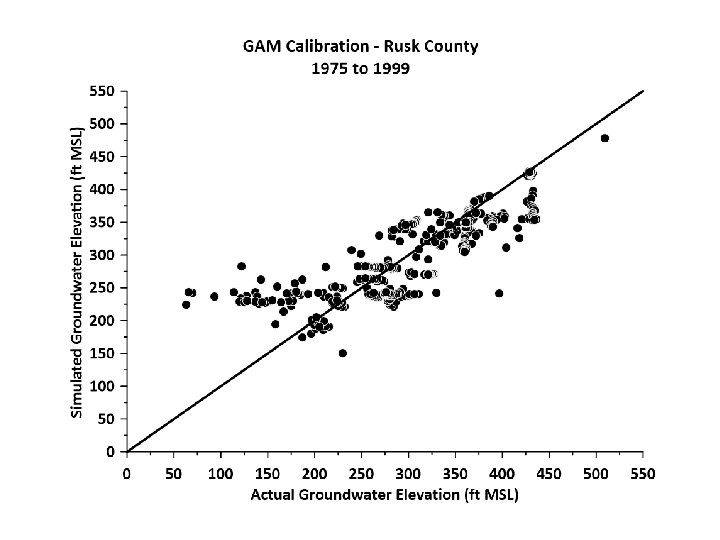
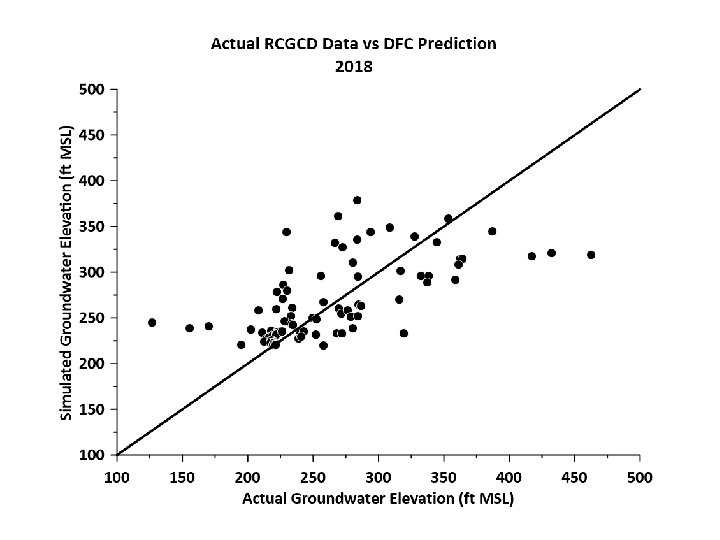
Task 2 – RCGCD Data and GAM Estimates • TWDB Data and Model • 1975 to 1999 • Model Calibration Assessment in Rusk County • RCGCD Data and DFC Predictions • DFC prediction = annual model estimates at location of well • 2018 plot • Report will also have 2009 to 2018 plots for perspective
Pumping Water Levels?
Number of Readings = 553 Average Error = 5. 16 ft Standard Deviation = 40. 85 ft Scaled Residual Std Dev = 0. 092
Task 3 - 2018 Comparison • RCGCD Data = 86 Wells • Extracted point estimates of DFC simulation groundwater elevations from model (Scenario 4)
DFC > Actual (Negative Difference) Actual > DFC (Positive Difference)
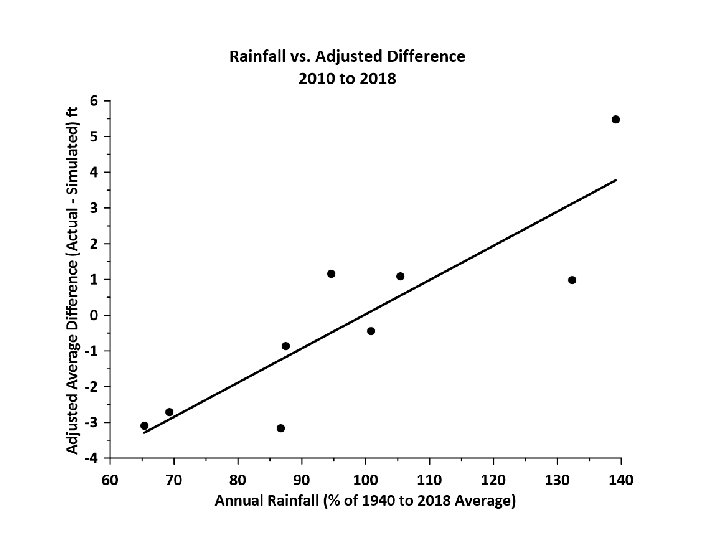
Task 4 – Comparison with Precipitation • Groundwater elevation rise during wet years and fall during dry years • Combined effect of: • • Increase recharge during wet years Decrease recharge during dry years Increased pumping during dry years Decreased pumping during wet years
76% of the variation in the average difference is explained by the variation in annual rainfall
Task 5 – Spreadsheet Template Task 6 - Report • Work in progress
Questions and Discussion Bill Hutchison, Ph. D. , P. E. , P. G. billhutch@texasgw. com 512 -745 -0599