
Evaluating the Adequacy of the CNCPS Model Luis


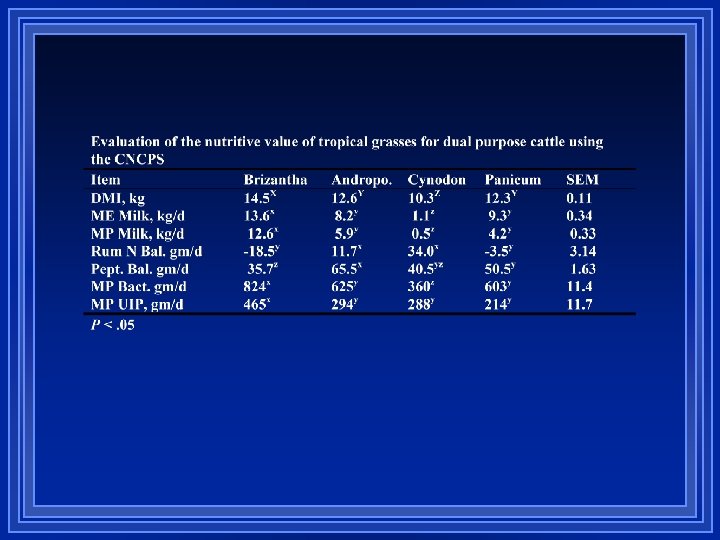
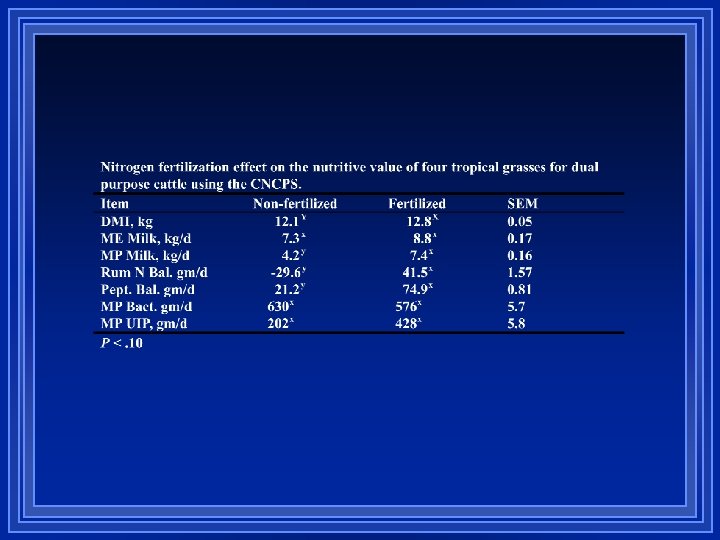
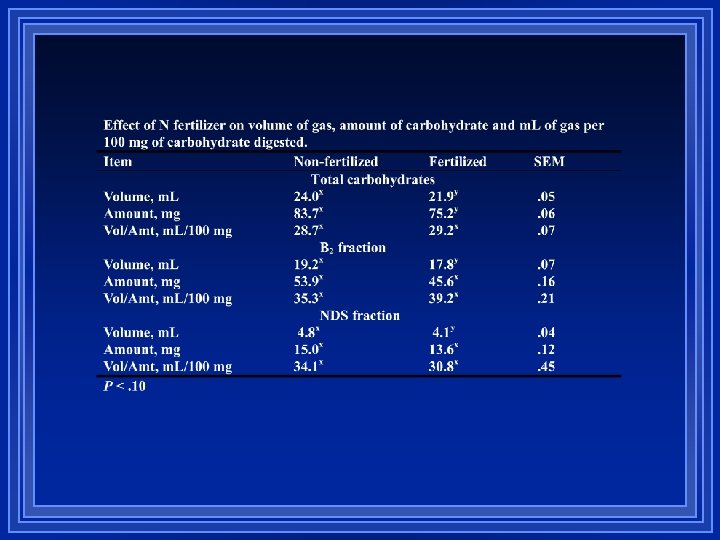
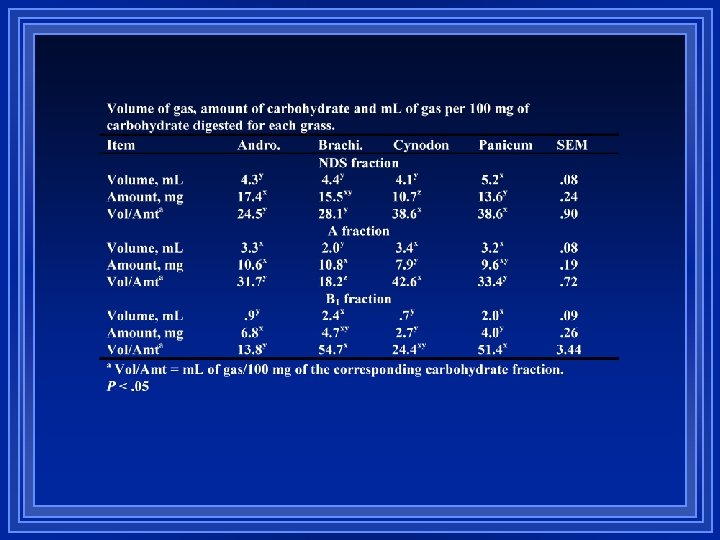
- Slides: 46
Evaluating the Adequacy of the CNCPS Model Luis Orlindo Tedeschi Bertha Rueda-Maldonado Francisco “Paco” Juárez-Lagunes
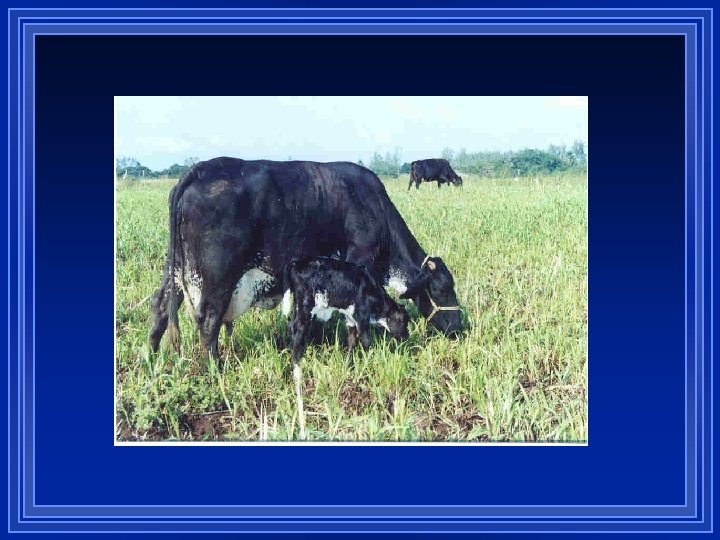
Mexican dual-purpose lactating cow evaluation
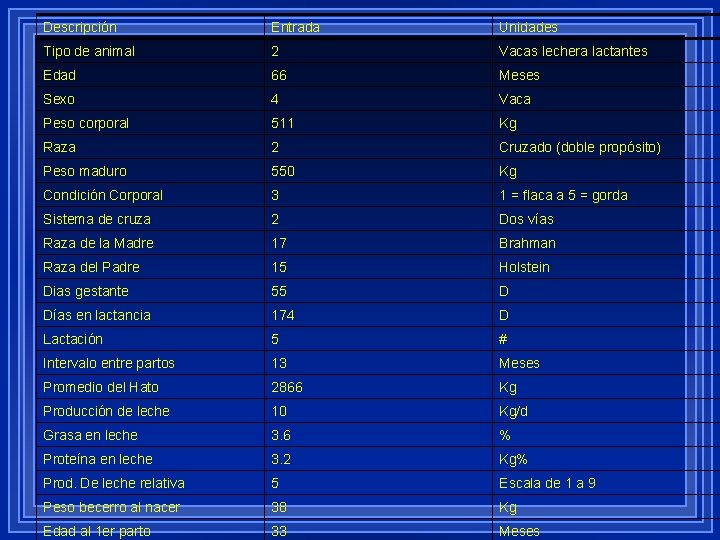
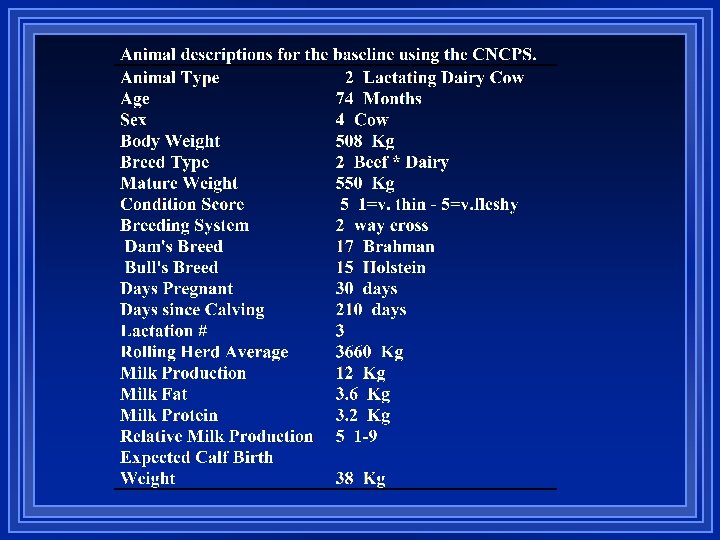
Descripción Entrada Unidades Tipo de animal 2 Vacas lechera lactantes Edad 66 Meses Sexo 4 Vaca Peso corporal 511 Kg Raza 2 Cruzado (doble propósito) Peso maduro 550 Kg Condición Corporal 3 1 = flaca a 5 = gorda Sistema de cruza 2 Dos vías Raza de la Madre 17 Brahman Raza del Padre 15 Holstein Dias gestante 55 D Días en lactancia 174 D Lactación 5 # Intervalo entre partos 13 Meses Promedio del Hato 2866 Kg Producción de leche 10 Kg/d Grasa en leche 3. 6 % Proteína en leche 3. 2 Kg% Prod. De leche relativa 5 Escala de 1 a 9 Peso becerro al nacer 38 Kg Edad al 1 er parto 33 Meses
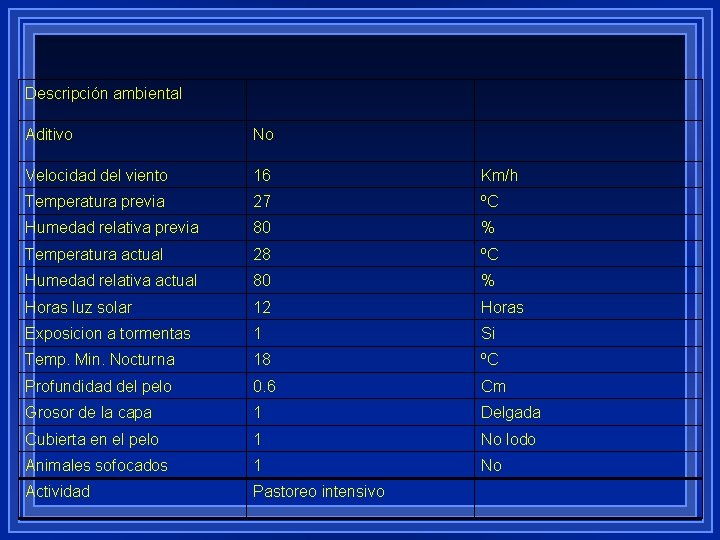
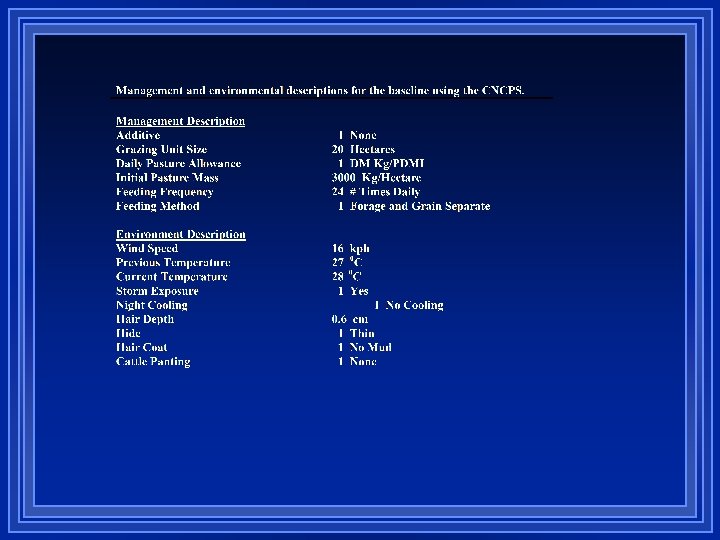
Descripción ambiental Aditivo No Velocidad del viento 16 Km/h Temperatura previa 27 ºC Humedad relativa previa 80 % Temperatura actual 28 ºC Humedad relativa actual 80 % Horas luz solar 12 Horas Exposicion a tormentas 1 Si Temp. Min. Nocturna 18 ºC Profundidad del pelo 0. 6 Cm Grosor de la capa 1 Delgada Cubierta en el pelo 1 No lodo Animales sofocados 1 No Actividad Pastoreo intensivo
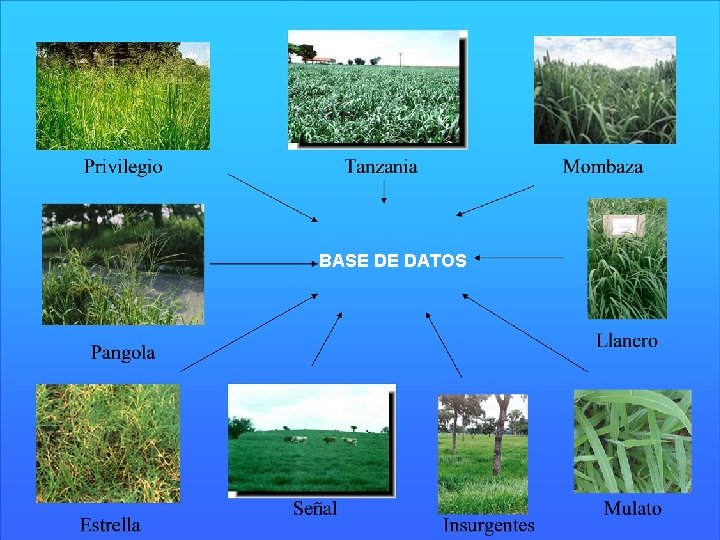
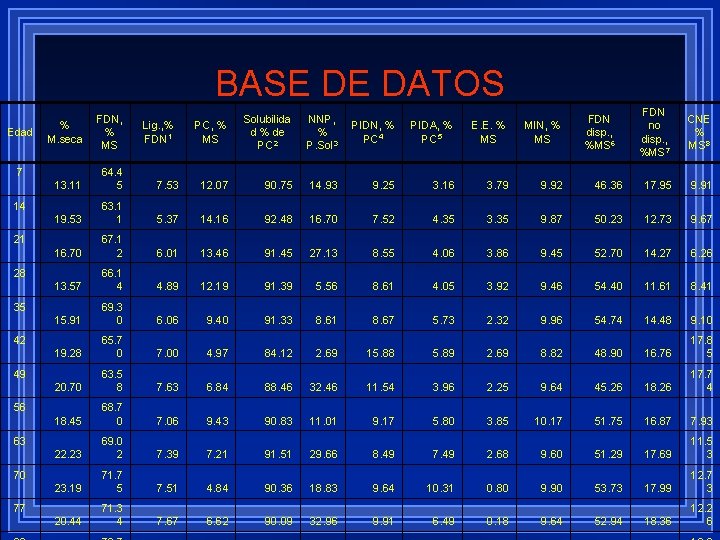
BASE DE DATOS
BASE DE DATOS Edad % M. seca 7 FDN, % MS Lig. , % FDN 1 PC, % MS Solubilida d % de PC 2 NNP, % P. Sol 3 PIDN, % PC 4 PIDA, % PC 5 E. E. % MS MIN, % MS FDN disp. , %MS 6 FDN no disp. , %MS 7 CNE % MS 8 13. 11 64. 4 5 7. 53 12. 07 90. 75 14. 93 9. 25 3. 16 3. 79 9. 92 46. 36 17. 95 9. 91 19. 53 63. 1 1 5. 37 14. 16 92. 48 16. 70 7. 52 4. 35 3. 35 9. 87 50. 23 12. 73 9. 67 16. 70 67. 1 2 6. 01 13. 46 91. 45 27. 13 8. 55 4. 06 3. 86 9. 45 52. 70 14. 27 6. 26 13. 57 66. 1 4 4. 89 12. 19 91. 39 5. 56 8. 61 4. 05 3. 92 9. 46 54. 40 11. 61 8. 41 15. 91 69. 3 0 6. 06 9. 40 91. 33 8. 61 8. 67 5. 73 2. 32 9. 96 54. 74 14. 48 9. 10 19. 28 65. 7 0 7. 00 4. 97 84. 12 2. 69 15. 88 5. 89 2. 69 8. 82 48. 90 16. 76 17. 8 5 20. 70 63. 5 8 7. 63 6. 84 88. 46 32. 46 11. 54 3. 96 2. 25 9. 64 45. 26 18. 26 17. 7 4 18. 45 68. 7 0 7. 06 9. 43 90. 83 11. 01 9. 17 5. 80 3. 85 10. 17 51. 75 16. 87 7. 93 22. 23 69. 0 2 7. 39 7. 21 91. 51 29. 66 8. 49 7. 49 2. 68 9. 60 51. 29 17. 69 11. 5 3 23. 19 71. 7 5 7. 51 4. 84 90. 36 18. 83 9. 64 10. 31 0. 80 9. 90 53. 73 17. 99 12. 7 3 20. 44 71. 3 4 7. 67 6. 62 90. 09 32. 96 9. 91 6. 49 0. 18 9. 64 52. 94 18. 36 12. 2 6 14 21 28 35 42 49 56 63 70 77
Digestion Rate of NDF-N in Tropical Forages F. I. Juarez, A. N. Pell, and J. B. Robertson. Cornell University INIFAP
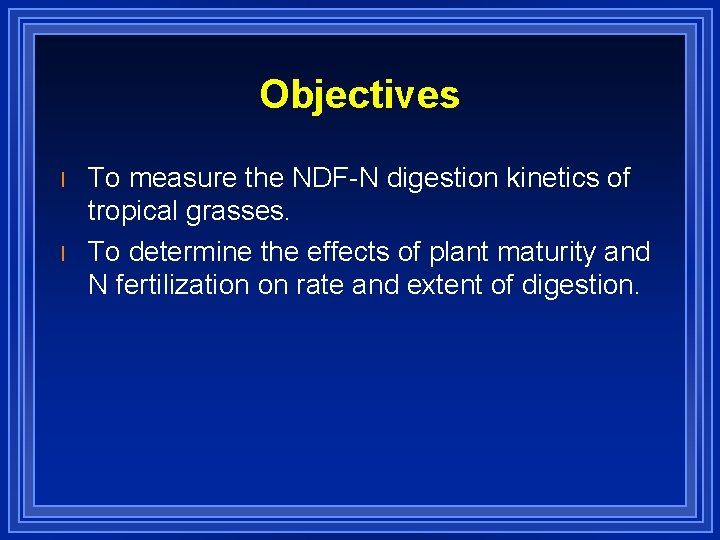
Objectives l l To measure the NDF-N digestion kinetics of tropical grasses. To determine the effects of plant maturity and N fertilization on rate and extent of digestion.
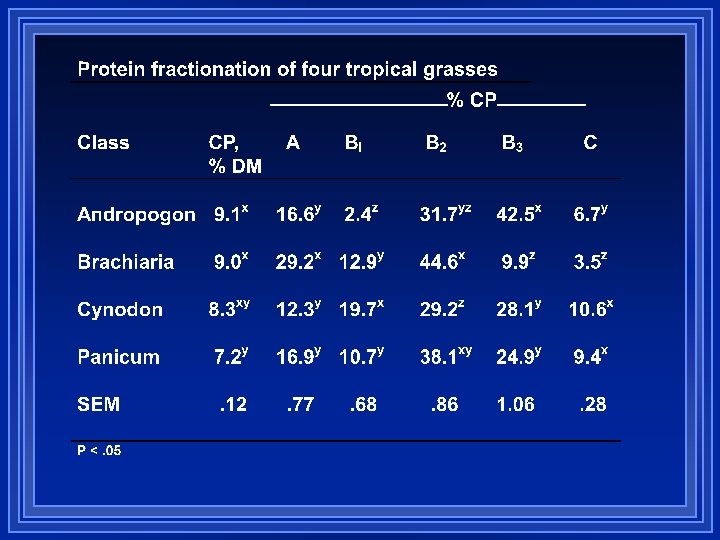
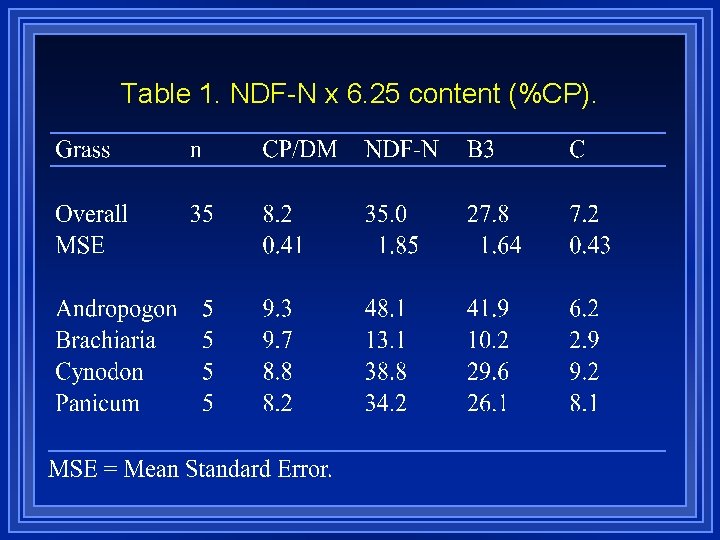
Table 1. NDF-N x 6. 25 content (%CP).
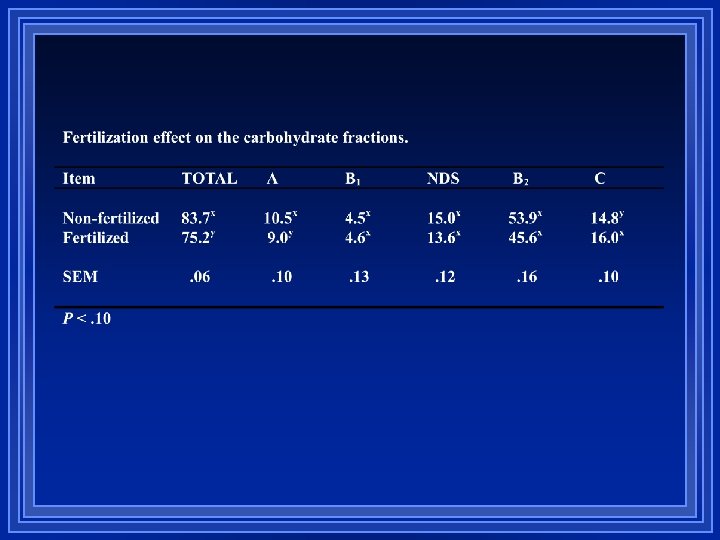
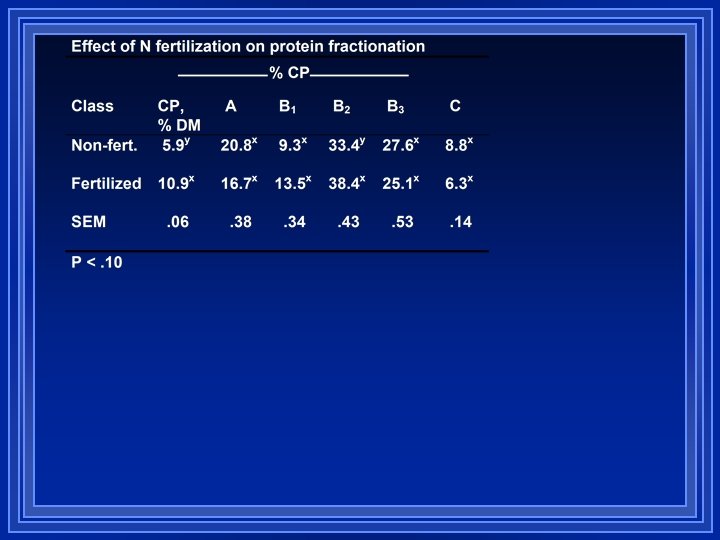
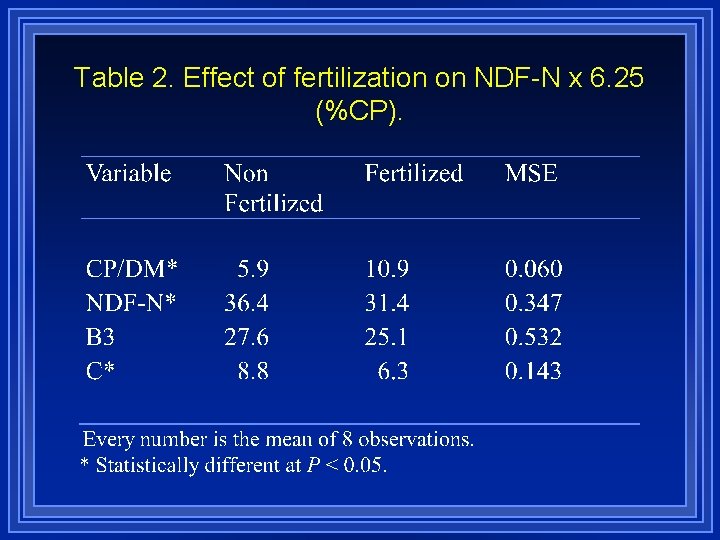
Table 2. Effect of fertilization on NDF-N x 6. 25 (%CP).
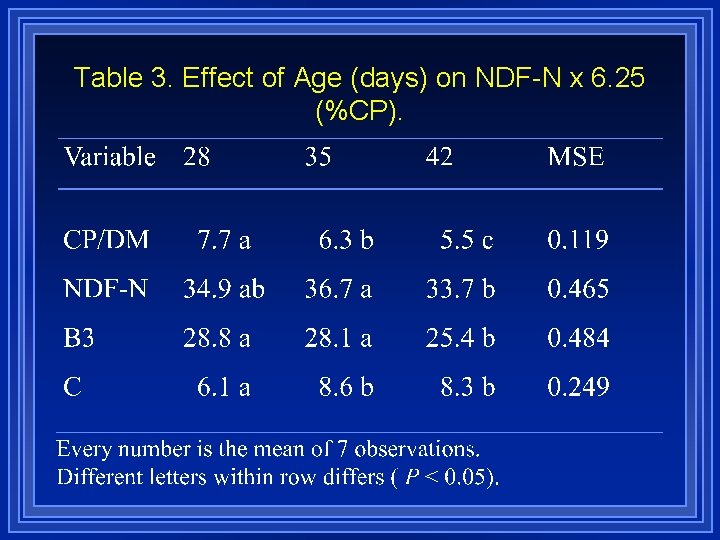
Table 3. Effect of Age (days) on NDF-N x 6. 25 (%CP).
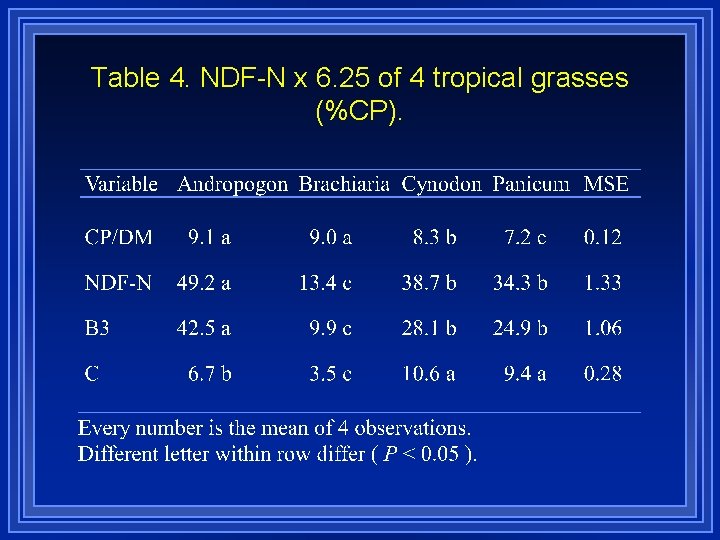
Table 4. NDF-N x 6. 25 of 4 tropical grasses (%CP).
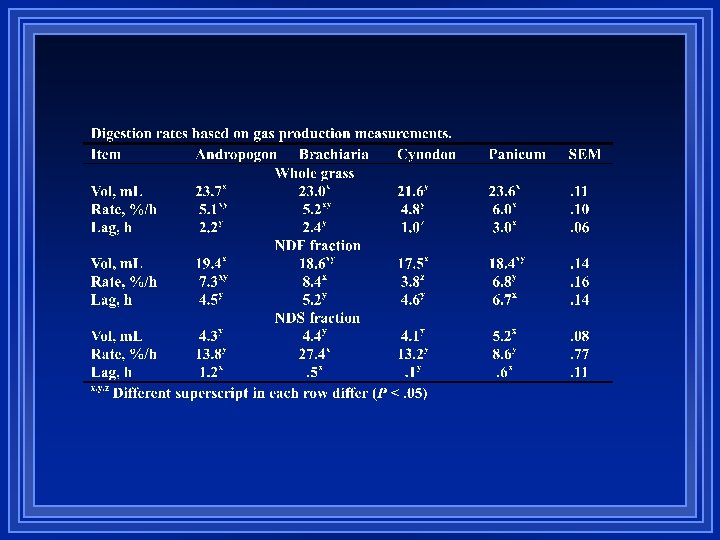
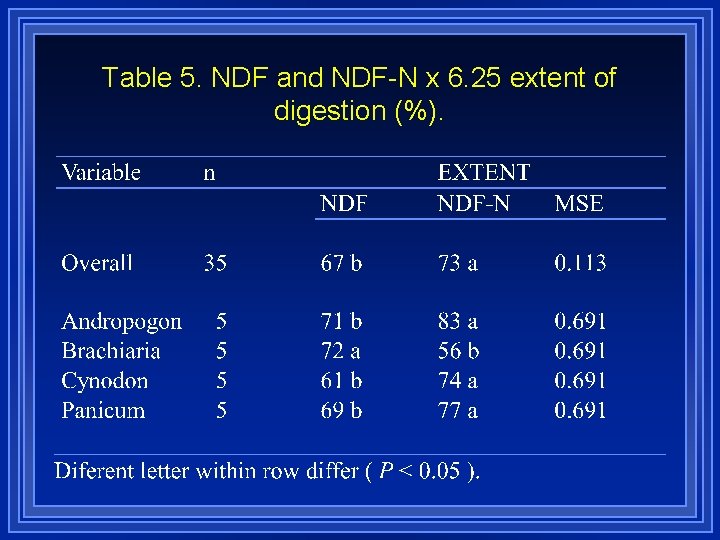
Table 5. NDF and NDF-N x 6. 25 extent of digestion (%).
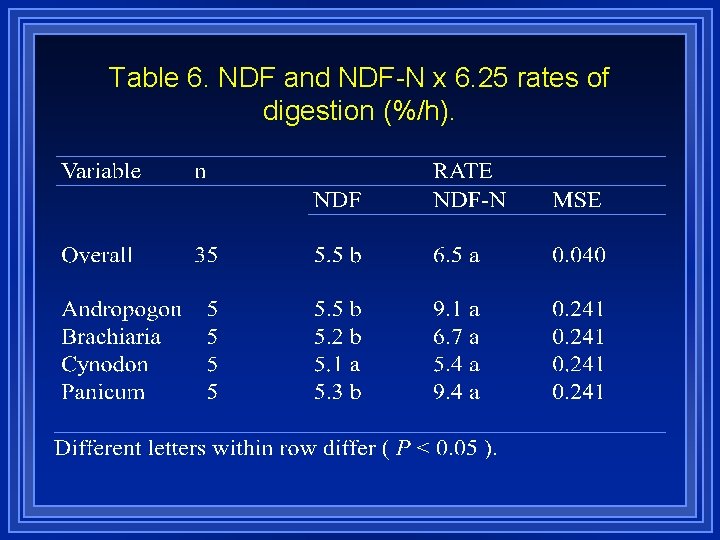
Table 6. NDF and NDF-N x 6. 25 rates of digestion (%/h).
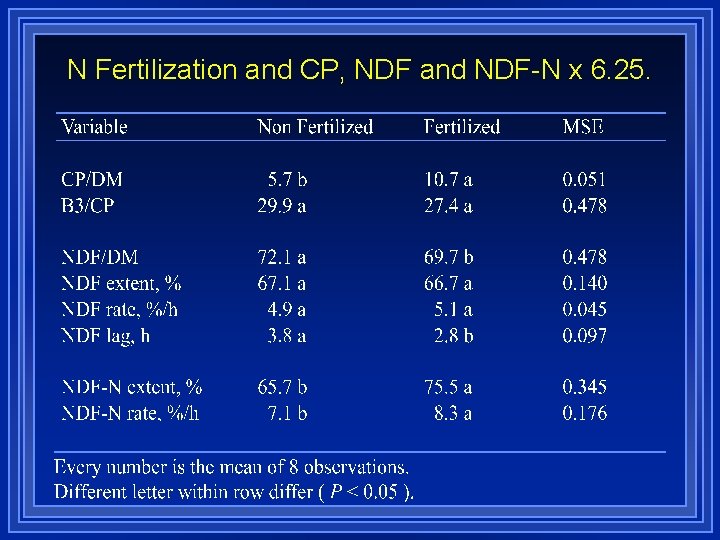
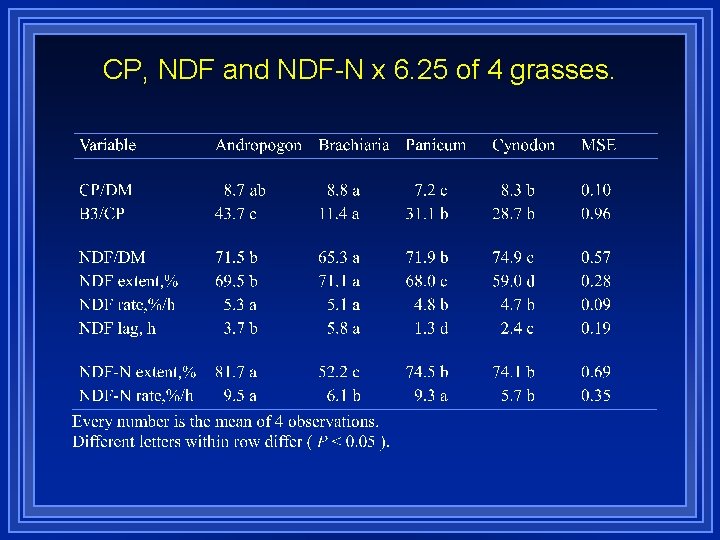
N Fertilization and CP, NDF and NDF-N x 6. 25.
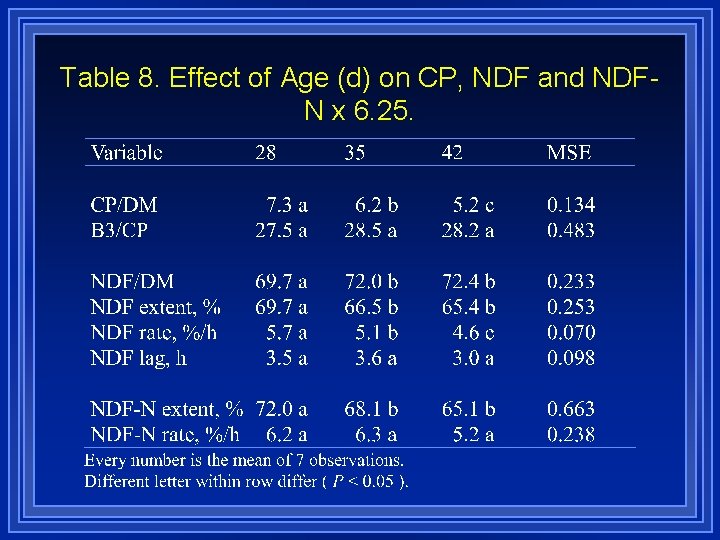
Table 8. Effect of Age (d) on CP, NDF and NDFN x 6. 25.
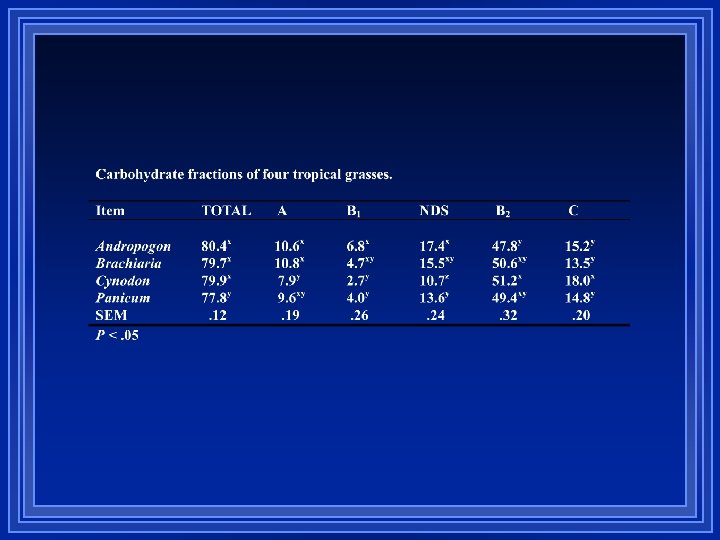
CP, NDF and NDF-N x 6. 25 of 4 grasses.
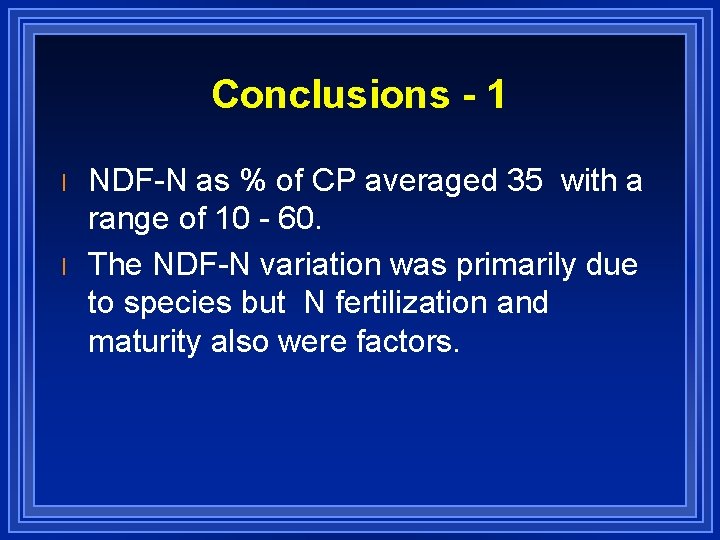
Conclusions - 1 l l NDF-N as % of CP averaged 35 with a range of 10 - 60. The NDF-N variation was primarily due to species but N fertilization and maturity also were factors.
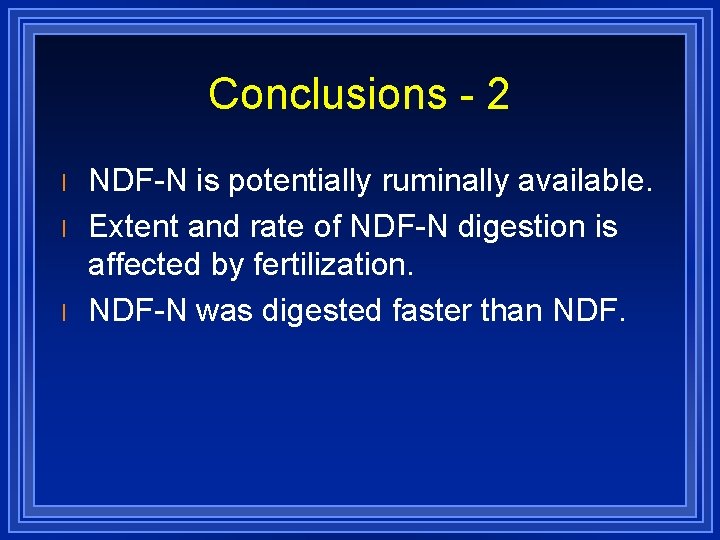
Conclusions - 2 l l l NDF-N is potentially ruminally available. Extent and rate of NDF-N digestion is affected by fertilization. NDF-N was digested faster than NDF.
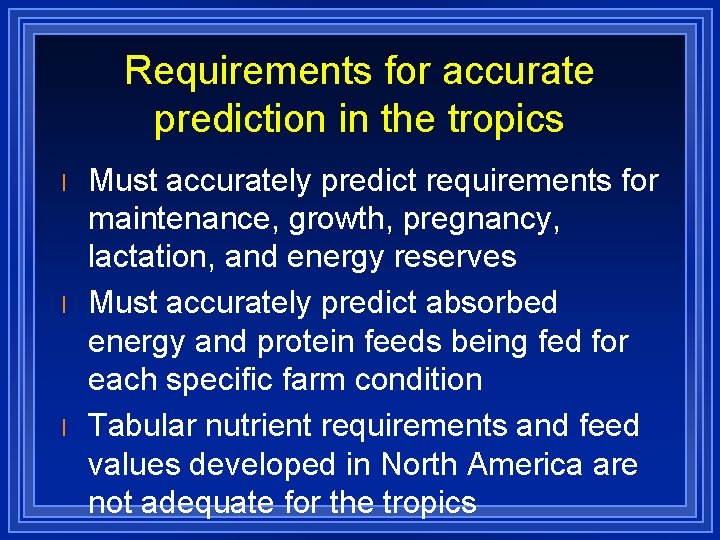
Requirements for accurate prediction in the tropics l l l Must accurately predict requirements for maintenance, growth, pregnancy, lactation, and energy reserves Must accurately predict absorbed energy and protein feeds being fed for each specific farm condition Tabular nutrient requirements and feed values developed in North America are not adequate for the tropics
CNCPS for feed management l Develop a model to predict requirements and feed biological values on each farm l Use the model to identify the factors that are first limiting performance – Energy – Protein – Amino acids
CNCPS components for the tropics l l Breed adjustments for maintenance, growth, and lactation Tropical forages CHO and Protein fractions and digestion rates Dry matter intake equations Ruminal adjustment for N and branched -chain amino acids deficiencies
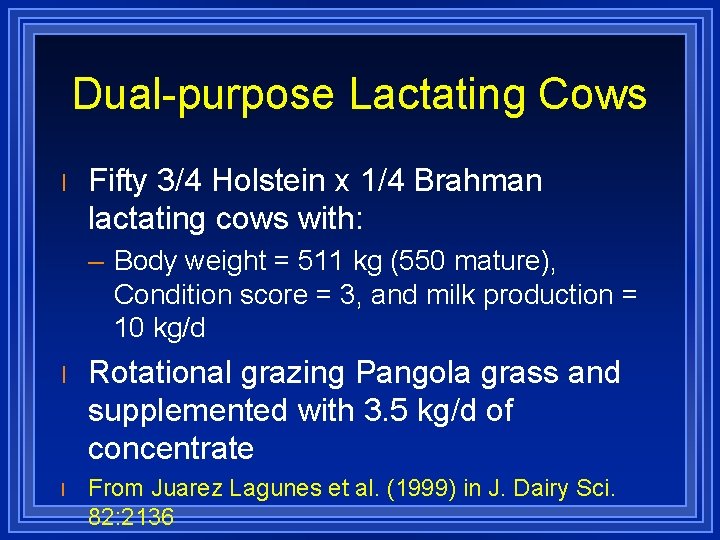
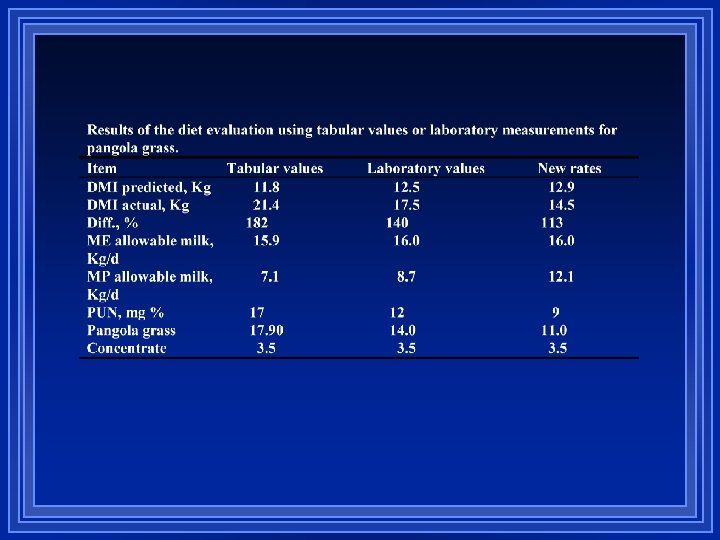
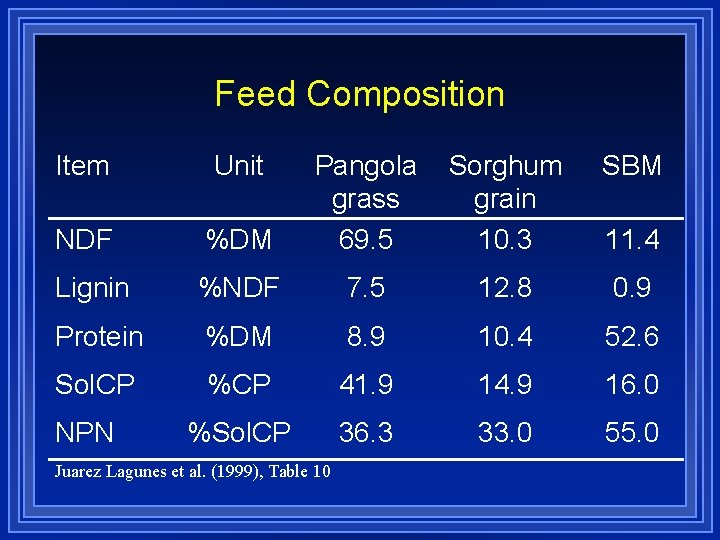
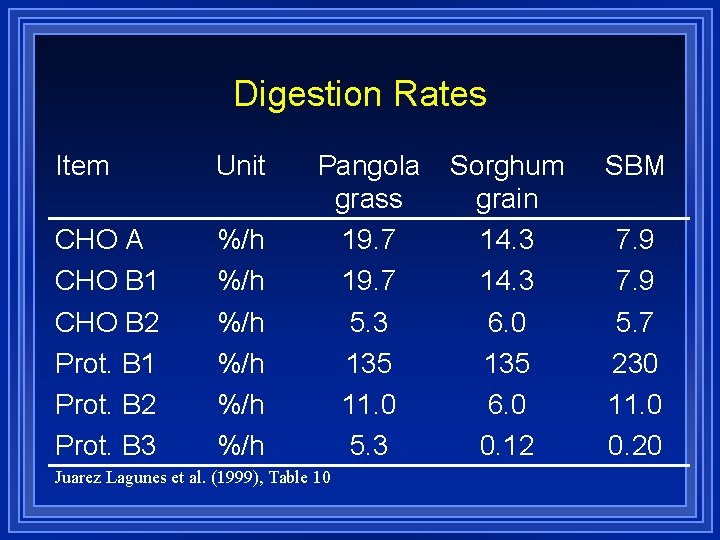
Dual-purpose Lactating Cows l Fifty 3/4 Holstein x 1/4 Brahman lactating cows with: – Body weight = 511 kg (550 mature), Condition score = 3, and milk production = 10 kg/d l Rotational grazing Pangola grass and supplemented with 3. 5 kg/d of concentrate l From Juarez Lagunes et al. (1999) in J. Dairy Sci. 82: 2136
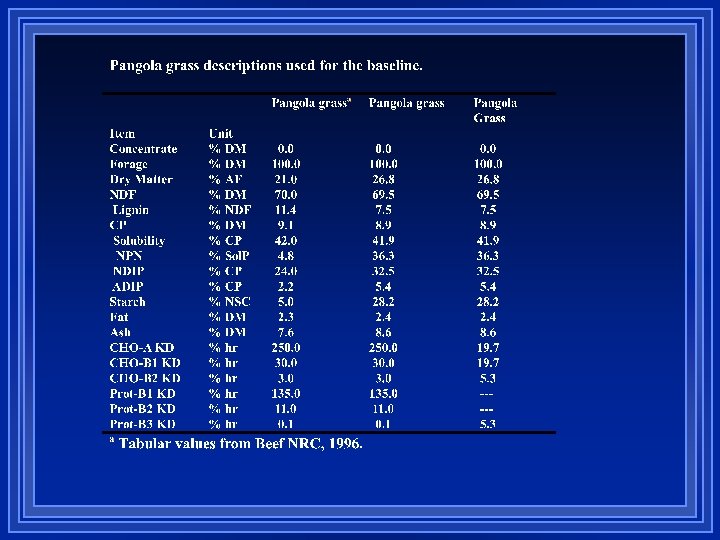
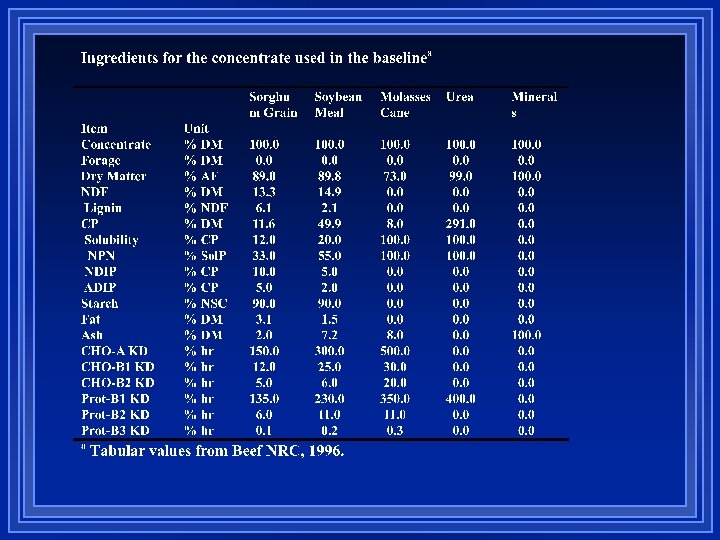
Feed Composition Item Unit Sorghum grain 10. 3 SBM %DM Pangola grass 69. 5 NDF Lignin %NDF 7. 5 12. 8 0. 9 Protein %DM 8. 9 10. 4 52. 6 Sol. CP %CP 41. 9 14. 9 16. 0 %Sol. CP 36. 3 33. 0 55. 0 NPN Juarez Lagunes et al. (1999), Table 10 11. 4
Digestion Rates Item Unit CHO A CHO B 1 CHO B 2 Prot. B 1 Prot. B 2 Prot. B 3 %/h %/h %/h Pangola grass 19. 7 5. 3 135 11. 0 5. 3 Juarez Lagunes et al. (1999), Table 10 Sorghum grain 14. 3 6. 0 135 6. 0 0. 12 SBM 7. 9 5. 7 230 11. 0 0. 20
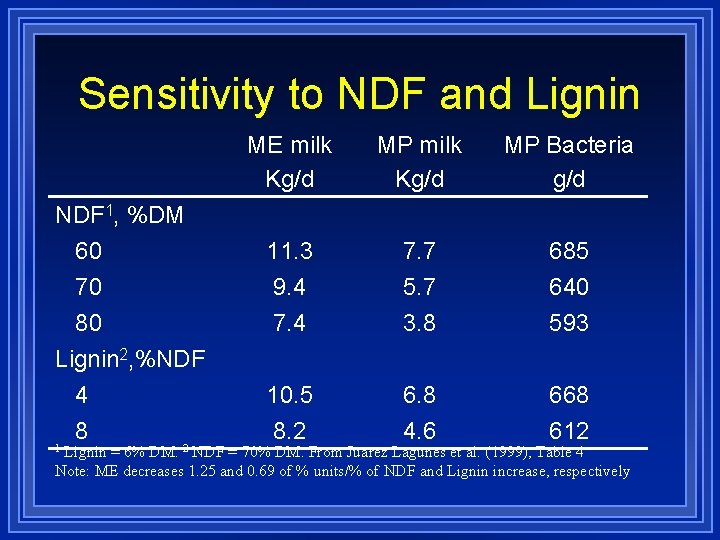
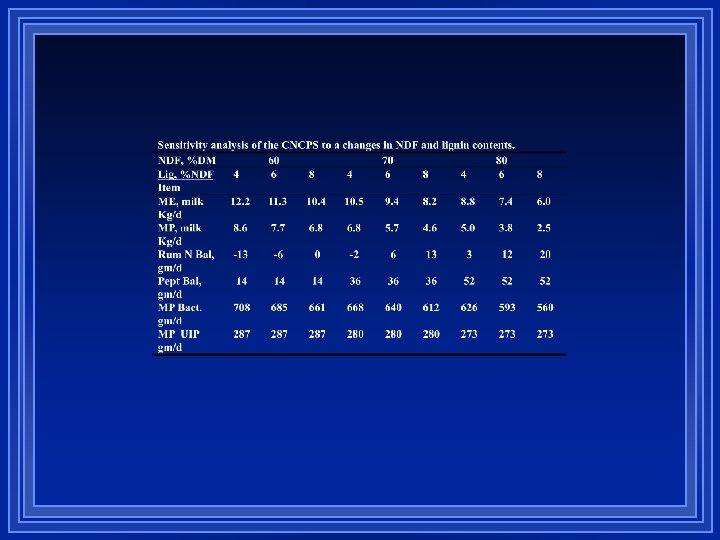
Sensitivity to NDF and Lignin NDF 1, %DM 60 70 80 Lignin 2, %NDF 4 8 ME milk Kg/d MP Bacteria g/d 11. 3 7. 7 685 9. 4 7. 4 5. 7 3. 8 640 593 10. 5 8. 2 6. 8 4. 6 668 612 Lignin = 6% DM. 2 NDF = 70% DM. From Juarez Lagunes et al. (1999), Table 4 Note: ME decreases 1. 25 and 0. 69 of % units/% of NDF and Lignin increase, respectively 1
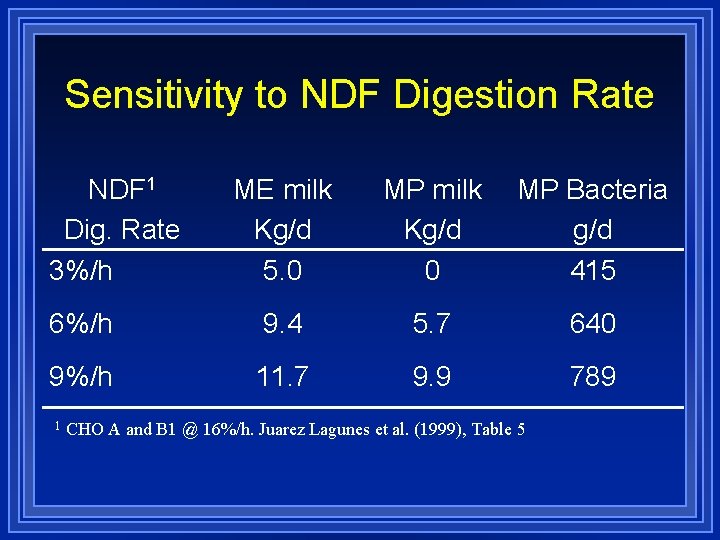
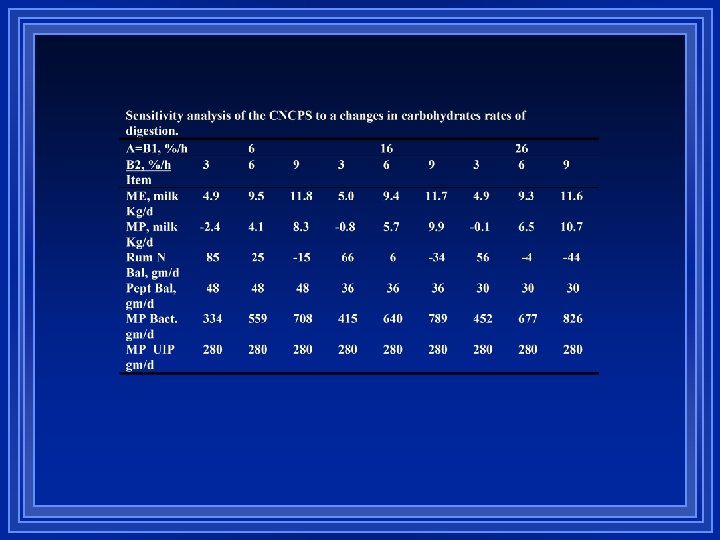
Sensitivity to NDF Digestion Rate NDF 1 Dig. Rate 3%/h ME milk Kg/d 5. 0 MP milk Kg/d 0 MP Bacteria g/d 415 6%/h 9. 4 5. 7 640 9%/h 11. 7 9. 9 789 1 CHO A and B 1 @ 16%/h. Juarez Lagunes et al. (1999), Table 5