Evaluating cell lines as tumor models by comparison

Evaluating cell lines as tumor models by comparison of genomic profiles Domcke, S. et al. Nat. Commun 4: 2126

Motivation Ø Problem: Genomic differences between cancer cell lines and tissue samples Ø TCGA and CCLE provide molecular profiles for tumor samples and cell lines Ø Compared high-grade serous ovarian cancer (HGSOC) to genomic profiles to identify suitable cell lines for in vitro models

Ovarian Cancer Ø Over 100, 000 women die of ovarian cancer each year Ø 5 th leading cause of cancer death Ø Divided into 4 major histological subtypes: ØSerous (study’s focus) ØEndometrioid ØClear Cell ØMucinous carcinoma

Ø Common cell line models for ovarian cancer and HGSOC are: SK-OV-3, A 2780, OVCAR-3, CAOV 3 and IGROV 1 Ø Need for well-characterized cell line models for cell types Ø Found differences between most common models and majority of HGSOC samples
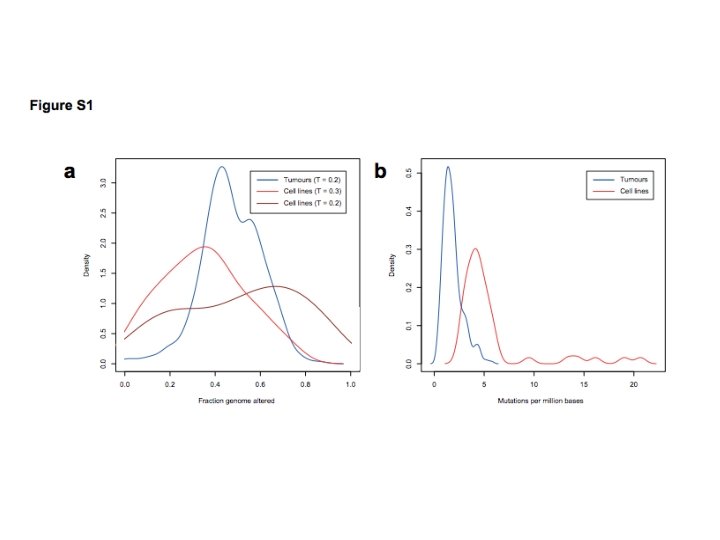

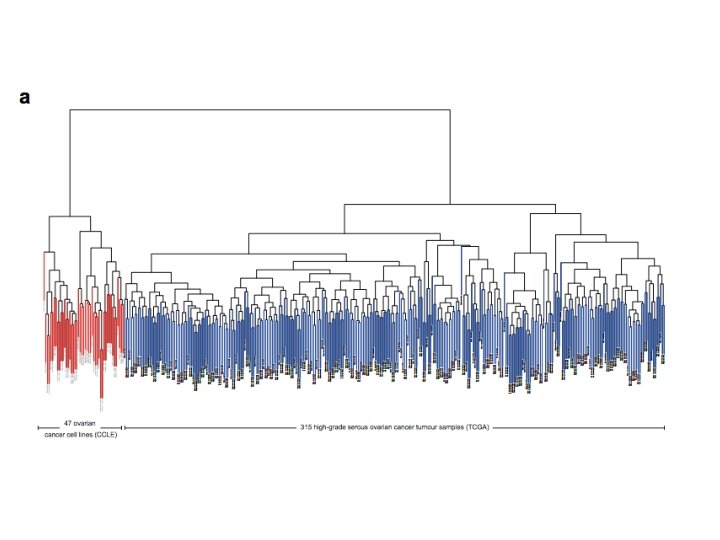
Ø Analyzed 316 HGSOC tumor samples from TCGA and 47 ovarian cancer cell lines from CCLE Ø DNA copy-number, mutation and m. RNA expression data Ø Fraction genome altered (FGA): CN=log 2(sample intensity/reference intensity) L(i) is length of segment i T is threshold value of Cni above which segments are altered - T= 0. 2 for TCGA samples - T=0. 3 for CCLE cell lines


Suitability of HGSOC Models S = A + B – 2×C – D/7 A = Correlation with mean CNA of tumors B = 1 for cell lines with TP 53 mutation or else 0 C = 1 for hypermutated cell line or else 0 D = # of genes mutated in 7 “non-HGSOC” genes


Future Directions • Drug response profiles using accurate cell line models with known alterations for patient selection in clinical trials • Perform preclinical drug screens for moreinformed patient therapy • Any others?
- Slides: 14