Evaluating Alternative Index Designs for the Texas Manufacturing


- Slides: 17
Evaluating Alternative Index Designs for the Texas Manufacturing Outlook Survey Third Joint European Commission-OECD Workshop on International Development of Business and Consumer Tendency Surveys Brussels, 12 -13 November 2007 By Fiona Sigalla, Frank Berger, Tom Fomby, Keith Phillips and Mine Yücel Federal Reserve Bank of Dallas The views expressed are the authors and do not necessarily represent those of the Federal Reserve Bank of Dallas or the Federal Reserve System
Weighting of Business Tendency Surveys Countries using firm size and industry weighting Belgium Finland Hong Kong Portugal Spain Czech Republic France Italy Slovakia Switzerland Denmark Germany Netherlands South Africa United Kingdom Countries using unweighted indexes Austria China P. R. Hungary Korea United States U. S. Regional Federal Reserve Banks
The Unweighted Index Gives equal weight to all responding firms. – Responses from large firms and small firms contribute equally to the index. Can be distorted by participation of firms. – Industries with numerous small firms can be overrepresented compared to industries with a few large firms. – Varies with month-to-month response rate of the survey panel.
The OECD Weighted Index Firm weighting – Firms are weighted based on size • assigning more weight to big firms than small firms – Sampling weighting • corrects for firms entering and exiting the sample • corrects for sample not being representative of population Industry weighting – Industries are weighted based on value added
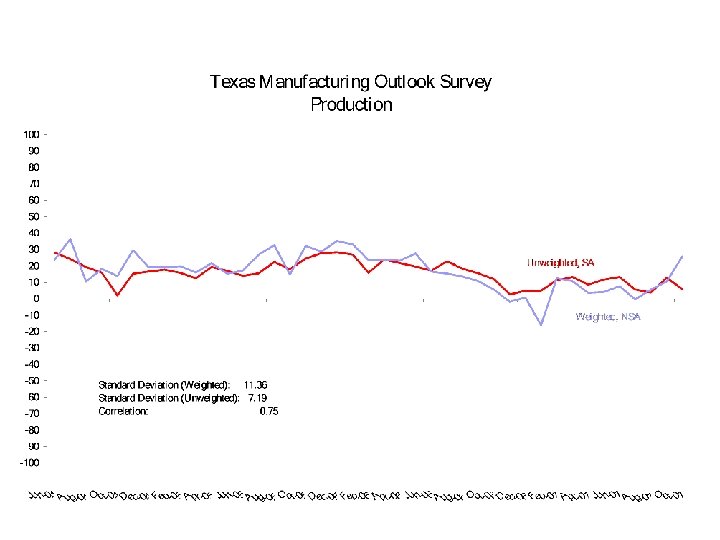
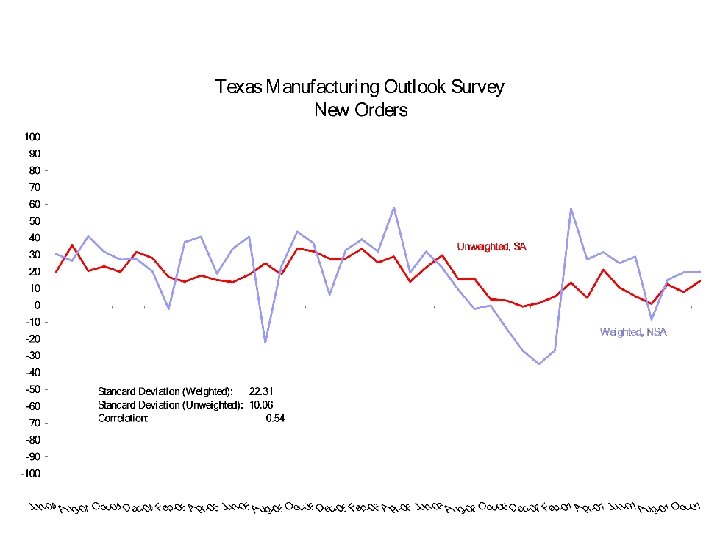
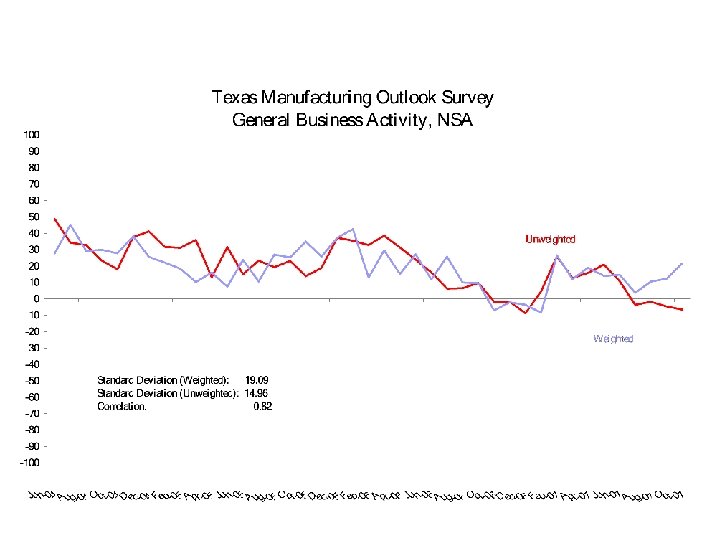
Comparison of Weighted and Unweighted indexes
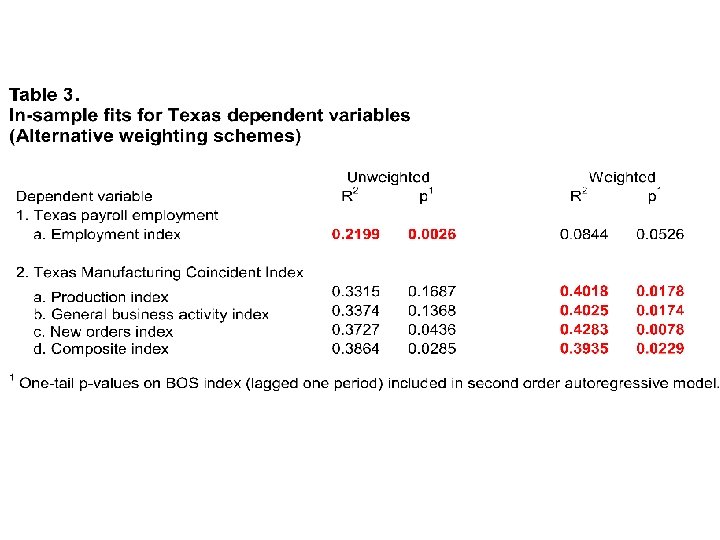
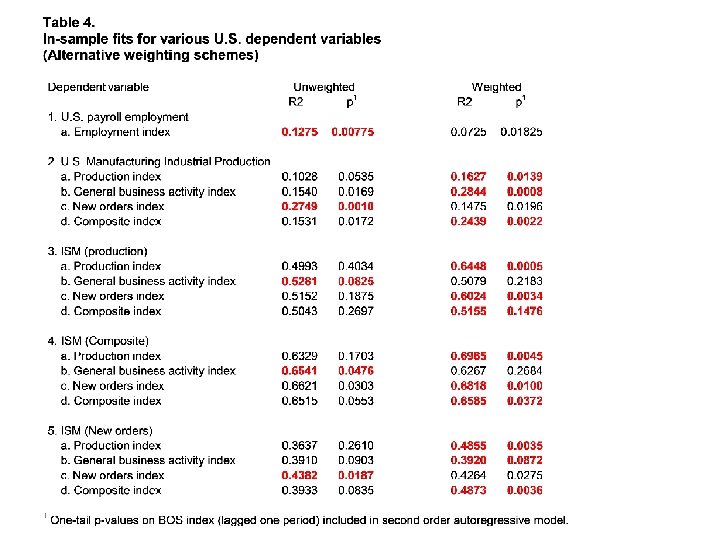
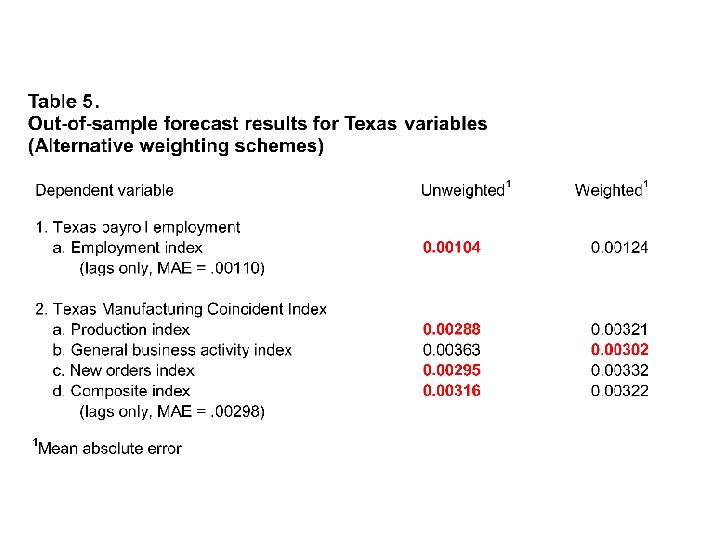
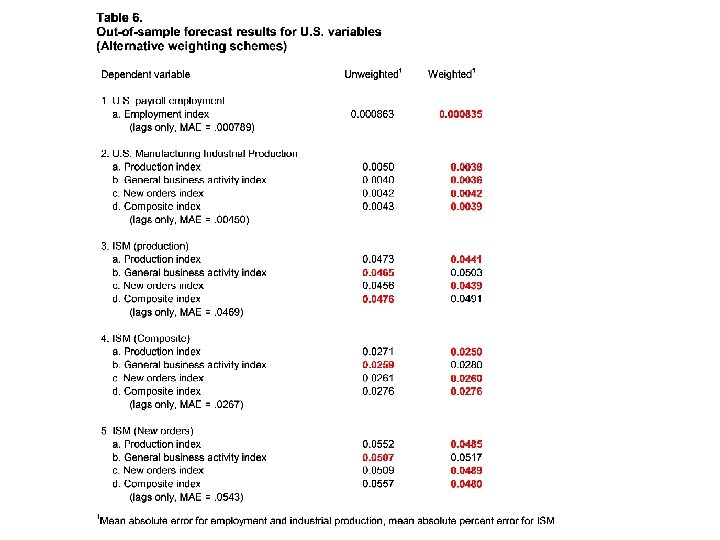
In Search of a Good Dependent Variable • Texas variables – Texas manufacturing employment – Texas manufacturing coincident index • U. S. variables – U. S. manufacturing employment – U. S. industrial production index – Institute of Supply Management Manufacturing Indexes
Evaluating Alternative Weighting Schemes • Seasonally adjust survey variables as necessary. • Most dependent variables are in percent changes. • ISM indexes are levels because they are stationary. • Employment used instead of value added for industry weights on employment variable. • OLS with one lag of the dependent variable.
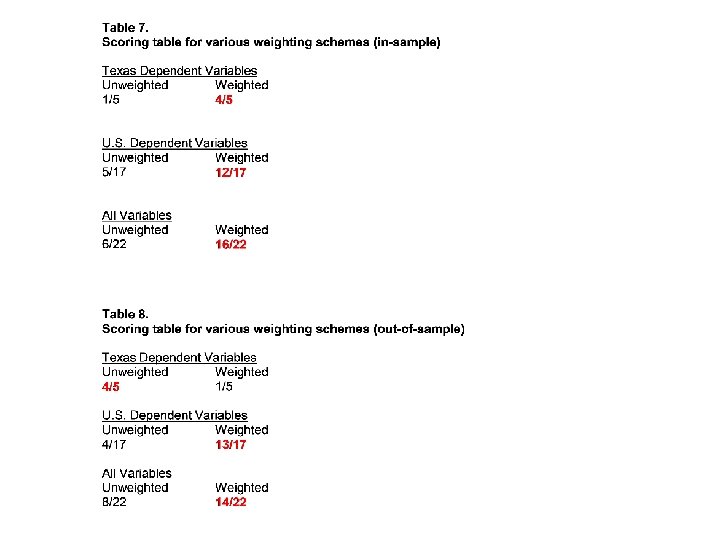
Conclusions • Many unweighted and most weighted indexes have significant explanatory power for some important regional and national variables. • Both regional and national indicators: – weighted indexes were superior most of the time. – unweighted seemed to work best for employment and out of sample Texas variables.
This research would benefit from testing a longer time series, such as data from an OECD country. Fiona. Sigalla@dal. frb. org