Evaluate the rhythm Sequential Approach to 2 A


 The P wave represents atrial activation b) the PR interval is")


 axis deviation -300")
 Lead I Lead a. VF Positive Left")


 Acute transmural injury - as in")


 or LVH (left precordial leads,")


 ST elevation and tall T waves b) QS deflections")

 ST segment elevation in leads V 4 R")


 Q waves in leads")


 Convex downward ST segment depression only (common) b) Convex upwards")


 A P C • an abnormal P wave • as")


 is thought to be due")


 P waves follow the QRS b) QRS regular with a normal duration S")


 nodal reentry AV N reent ry Schema for typical atrioventricular")
 Onset")
 Heart rate between 120/min and 220/min with minute to minute variations")


 A PR interval of <0. 12")


 Antidromic AV")


 Wide QRS -")

 Abnormal and wide QRS complexes with secondary ST segment and T")


 P waves are not conducted to the ventricles because")


 a) Displacement of the mean QRS axis in the frontal")
 may be difficult to")

 QRS duration > 0. 12 secs b) Absence of")
 QRS duration > 0. 12 secs")
 Prolongation of QRS > 0. 12 secs b) Secondary")


 LVH only B) LVH with Strain pattern")

 P waves >2. 5 mm in II, III, a.")
 ST segment depression b) Decreased amplitude of T wave which may")

 Two sets of P waves b) RBBB – complete")
 Prolongation of QTc interval secondary to an increased duration of the ST")
 ST segment depression, b) Decreased T wave amplitude c) Prominent U wave")


 a) Large , upright or deeply inverted T waves")
 Diffuse ST segment elevation and T wave inversion in all leads")
 Uniform Reduction of QRS voltage in all leads b)")


- Slides: 138
Evaluate the rhythm. Sequential Approach to 2. A Gain familiarity with the "normal" EKG’s: 1. Reading A Sequential Approach to Reading EKG’s: It is best to evaluate rhythm on a rhythm strip. If this is not available, look at "pieces" of the rhythm in each lead (II and V 1 generally have prominent P waves). Determine if the rhythm is regular or irregular. For irregular rhythms determine if the rhythm is completely irregular ("irregularly irregular") or if the irregularity is caused by additional or dropped complexes superimposed on an underlying regular rhythm. For all rhythms, look for and evaluate P waves in the underlying rhythm first, and then in relation to any additional or dropped beats Look at QRS complex morphology, first in the underlying rhythm and then in any additional beats. At each step consider the two main questions of rhythm interpretation: where has impulse formation occurred and how has conduction proceeded.
A Sequential Approach to Reading EKG’s: 3. Calculate rate and axis. Measure intervals. Consider the diagnostic possibilities suggested by abnormalities found, but do not make final diagnoses yet (except for left bundle branch block, which makes further interpretation impossible). 4. Evaluate each P wave, QRS, ST segment, T wave and U wave in the following lead order: I and a. VL then II, III, and a. VF then V 1, V 2, V 3, V 4, V 5 and V 6 (beginning with R wave progression), localizing and grouping all abnormalities. 5. Arrive at final diagnoses by critically evaluating each abnormality in relationship to all others and any available clinical data.
Lead placement
Lead placement
Orientation of the 12 Lead ECG: It is important to remember that the 12 -lead ECG provides spatial information about the heart's electrical activity in 3 approximately orthogonal directions: Right Superior Anterior Left Inferior Posterior Each of the 12 leads represents a particular orientation in space, as indicated below (RA = right arm; LA = left arm, LF = left foot) Bipolar limb leads (frontal plane): Lead I: RA (-) to LA (+) (Right Left, or lateral) Lead II: RA (-) to LF (+) (Superior Inferior) Lead III: LA (-) to LF (+) (Superior Inferior) Augmented unipolar limb leads (frontal plane): Lead a. VR: RA (+) to [LA & LF] (-) (Rightward) Lead a. VL: LA (+) to [RA & LF] (-) (Leftward) Lead a. VF: LF (+) to [RA & LA] (-) (Inferior) Unipolar (+) chest leads (horizontal plane): Leads V 1, V 2, V 3: (Posterior Anterior) Leads V 4, V 5, V 6: (Right Left, or lateral)
Standard Limb Leads
Right Sided Leads
normal ECG ST segment The normal ECG has the following features: • P wave - due to atrial depolarization • PR interval (due to delayed conduction through the AV node) 0. 12 - 0. 20 seconds • QRS complex - due to ventricular depolarization • T wave due to ventricular repolarization
normal ECG a) The P wave represents atrial activation b) the PR interval is the time from onset of atrial activation to onset of ventricular activation. (from the sinus node to the His Bundle purkinje fibers) c) The QRS complex represents electrical ventricular activation; the QRS duration is the duration of ventricular activation. d) The ST-T wave represents ventricular repolarization. e) The QT interval is the duration of ventricular activation and recovery. f) The U wave probably represents "after-depolarization" in the ventricles.
Normal Sinus Rhythm A normal sinus rhythm one would expect the following: • an ECG with P waves • a PR interval of 0. 12 - 0. 20 seconds • a regular interval between each QRS complex (R-R interval) of 0. 60 - 1. 0 secs • a distinct a wave in the CVP trace due to atrial contraction • there may be minor regular variation in heart rate and pulse pressure associated with respiration (sinus arrhythmia)
Ps in I, II and a. VF are always upright and always inverted in a. VR Normal EKG Ps in V 1 and V 2 are Diphasic, but never negative in V 2 T wave: Always upright in I & II and inverted in a. VR. Usually upright in a. VF and Q Wave: Amplitude of Q waves usually < 4 mm in all leads except in III where it may reach 5 mm and the depth is < 25% of the R wave in all leads except III. inverted or upright in III & a. VL. T wave is always upright in V 5 -6. Tallest in II, V 2 -3. P waves duration varies between 0. 08 – 0. 11 secs with an amplitude of 0. 25 m. V and P PR Interval is measured form the beginning of the P wave to the beginning of the QRS R wave: Measures about 15 mm in lead I, 10 mm in a. VL and can be about 19 mm in II, <6 mm in all limb leads. , but not less than 0. 5 mm in I & II wave axis is directed Inferiorly and leftward (00 – 750) with a normal duration of 0. 12 – 0. 20 seconds. Lead II is usually used to measure PR III & a. VF. interval. QT interval: The duration of the ventricular electrical systole. Normal QTc is about P waves are always upright in leads I and II, always inverted in a. VR, diphasic in III, S wave: Most prominent in a. VR about 16 mm, 9 mm in III & a. VL, and <5 mm in I, III 0. 39 secs in males and 0. 41 secs in females. QTc > 0. 44 secs is ABNORMAL. a. VL, and V Ventricular activation middle third of Left IV septum right septal surface RV and a. VF. 1, V 2. A negative component of more than one small square is considered abnormal. leftward apex free walls of both ventricles basal portion of septum and the [left click once] ST : 1 mm elevation may be seen especially in the inferior leads, but ST depression is U wave: Represent after potentials of ventricular myocardium. posterobasal portion of the free wall of LV are the last parts to be activated. pathologic in any lead as long as the axis is directed inferiorly and leftward.
AXIS Normal axis Left axis deviation Right axis deviation Indeterminate (extreme) axis deviation -300 to 1200 -300 to -900 1200 to 1800 -900 to 1800
AXIS Normal axis (-30 to +90 degrees) Lead I Lead a. VF Positive Left axis deviation (-30 to -90) check lead II. To be true left axis deviation, it should also be down in lead II. If the QRS is upright in Positive Neg II, the axis is still normal (0 to -30). . Right axis deviation Neg Positive Indeterminate axis (-90 to -180) Neg Differential Diagnosis Left axis deviation LVH, left anterior fasicular block, inferior wall MI Right axis deviation RVH, left posterior fascicular block, lateral wall MI
NORMAL AXIS
LEFT AXIS DEVIATION If the axis is - 300 Biphasic in lead II, and negative in a. VF If the axis is <300 predominantly negative in lead II and a. VF
RIGHT AXIS DEVIATION Normal QRS width with an axis of >1000 Predominantly positive in leads II and III, and negative in a. VL
Early Repolarization Note diffuse J-point elevation, early R wave transition, with notched downstroke of R wave in lateral precordial leads. These changes are characteristic of early repolarization as seen in this EKG of a 28 year old African-American male.
Normal variants or artifacts
ischemia
ST Segment Abnormalities
General Introduction to ST, T, and U wave abnormalities The specificity of ST-T and U wave abnormalities is provided more by the clinical circumstances in which the ECG changes are found than by the particular changes themselves. Thus the term, nonspecific ST-T wave abnormalities, is frequently used when the clinical data are not available to correlate with the ECG findings. This does not mean that the ECG changes are unimportant! It is the responsibility of the clinician providing care for the patient to ascertain the importance of the ECG findings.
Factors affecting the ST-T and U wave configuration include: Intrinsic myocardial disease (e. g. , myocarditis, ischemia, infarction, infiltrative or myopathic processes) Drugs (e. g. , digoxin, quinidine, tricyclics, and many others) Electrolyte abnormalities of potassium, magnesium, calcium Neurogenic factors (e. g. , stroke, hemorrhage, trauma, tumor, etc. ) Metabolic factors (e. g. , hypoglycemia, hyperventilation) Atrial repolarization (e. g. , at fast heart rates the atrial T wave may pull down the beginning of the ST segment) Ventricular conduction abnormalities and rhythms originating in the ventricles
“Secondary” ST-T Wave changes “Secondary" ST-T Wave changes (these are ST-T wave changes solely due to alterations in the sequence of ventricular activation) ST-T changes seen in bundle branch blocks (generally the ST-T polarity is opposite to the major or terminal deflection of the QRS) ST-T changes seen in fascicular block ST-T changes seen in nonspecific IVCD ST-T changes seen in WPW pre-excitation ST-T changes in PVCs, ventricular arrhythmias, and ventricular paced beats
"Primary" ST-T Wave Abnormalities (ST-T wave changes that are independent of changes in ventricular activation and that may be the result of global or segmental pathologic processes that affect ventricular repolarization) Drug effects (e. g. , digoxin, quinidine, etc) Electrolyte abnormalities (e. g. , hypokalemia) Ischemia, infarction, inflammation, etc Neurogenic effects (e. g. , subarachnoid hemorrhage causing long QT)
Causes of ST Elevation "ELEVATION" E - Electrolytes L - LBBB E - Early Repolarization V - Ventricular hypertrophy A - Aneurysm T - Treatment - Pericardiocentesis I - Injury (AMI, contusion) O - Osborne waves (hypothermia) N - Non-occlusive vasospasm
Differential Diagnosis of ST Segment Elevation Normal Variant “Early Repolarization” Ischemic Heart Disease Acute Pericarditis Other Causes
Normal Variant "Early Repolarization" (usually concave upwards, ending with large symmetrical, , upright T waves) "Early Repolarization": note high take off of the ST segment in leads V 4 -6. The ST elevation in V 2 -3 is generally seen in most normal ECG's. The ST elevation in V 2 -6 is concave upwards, another characteristic of this normal variant.
Ischemic Heart Disease (usually convex upwards, or straightened) Acute transmural injury - as in this acute anterior MI Persistent ST elevation after acute MI suggests ventricular aneurysm ST elevation may also be seen as a manifestation of Prinzmetal's (variant) angina (coronary artery spasm) ST elevation during exercise testing suggests extremely tight coronary artery stenosis or spasm (transmural ischemia)
Acute Pericarditis Concave upwards ST elevation in most leads except a. VR No reciprocal ST segment depression (except in a. VR) Unlike "early repolarization", T waves are usually low amplitude, and heart rate is usually increased. May see PR segment depression, a manifestation of atrial injury Other Causes: Left ventricular hypertrophy (in right precordial leads with large S-waves) Left bundle branch block (in right precordial leads with large S-waves) Advanced hyperkalemia Hypothermia (prominent J-waves or Osborne waves)
J-point is the point where S wave becomes isoelectric and joins the T wave. ST segment elevation or depression is measured 2 small boxes away from the J-point and then, up or down the isoelectric line.
Differential Diagnosis of ST Segment Depression Normal variants or artifacts: Pseudo-ST depression (wandering baseline due to poor skin- electrode contact) Physiologic J-junctional depression with sinus tachycardia (most likely due to atrial repolarization) Hyperventilation-induced ST segment depression Ischemic heart disease Nonischemic causes of ST depression
Non-ischemic causes of ST depression RVH (right precordial leads) or LVH (left precordial leads, I, a. VL) Digoxin effect on ECG Hypokalemia Mitral valve prolapse (some cases) CNS disease Secondary ST segment changes with IV conduction abnormalities (e. g. , RBBB, LBBB, WPW, etc)
Ischemic heart disease Subendocardial ischemia (exercise induced or during angina attack Non Q-wave MI “horizontal" ST depression in lead V 6 Reciprocal changes in acute Q-wave MI (e. g. , ST depression in leads I & a. VL with acute inferior MI)
Stages of Acute Q-Wave MI Ist Few Hours First 24 Hours First 72 Hours
Evolution of acute anterolateral myocardial infarction at 3 hours Tomb stoning is less prominent with the onset of T wave inversions in the anterior precordium. Reciprocal changes are resolving.
Evolution of acute anterolateral myocardial infarction at 24 hours Prominent Q waves have developed across the anterior precordium and leads I, a. VL. However, ST segment elevation persists.
Evolution of acute anterolateral myocardial infarction at 72 Hours Q wave pattern in the anterolateral leads is well established. Persistent ST segment elevation suggests complication by aneurysm or pericarditis
Acute anteroseptal myocardial infarction a) ST elevation and tall T waves b) QS deflections in V 1, V 2 and V 3 and V 4
Right sided EKG lead placement
Right ventricular infarction (Rt. sided leads) ST segment elevation in leads V 4 R and V 5 R reveals right ventricular involvement complicating the inferior infarct.
Complicated Acute inferior myocardial infarction AV dissociation Note inferior ST segment elevation as well as atrioventricular dissociation secondary to complete heart block.
Acute inferior myocardial infarction complicated by Wenkebach wenckebach Note inferior ST segment elevation and Q waves as well as progressive prolongation of the PR interval followed by a dropped beat with grouped beating.
Inferoposterior MI Tall R in V 2, R/S >1 a) Q waves in leads II, III & a. VF b) Tall R wave in lead V 2 with a duration of > 0. 04 secs and R/S ratio equal to or >1 (in patients over 30 years of age without RVH)
Postero-lateral MI The "true" posterior MI is recognized by pathologic R waves in leads V 1 -2. These are the posterior equivalent of pathologic Q waves (seen from the perspective of the anterior leads). Tall T waves in these same leads are the posterior equivalent of inverted T waves in this fully evolved MI. The loss of forces in V 6, I, a. VL suggest a lateral wall extension of this MI.
Lateral myocardial infarction ST segment elevation in leads I and a. VL associated with inferior reciprocal changes along with poor R wave progression. Note preexisting anteroseptal MI.
Subendocardial Ischemia Anterolateral ST segment depression is consistent with diffuse subendocardial ischemia vs. non-Q wave MI.
Unstable angina vs. non-Q wave myocardial infarction ST segment depression in leads V 2 through V 5 supports acute ischemic syndrome with no “Q” waves.
Non-Q Wave MI Non Q MI Recognized by evolving ST-T changes over time without the formation of pathologic Q waves (in a patient with typical chest pain symptoms and/or elevation in myocardial-specific enzymes) Although it is tempting to localize the non-Q MI by the particular leads showing ST-T changes, this is probably only valid for the ST segment elevation pattern Evolving ST-T changes may include any of the following patterns: a) Convex downward ST segment depression only (common) b) Convex upwards or straight ST segment elevation only (uncommon) c) Symmetrical T wave inversion only (common) d) Combinations of above changes
Non-Q Wave MI a) Convex downward ST segment depression only (common) b) Convex upwards or straight ST segment elevation only (uncommon) c) Symmetrical T wave inversion only (common)
The Pseudoinfarcts pseudoinfarcts These are ECG conditions that mimic myocardial infarction either by simulating pathologic Q or QS waves or mimicking the typical ST-T changes of acute MI. IHSS (may make normal septal Q waves "fatter" mimicking pathologic Q waves) LVH (may have QS pattern or poor R wave progression in leads V 1 -3) RVH (tall R waves in V 1 or V 2 may mimic true posterior MI) Complete or incomplete LBBB (QS waves or poor R wave progression in V 1 -V 3) Pneumothorax (loss of right precordial R waves) Left anterior fascicular block (may see small q-waves in anterior chest leads) Acute pericarditis (the ST segment elevation may mimic acute transmural injury) CNS disease (may mimic non-Q wave MI by causing diffuse ST-T wave changes) COPD and cor pulmonale (loss of R waves V 1 -3 and/or inferior Q waves with RAD)
Arrhythmias
How to think about arrhythmias and conduction disturbances Arrhthmia algo
p a u s e s A fully compensatory pause usually follows a premature complex, where the R - R interval produced by two sinus initiated QRS complexes on either side of the premature complex equals twice the normally conducted R - R interval
Atrial Premature Beat (APB) A P C • an abnormal P wave • as P waves are small and rather shapeless the difference in an APB is usually subtle. The one shown here is a clear example. • occurs earlier than expected • followed by a pause - but not a full compensatory pause
Premature Ventricular Complex P V C QRS complex appears bizarre usually greater than 120 msec T wave is large and opposite in direction to the QRS complex A fully compensatory pause usually follows a PVC
PVC • • Interpolated PVC • Sinus rhythm with a PVC that has no effect on the sinus rate. Although not easily seen, there is often PR prolongation due to retrograde concealed penetration into the AV node.
Ventricular Bigeminy a ventricular premature beat follows each normal beat Bi ge mi ny
QT prolongation Marked QT Prolongation • ECG rhythm strip of a 12 year old male with recurrent unexplained syncope and Long QT syndrome. ECG strip shows marked QT prolongation. • Low amplitude notched T waves are often associated with LQT type 2, associated with HERG gene mutations that cause defects in IKr.
A F i b Atrial Fibrillation Atrial fibrillation (AF) is thought to be due to multiple wavelets of conduction produced by reentry. Perpetuation of AF depends on the relative dimensions of the atria and the size of the reentrant circuit. Compared with atrial flutter, in which there is one reentrant circuit and organized atrial activity, atrial fibrillation demonstrates no organized atrial contraction. This leads to blood stasis, the formation of clots, and the possibility of embolic events. Thus, most patients with chronic atrial fibrillation are given anticoagulants to reduce the risk of embolic events such as strokes.
Atrial Fibrillation A F i b No P waves. Narrow complex QRS with irregular RR intervals. Ventricular rate is controlled in this EKG.
Atrial Fib complicating inferior MI A F i b
Preexcited QRS complex with Atrial Fibrillation W P W in Af ib • The shortest RR interval is 190 msec, suggesting a high risk pathway that may be associated with rapid rates and degeneration to ventricular fibrillation. Catheter ablation should be strongly considered in patients such as this.
A F l u t t Atrial Flutter circuit Atrial flutter is a macro reentrant circuit in the right atrium. The circuit involves conduction in a counterclockwise (or clockwise) direction from the low posterior right atrium near the tricuspid valve annulus (TA), the posteroseptal region near the coronary sinus os, the interatrial septum, the high lateral right atrium, and down the crista terminalis to the isthmus between the inferior vena cava and the TA. The region of the posterior right atrium is thought to be the slow zone of conduction in the circuit. Evidence that supports this theory are data showing that atrial flutter can be entrained with atrial pacing. Electrophysiologists have developed techniques allowing to ablate the critical regions of the circuit causing atrial flutter, thus, rendering the circuit inoperable.
Atrial Flutter A F l u t t e r “F” waves Atrial rate of 300 bpm with upright “FLUTTER” waves inferiorly. This is consistent with typical atrial flutter.
A Flutt er Atrial Flutter With 2: 1 AV Conduction Atrial flutter with 2: 1 AV block is one of the most frequently missed ECG rhythm diagnoses because the flutter waves are often hard to find. In this example two flutter waves for each QRS are best seen in lead III and V 1. The ventricular rate at 150 bpm should always prompt us to consider atrial flutter with 2: 1 conduction as a diagnostic consideration.
SVT
Supraventircular Rhythms SVT 1. Do you see any P waves? ? How do they look? Are they upright, preceding, following or buried in relation to the QRS? 2. What is the ventricular rhythm? Look at the QRS and its duration? 3. Now wonder about the AV conduction with the above information!! Are the P and QRS related with normal intervals? ? 4. Are there any unusual complexes?
SVT
a) P waves follow the QRS b) QRS regular with a normal duration S V T Supraventricular Tachycardia
S V T Supraventricular Tachycardia
Electrocardiographic patterns of narrow complex tachycardia Narro w compl ex Tachy cardia The most important clue to the mechanism of a narrow complex tachycardia is the relationship of the P wave to the QRS complex. No visible P wave often means that the P wave is buried in the QRS complex. This is usually due to typical atrio-ventricular (AV) nodal reentry. With typical AV nodal reentry, the P wave may also be located just at the start or end of the QRS complex, giving a q. Rs or Rsr′ pattern. When the P wave is located close to the previous QRS complex, it is identified as a short -RP tachycardia. This is often seen with accessory pathway–mediated tachycardia and is due to retrograde atrial activation over the accessory pathway. AVNRT—atrioventricular nodal reentry tachycardia
Electrocardiographic patterns of narrow complex tachycardia The most important clue to the mechanism of a narrow complex tachycardia is the relationship of the P wave to the QRS complex. The P wave may also be far from the previous QRS complex and are classified as a long-RP tachycardia. If the P wave is inverted, it may be the result of atypical AV node reentry, or it may be using a slowly conducting accessory pathway in the retrograde direction. AVNRT—atrioventricular nodal reentry tachycardia Na rr ow co m pl ex ta ch yc ar di a Narrow complex tachycardia
Diagram of atrioventricular (AV) nodal reentry AV N reent ry Schema for typical atrioventricular node reentrant tachycardia (AVNRT). Schema for atypical atrioventricular node reentrant tachycardia (AVNRT). Slow pathway fibers begin in or around the coronary sinus (CS) or posteriorly and travel superiorly and anteriorly to converge on the compact AV node, which is in the superior interventricular septum. Fast pathway fibers travel superior and anterior to the compact AV node.
AV nodal reentry Inverted P 150 /min A V N R T a) Onset and termination are abrupt b) Episode ia initiated almost always by a premature atrial beat with a > PR interval c) Heart rate is usually between 140 and 220/min d) P - QRS complex resemble a junctional beat with inverted P in II, III, a. VF. e) P waves may superimpose on, follow or rarely precede QRS f) QRS may be normal or wide secondary to an preexisting IVCD or secondary to an aberrant ventricular conduction.
Junctional Tachycardia a) Heart rate between 120/min and 220/min with minute to minute variations b) Normal QRS duration unless associated with aberrant conduction c) Rhythm generally regular, but may be irregular resembling A Fib or MAT d) Retrogade P wave may be seen following the QRS, but AV dissociation is common with slower rhythms
W P W Wolf Parkinson White Syndrome • The short PR interval is due to a bypass track, also known as the Kent pathway. By bypassing the AV node the PR shortens. • The delta wave represents early activation of the ventricles from the bypass tract. • The fusion QRS is the result of two activation sequences, one from the bypass tract and one from the AV node. • The ST-T changes are secondary to changes in the ventricular activation sequence.
Wolf Parkinson White Syndrome W P W
Wolf Parkinson White Syndrome W P W a) A PR interval of <0. 12 sec, with normal P wave b) Abnormally wide QRS complex with a duration of 0. 11 sec or more c) The presence of an initial slurring of the QRS complex, The delta Wave d) Secondary ST segment and T wave changes e) The frequency association of paroxysmal tachycardia
Conduction over an accessory pathway The morphology of a QRS complex in patients with an accessory pathway (AP) is an excellent example of fusion. Conduction over an AP is influenced by drugs, sympathetic states, and its location along the atrioventricular annulus. If there is no antegrade conduction, the AP may still conduct in the retrograde direction but is considered concealed, because it is not apparent on the ECG. When conduction over the AP is minimal and atrioventricular (AV) node conduction predominates, the QRS becomes a fusion of conduction over the AV node–His-Purkinje system and the AP. H-P—His Purkinje; LA—left atrium; LV—left ventricle; PVC—premature ventricular complex; RA—right atrium; RV—right ventricle.
Conduction over an accessory pathway When conduction to the ventricle over the AP predominates compared with AV nodal conduction, the QRS represents a fusion of conduction over the AV node–HPS and the AP, but the larger the portion of the ventricle activated by the AP, the wider the QRS complex appears. If ventricular activation is only over the AP, as with maximally preexcited tachycardias, it is difficult to distinguish the complex from ventricular tachycardia. H-P—His Purkinje; LA—left atrium; LV—left ventricle; PVC—premature ventricular complex; RA—right atrium; RV—right ventricle.
Wide complexd tachycardia
Differential Diagnosis of Wide-Complex Tachycardia VT SVT with aberrancy (atrial fibrillation/flutter) Antidromic AV reentry via WPW accessory pathway Atrial fibrillation, atrial flutter, atrial tachycardia, or AV nodal reentry in setting of WPW with rapid conduction down accessory pathway Bundle branch reentry
EKG Distinction of VT from SVT with Aberrancy Favors VT Favors SVT with Aberrancy Duration: RBBB: QRS > 0. 14 sec. LBBB: QRS > 0. 16 sec. < 0. 14 sec. < 0. 16 sec. Axis: QRS axis -90° to ± 180° Normal Morphology: Precordial concordance If LBBB: V 1 duration > 30 ms S wave > 70 ms S wave notched or slurred V 6: q. R or QR If RBBB: V 1: monophasic R wave q. R If triphasic, R > R 1 V 6: R < S R wave monophasic R < R 1
A-V Dissociation, Fusion, and Capture Beats in VT E F ECTOPY C FUSION CAPTURE
Wide QRS Tachycardia Narrow QRS Wide QRS - BBB (Aberrant conduction) Wide QRS - Preexcitation (Conduction via AP) Wide QRS - VT
Wide QRS Tachycardia may be of Ventricular or Supraventricular origin. The main features of this wide QRS tachycardia that differentiate between ventricular and supraventricular origin are the presence of P waves and AV dissociation.
Ventricular tachycardia a) Abnormal and wide QRS complexes with secondary ST segment and T wave changes b) A ventricular rate usually between 140 and 200 beats/min c) A regular or slightly irregular rhythm d) Abrupt onset and termination e) AV dissociation f) Capture beats g) Fusion beats
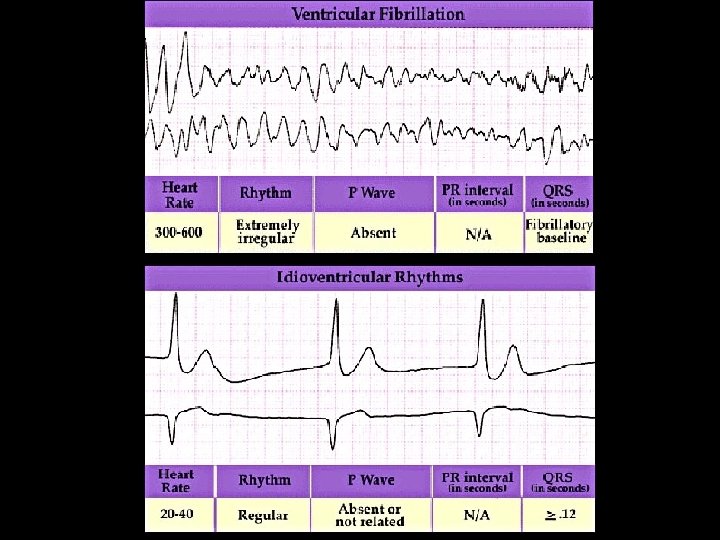
Idioventricular Rhythm
Torsade de pointes Polymorphous ventricular tachycardia • This is a form of VT where there is usually no difficulty in recognising its ventricular origin. • wide QRS complexes with multiple morphologies • changing R - R intervals • the axis seems to twist about the isoelectric line • it is important to recognise this pattern as there a number of reversible causes • heart block • hypokalaemia or hypomagnesaemia • drugs (e. g. tricyclic antidepressant overdose) • congenital long QT syndromes • other causes of long QT (e. g. IHD)
Conduction blocks
Conduction blocks
First Degree AV Block AV block is defined by PR intervals greater than 200 ms. This may be caused by : drugs, such as digoxin; excessive vagal tone ischemia or intrinsic disease in the AV junction or bundle branch system
Second Degree AV Block: Type I Mobitz The 3 rules of “classic AV Wenckebach” are: 1) decreasing RR intervals until pause 2) the pause is less than preceding 2 RR intervals 3) the RR interval after the pause is greater than the RR interval just prior to pause.
Second Degree AV Block: Type I Mobitz Progressive PR segment prolongation prior to dropped QRS complex.
Second Degree AV Block: Type II Mobitz P waves Dropped QRS wave with prolonged RR
High Grade AV block AV conduction ratio 3: 1 or higher
Complete Heart Block a) P waves are not conducted to the ventricles because of block at the AV node. The P waves are indicated below and show no relation to the QRS complexes. They 'probe' every part of the ventricular cycle but are never conducted. b) The ventricles are depolarized by a ventricular escape rhythm
Junctional Rhythm
HEMIBLOCKS
Left Anterior Hemiblock (LAH) a) Displacement of the mean QRS axis in the frontal plane to between – 300 and – 900 ( abnormal Left axis deviation ) b) A q. R complex ( or an R ) in I and a. VL, an r. S in II, III and a. VF c) Normal or slightly prolonged QRS
Left Posterior Hemiblock Left posterior fascicular block (posterior hemiblock, LPH) may be difficult to diagnose without prior ECGs. The QRS axis shifts substantially rightward. An axis of over +120, with no evidence of RVH or anterior infarction, is presumed LPH. RS in I and a. VL and a q. R in Inferior leads are suggestive.
Bundle Branch Blocks
Left Bundle Branch Block a) QRS duration > 0. 12 secs b) Absence of “Q” waves in I, V 5 & V 6 c) Presence of a broad monophasic R in leads I, V 5 & V 6 which is usually notched d) Displacement of ST segment and T wave in the opposite direction to the major deflection of the QRS e) Broad deep QS in V 1 f) Delay of onset of the intrinsicoid deflection (R peak time) in V 5 and V 6
delayed intrinsicoid deflection Left Bundle Branch Block a) QRS duration > 0. 12 secs b) Absence of “Q” waves in I, V 5 & V 6 c) Presence of a broad monophasic R in leads I, V 5 & V 6 which is usually notched d) Displacement of ST segment and T wave in the opposite direction to the major deflection of the QRS e) Broad deep QS in V 1 f) Delay of onset of the intrinsicoid deflection (R peak time) in V 5 and V 6
Right Bundle Branch Block a) Prolongation of QRS > 0. 12 secs b) Secondary R (R’) in the right precordial leads with the R’ > than the initial R (rs. R’) c) Delayed intrinsicoid deflection in the right precordial leads d) Wide S wave in leads I, V 5 & V 6
RBBB complicating Inferior Wall MI
Bifascicular block RBBB L A H Normal PR interval Intraventricular conduction block involving a RBBB with a division of the Left Bundle (either LAH or LPH) may be considered as a Bifascicular Block
Trifascicular Block A nice example of trifascicular block: Lead V 1 shows RBBB; Lead II is mostly negative with an r. S morphology suggesting left anterior fascicular block. Since Mobitz type II 2 nd degree AV block is more often located in the bundle branch system, the only location left for this block is the left posterior division of the left bundle. Therefore all three ventricular conduction pathways are diseased.
Trifascicular Block RBBB- rs. R’ in V 1, V 2 LA H q. R in I, a. VL r. S in II, II I a. VF a) PR prolongation b) RBBB with a left anterior hemiblock (LAH) or left posterior hemiblock (LPH) OR Left Bundle Branch Block
Trifascicular Block
Right Atrial Enlargement high pointed P wave ³ 2, 5 mm in II and/or a. VF high P wave in V 1 or V 2; positive part > then 1, 5 mm Frontal plane P wave vector > + 75º
Left Atrial Enlargement Left atrial vectors travel posteriorly, leftward, and inferiorly and are reflected in the mid and late portions of the P wave. Left atrial enlargement causes an increase in the duration (time) of the vectors, but does not usually result in any significant shift of the axis of the P wave. This results in a broad, notched P wave in leads I and II, frequently with accompanying slurring of the terminal portion of the P wave. The distance between the two peaks of the notched P wave is usually longer ttotal duration of greater than 0. 12 seconds. Usually, the voltage (amplitude) of the P wave increases only slightly.
Left Atrial Enlargement with RVH Left atrial enlargement and right ventricular hypertrophy have developed secondary to mitral stenosis causing fixed pulmonary hypertension RVH: Right Axis Deviation > 1100 or R/S ratio in V 1 >1 R in V 1 +S in V 5 or 6>11 mm R in V 1 >7 mm S in V 1 <2 mm r. SR’ in V 1 >10 mm
Left Ventricular Hypertrophy > 35 mm > 26 mm Limb leads: R in lead I + S in lead III > 25 mm OR R in a. VL > 11 mm OR R in a. VF >20 mm OR S in a. VR >14 Precordial leads: R in V 5 or V 6 >26 mm OR R in V 5 or V 6 + S in V 1 > 35 mm OR largest R +largest S >45 mm Supporting criteria: ST segment depression and T wave inversion in left precordial leads and in leads where QRS is upright (LV strain pattern). Ven tric ular Hy per tro phy
Left Ventricular Hypertrophy
LVH strain pattern LV Strain Pattern A) LVH only B) LVH with Strain pattern The ST segment is depressed and the T wave is inverted. Note too that the R wave has become even taller.
ute pulmonary embolus S 1 Q 3 The following often transient, changes may be seen in a large pulmonary embolus • S 1 Q 3 T 3 pattern ( a classic finding, not frequently seen ) • Prominent S wave in lead I • Q wave and inverted T wave in lead III Acute • Sinus tachycardia • T wave inversion in leads V 1 - V 3 pulmonary • Right Bundle Branch Block embolus • low amplitude deflections
Chronic Obstructive Pulmonary Disease a) P waves >2. 5 mm in II, III, a. VF with a axis of > 700 in frontal plane b) Lead I sign with an isoelectric P and a QRS amplitude < 1. 5 mm c) QRS amplitude < 5 mm in all limb leads d) R/S ratio of <1 in V 5 and V 6 e) S 1 S 2 S 3 Syndrome with an R/S ratio of <1 in leads I, II and III
Digitalis toxicity a) ST segment depression b) Decreased amplitude of T wave which may be biphasic c) Shortening of QT interval d) Increased amplitude of U wave “U”
Digitalis Effect on Rhythm and Conduction
EKG in Heart Transplant a) Two sets of P waves b) RBBB – complete or incomplete c) Left anterior or posterior hemiblock d) ST segment and T wave elevation as in pericarditis, although transient e) Bradyarrhythmias, atrial, junctional or ventricular arrhythmias
Hypocalcemia a) Prolongation of QTc interval secondary to an increased duration of the ST segment with no change in the duration of the T wave ( morphology of “T” may alter - peaked or flattening or inversion). Similar changes may be seen only with hypothermia. b) QTc is directly proportional to the ionic calcium level and seldom exceeds 140 msec. If QTc is > 140 msec, consider other associated abnormalities.
Hypokalemia a) ST segment depression, b) Decreased T wave amplitude c) Prominent U wave d) Prolongatiuon of QRS and P wave changes e) Cardiac Arrhythmias and AV blocks may occur
Hyperkalemia The following changes may be seen in hyperkalemia • wide, tall and tented T waves • wide QRS • atrial fibrillation • ventricular fibrillation
Advanced Hyperkalaemia Marked widening of the QRS duration combined with tall, peaked T waves are suggestive of advanced hyperkalemia. Note the absence of P waves, suggesting a junctional rhythm, but in hyperkalemia the atrial muscle may be paralyzed while still in sinus rhythm. The sinus impulse conducts to the AV node through internodal tracts without activating the atrial muscle.
Neurogenic T waves (Osborne waves) a) Large , upright or deeply inverted T waves b) Prominent U waves c) Prolongation of QTc interval d) Abnormal Q waves, diffuse ST elevation or depression may also be seen e) mimic ischemic changes
Acute Pericarditis a) Diffuse ST segment elevation and T wave inversion in all leads b) PR segment depression (>0. 8 mm) in all leads except a. VR and occasionally V 1. In a. VR it is always elevated. These changes are attributed to subepicardial atrial injury c) Low voltage QRS complexes & electrical alternans (with significant pericardial effusion)
Low Voltage EKG a) Uniform Reduction of QRS voltage in all leads b) ST segment and T wave changes
DEXTROCARDIA
DEXTROCARDIA
DEXTROCARDIA
Left vs Right sided leads in Dextrocardia
Demand Pacing
Limb Lead Reversal Note upright QRS complex and P wave in lead a. VR with inverted QRS in leads I and a. VL.