EUSea Map Development assessment of a European broadscale

EUSea. Map: Development & assessment of a European broadscale seabed habitat map Natalie Askew & Andy Cameron, JNCC, UK 29 November 2010, Brussels

Outline n Challenges n User feedback n Interaction with other Thematic Assembly Groups n Lessons learned for follow-on projects n Compatibility with INSPIRE n Demonstration of EUSea. Map portal
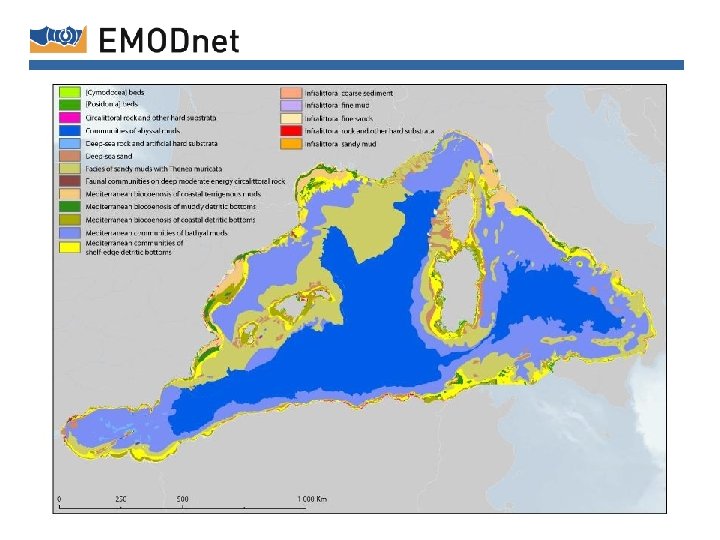

Challenges – Western Mediterranean n Energy: scarcity of biological data for threshold analysis
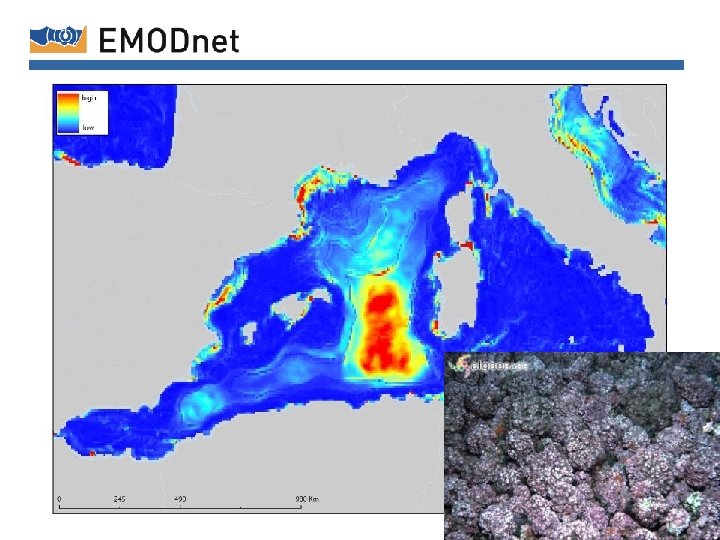

Challenges – Western Mediterranean n Energy: scarcity of biological data for threshold analysis & model resolution n Sediments: limited access to raw data & unexpected combinations of sediment type / biological zone n Scale: steeply shelving shores

Diverse sources

North & Celtic Seas 9 EMODnet 12/19/2021

Challenges – North & Celtic Seas n Energy: n Resolution at the coast n Complex relationship between seabed energy & habitat types

Kinetic energy at the seabed caused by waves 11 EMODnet 12/19/2021

Kinetic energy at the seabed caused by currents 12 EMODnet 12/19/2021

Challenges – North & Celtic Seas n Energy: n Resolution at the coast n Complex relationship between seabed energy & habitat types n Biological zones: n Need more data for testing shelf & deep sea thresholds n Salinity: n Primarily for defining estuarine areas n Coarse resolution from My. Ocean (7 km)

Baltic 14 EMODnet 12/19/2021
")
Challenges – Baltic n Light data n From Secchi disc measurements (5738)
")
Secchi depth data for the Baltic Sea (1980 -2008)
 n Baltic")
Challenges – Baltic n Light data n From Secchi disc measurements (5738) n Baltic EUNIS still in development n n EUSea. Map presents 2 options: energy or salinity providing high level split Potential large number of classes (300+) n Transition between North Sea & Baltic

Polyhaline Fully marine

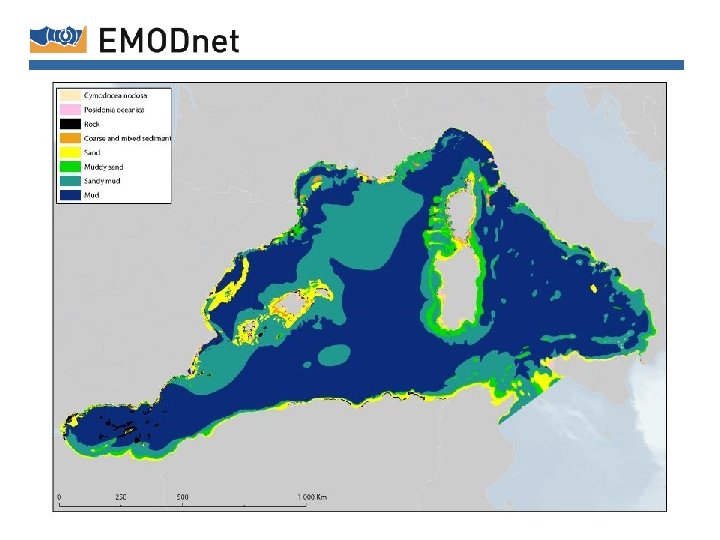
Challenges across basins n Timescales n n Geology update Feb 2011 Hydrography update March 2011 n Balance between consistency between regions & level of detail required map aggregation n Entering metadata into central repository

Map aggregation n Different # of classes per basin: n W Med=22, North & Celtic=110, Baltic=31/51 n MSFD requires consistent maps n 2 maps for each basin: full detail & aggregated n 17 classes after aggregation, across all 20 EMODnet basins 12/19/2021

21 EMODnet 12/19/2021

1. Validation by external data 3 approaches to confidence 2. Assessing quality of source data 3. Confidence in thresholds Accuracy percentage statistics based on matches between modelled data and point field data Scoring of key source data (bathymetry and substrate) gives good visual indication of confidence in habitat maps, and highlights where improvements are most needed in future Cell by cell measure of confidence by the model using fuzzy classifiers to visualise confidence in transitional areas

Feedback from users n Positive feedback from n n HELCOM Red List Biotopes Project Eur. OCEAN conference n Maps promoted recently at n n Marine Strategy Coordination Group meeting for MSFD OSPAR GES workshop n Potential users of the methods n MESH Atlantique & PEGASO

Interaction with other EMODnet lots n Geology n Preliminary ‘source’ confidence assessment received (final expected Dec 2011)

25 EMODnet 12/19/2021

Interaction with other EMODnet lots n Geology n n Preliminary ‘source’ confidence assessment received (final expected Dec 2011) Hydrography n ‘Source’ confidence assessment currently being finalised

27 EMODnet 12/19/2021

Interaction with other EMODnet lots n Geology n n Hydrography n n Preliminary ‘source’ confidence assessment received (final expected Dec 2011) ‘Source’ confidence assessment currently being finalised Coordination group n Sharing technical solutions, e. g. searchable central WMS registry n URLs for Web Mapping Services

Lessons learnt #1 ‘Dynamic sediment classifications’ are beneficial for habitat mapping Assessing confidence in wave & tidal models is challenging & light in Baltic Run habitat mapping project following on from projects delivering physical data

Lessons learnt #2 Structure of EUNIS hierarchy underpins broadscale mapping method Need better understanding of complex relationships between energy & habitats Combined 3 approaches to confidence is practical solution. Could be improved with data density maps.

Data type Baltic North Celtic W Med Substrate Bathymetry Light Wave energy at seabed Tidal energy at seabed Salinity at seabed Dissolved O 2 Stratification

Compatibility with INSPIRE n Map. Server 5. 4 supports WMS 1. 3 required by INSPIRE n CAMIOON Service with Data Products Catalogue n n Still under development INSPIRE compliant EUSea. Map will enter metadata using CAMIOON in maintenance phase Search facility

EUSea. Map Portal & WMS url www. jncc. gov. uk/EUSea. Map http: //213. 122. 160. 71/scripts/mapserv. e xe? map=D: WebsitesEUSeamap EUSeamap. WMS. map

JNCC website & link to portal www. jncc. gov. uk/EUSea. Map +44 1733 866914 natalie. askew@jncc. gov. uk

web. GIS screen shots 36 EMODnet 12/19/2021

37 EMODnet 12/19/2021

38 EMODnet 12/19/2021

39 EMODnet 12/19/2021

40 EMODnet 12/19/2021

41 EMODnet 12/19/2021

42 EMODnet 12/19/2021

43 EMODnet 12/19/2021

44 EMODnet 12/19/2021

45 EMODnet 12/19/2021
- Slides: 44