
ETIS Lanka Webinar The global recession How long
ETIS Lanka Webinar The global recession How long and how deep? May 5 th, 2020 Organised by
Putting the impact of COVID-19 into perspective • Is COVID-19 shock the source of the coming world recession? • Putting this shock into perspective • Some tentative thoughts on the possible future economic developments
The facts

Situation looking really bad….
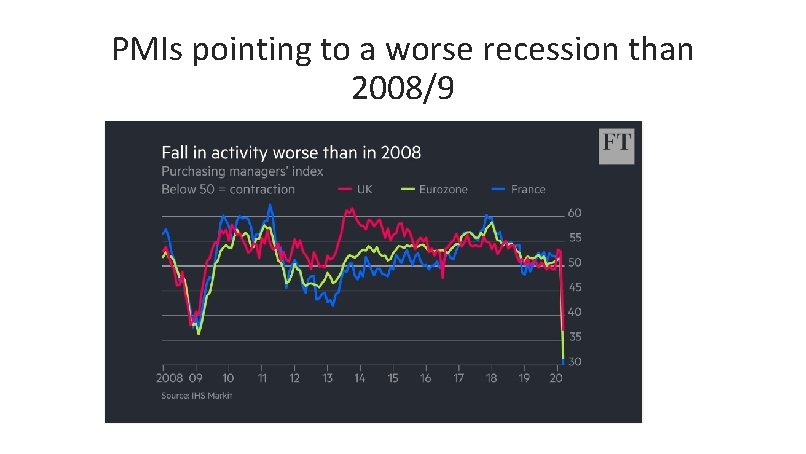
PMIs pointing to a worse recession than 2008/9
IMF forecasting a fall in world economic growth in 2020

But wait…. let’s look at what was happening before COVID-19
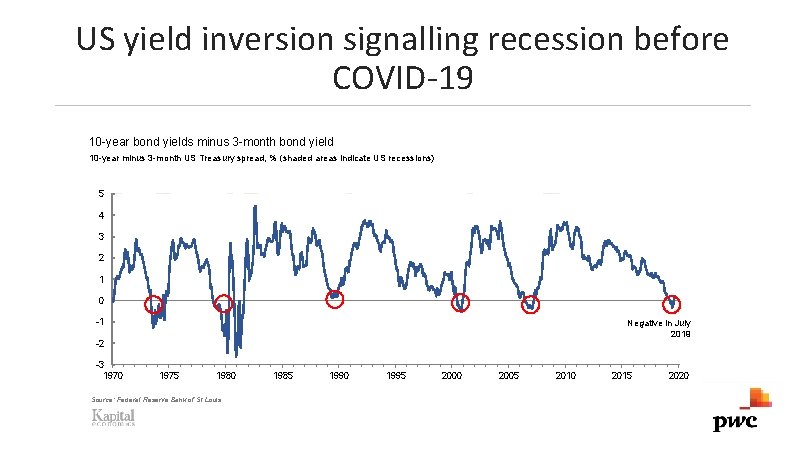
US yield inversion signalling recession before COVID-19 10 -year bond yields minus 3 -month bond yield 10 -year minus 3 -month US Treasury spread, % (shaded areas indicate US recessions) 5 4 3 2 1 0 -1 Negative in July 2019 -2 -3 1970 1975 1980 Source: Federal Reserve Bank of St Louis 1985 1990 1995 2000 2005 2010 2015 2020
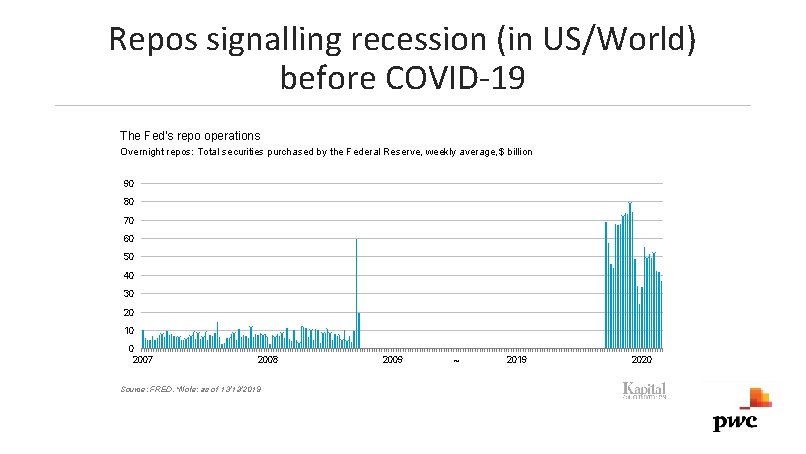
Repos signalling recession (in US/World) before COVID-19 The Fed's repo operations Overnight repos: Total securities purchased by the Federal Reserve, weekly average, $ billion 90 80 70 60 50 40 30 20 10 0 2007 2008 Source: FRED. *Note: as of 13/12/2019 2009 ~ 2019 2020
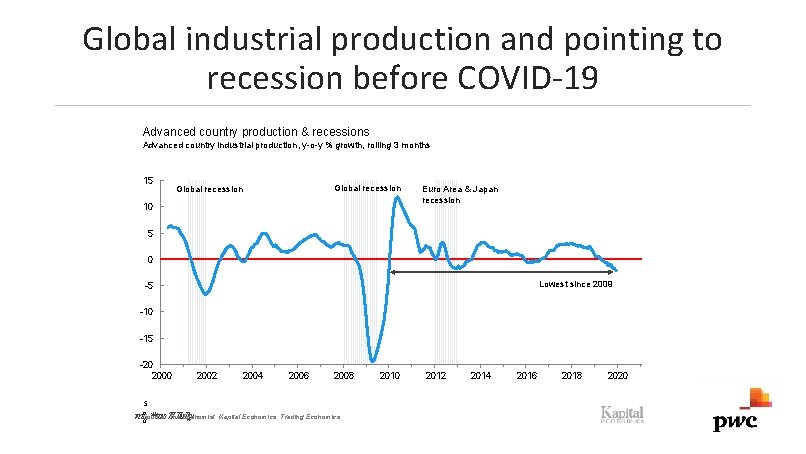
Global industrial production and pointing to recession before COVID-19 Advanced country production & recessions Advanced country industrial production, y-o-y % growth, rolling 3 months 15 Global recession 10 Euro Area & Japan recession 5 0 Lowest since 2009 -5 S o u r c e : -10 -15 -20 2002 2004 2006 2008 I S H o S Source: Economist, Kapital Economics, STrading Economics onomic. Data, author'scalculations, *as 7 The 7 July onomic *as S o M u a r u r c e 2010 2012 2014 2016 2018 2020
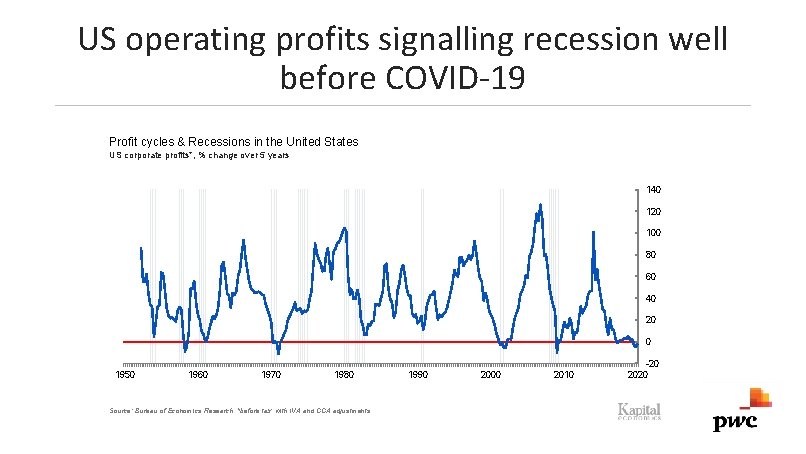
US operating profits signalling recession well before COVID-19 Profit cycles & Recessions in the United States US corporate profits*, % change over 5 years 140 120 100 80 60 40 20 0 1950 1960 1970 1980 Source: Bureau of Economics Research. *before tax, with IVA and CCA adjustments 1990 2000 2010 -20 2020
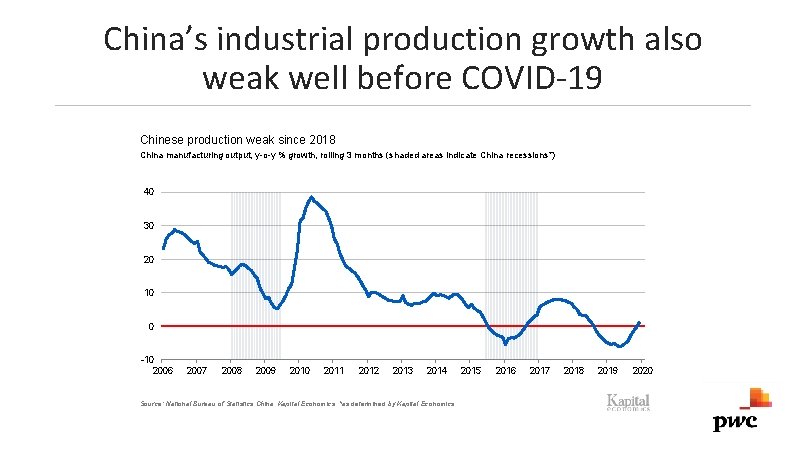
China’s industrial production growth also weak well before COVID-19 Chinese production weak since 2018 China manufacturing output, y-o-y % growth, rolling 3 months (shaded areas indicate China recessions*) 40 30 20 10 0 -10 2006 2007 2008 2009 2010 2011 2012 2013 2014 Source: National Bureau of Statistics China, Kapital Economics. *as determined by Kapital S Economics 2015 2016 2017 2018 S 2019 2020

How to understand what was happening before COVID-19
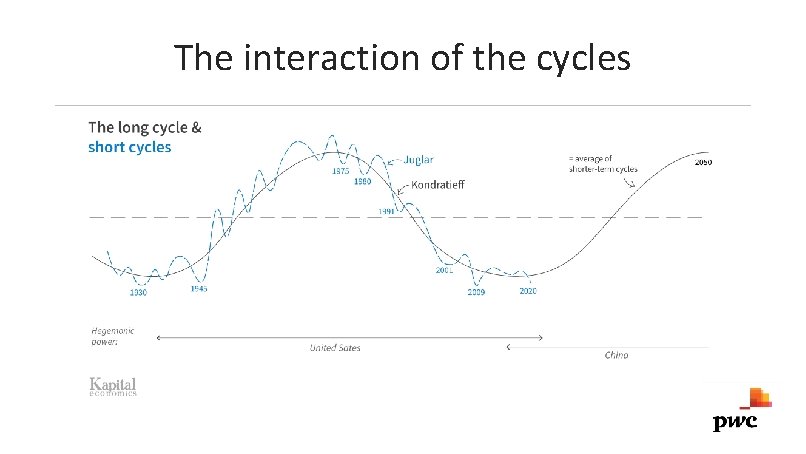
The interaction of the cycles
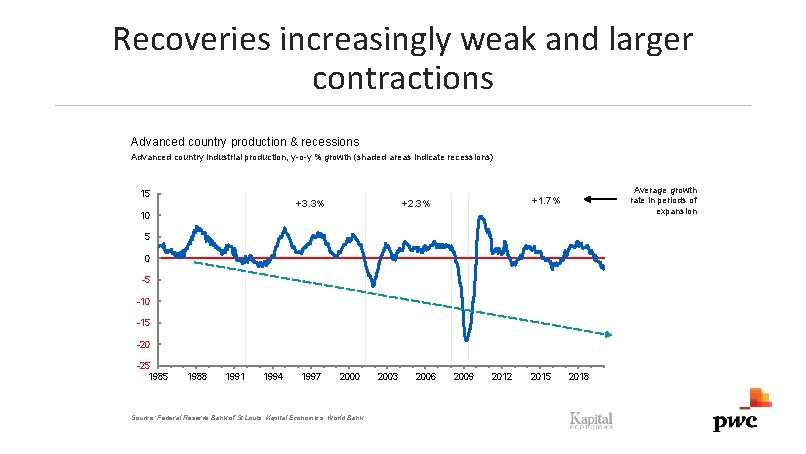
Recoveries increasingly weak and larger contractions Advanced country production & recessions Advanced country industrial production, y-o-y % growth (shaded areas indicate recessions) 15 Average growth rate in periods of expansion +1. 7% +2. 3% +3. 3% 10 5 0 -5 -10 -15 -20 -25 1988 1991 1994 1997 2000 Source: Federal Reserve Bank of St Louis, Kapital Economics, World Bank 2003 2006 2009 2012 2015 2018
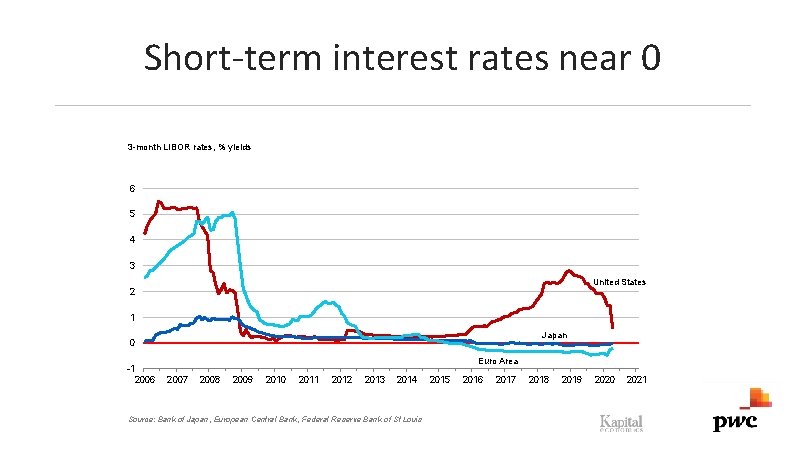
Short-term interest rates near 0 S o u r c e : T h e E c o n o m i s t , F R E D , T r a d i 3 -month LIBOR rates, % yields 6 5 4 3 United States 2 1 Japan 0 -1 2006 Euro Area 2007 2008 2009 2010 2011 2012 2013 2014 Source: Bank of Japan, European Central Bank, Federal Reserve Bank of St Louis 2015 2016 2017 2018 2019 2020 2021
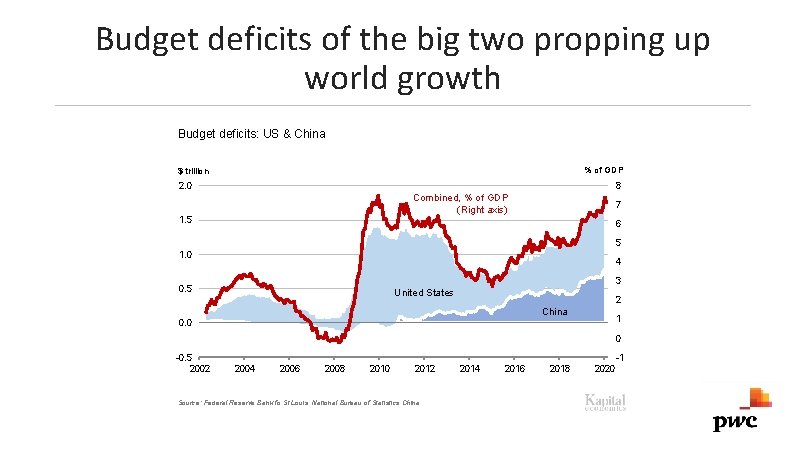
Budget deficits of the big two propping up world growth Budget deficits: US & China % of GDP $ trillion 2. 0 8 Combined, % of GDP (Right axis) 1. 5 7 6 5 1. 0 4 3 0. 5 S o u r c e : N B S C h i United States 2 China 1 0. 0 0 -0. 5 2002 -1 2004 2006 2008 2010 2012 Source: Federal Reserve Bank fo St Louis, National Bureau of Statistics China 2014 2016 S 2018 2020
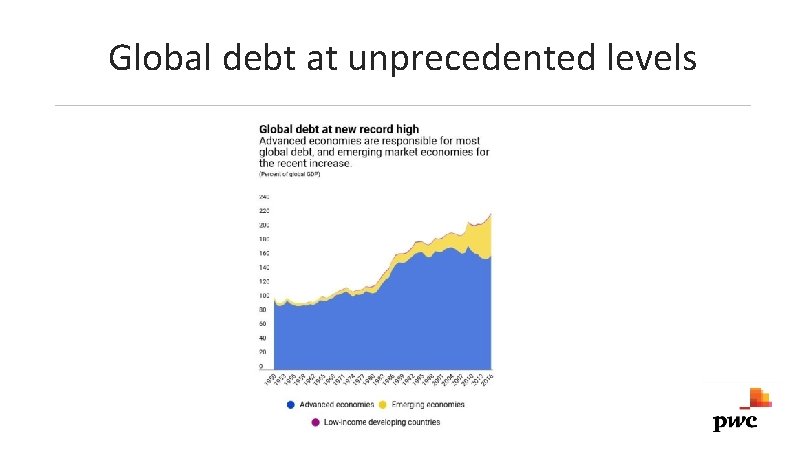
Global debt at unprecedented levels
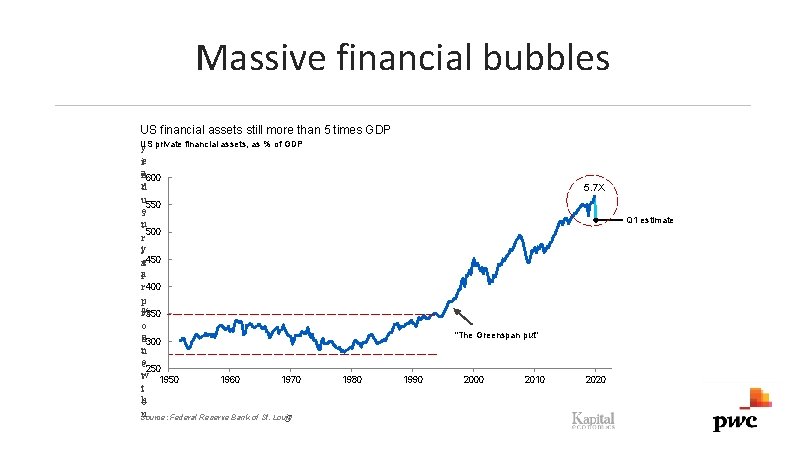
Massive financial bubbles US financial assets still more than 5 times GDP US private financial assets, as % of GDP y ei an 600 r d u 550 so tn -r 500 y i ae 450 la r 400 p r%350 o gd 300 r u co 250 tw 1950 1960 1970 it h o n Source: Federal Reserve Bank of St. Louis S - o u 5. 7 X Q 1 estimate "The Greenspan put" 1980 1990 2000 2010 2020

What to expect
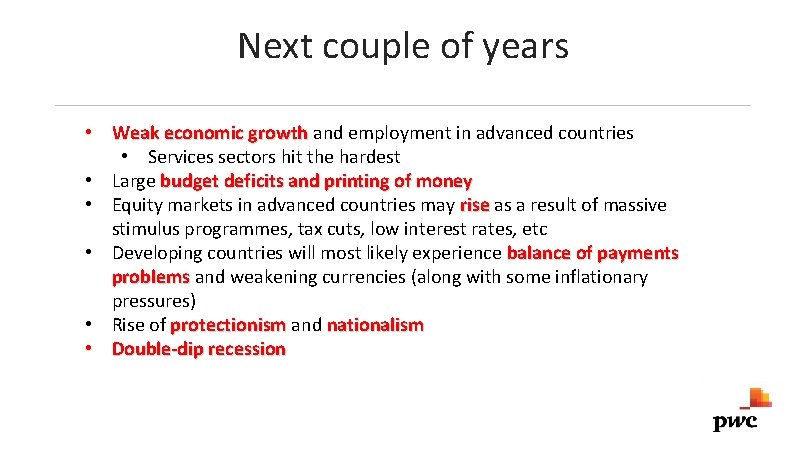
Next couple of years • Weak economic growth and employment in advanced countries • Services sectors hit the hardest • Large budget deficits and printing of money • Equity markets in advanced countries may rise as a result of massive stimulus programmes, tax cuts, low interest rates, etc • Developing countries will most likely experience balance of payments problems and weakening currencies (along with some inflationary pressures) • Rise of protectionism and nationalism • Double-dip recession
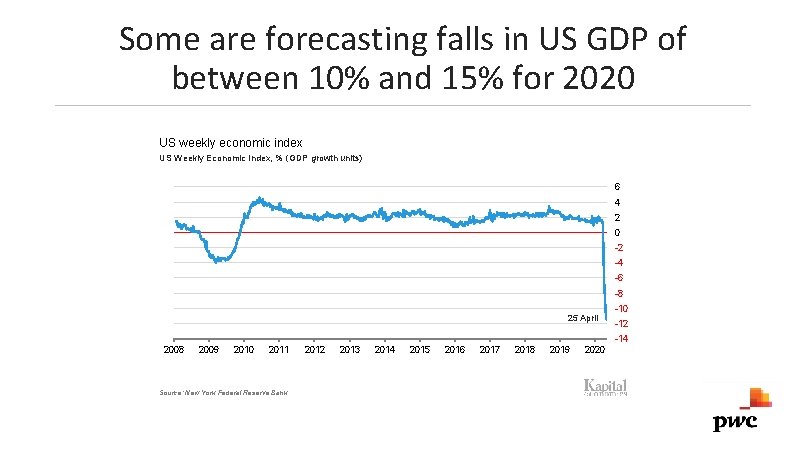
Some are forecasting falls in US GDP of between 10% and 15% for 2020 US weekly economic index US Weekly Economic Index, % (GDP growth units) 6 4 2 0 -2 -4 -6 -8 25 April -10 -12 -14 2008 2009 2010 2011 Source: New York Federal Reserve Bank 2012 2013 2014 2015 2016 2017 2018 2019 2020
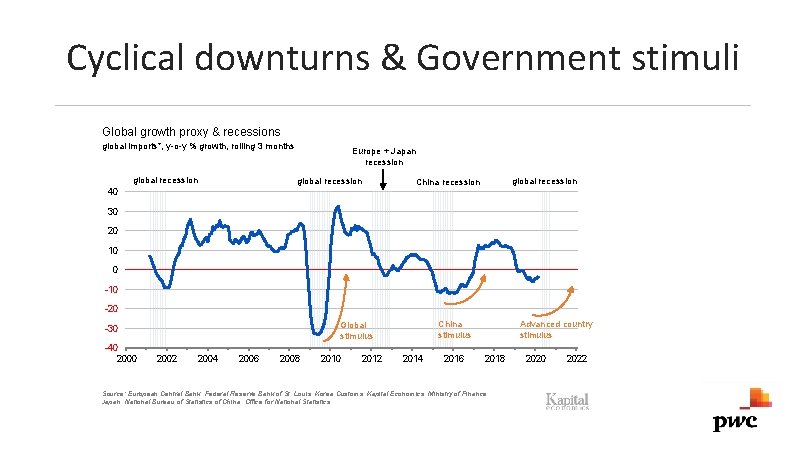
Cyclical downturns & Government stimuli Global growth proxy & recessions global imports*, y-o-y % growth, rolling 3 months global recession Europe + Japan recession global recession China recession 40 30 20 10 0 -10 S o S uo ur cr ec e: -20 -40 2002 2004 2006 2008 2010 2012 Advanced country stimulus China stimulus Global stimulus -30 2014 2016 2018 2020 : N N B B S S C Ch Source: European Central Bank, Federal Reserve Bank of St. Louis, Korea Customs, Kapital Economics, Ministry of Finance Japan, National Bureau of Statistics of China, Office for National Statistics S 2022
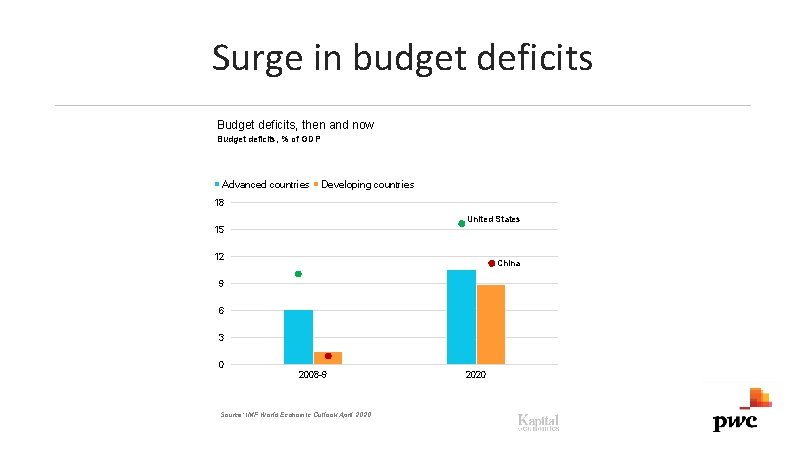
Surge in budget deficits Budget deficits, then and now Budget deficits, % of GDP Advanced countries Developing countries 18 United States 15 12 China 9 6 3 0 2008 -9 Source: IMF World Economic Outlook April 2020
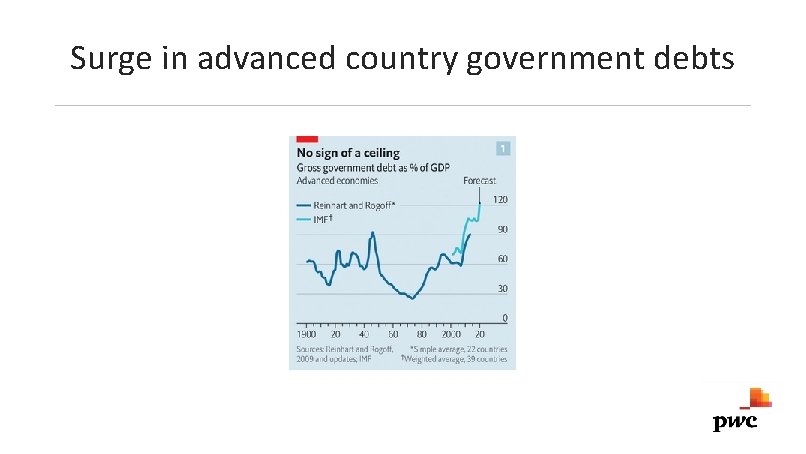
Surge in advanced country government debts
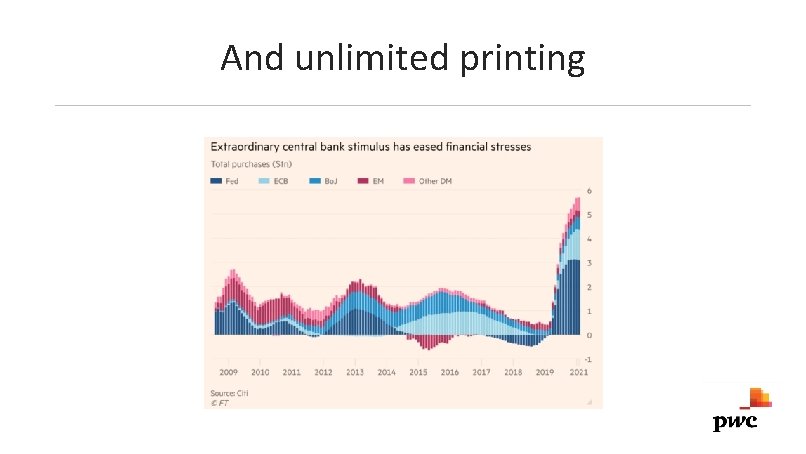
And unlimited printing
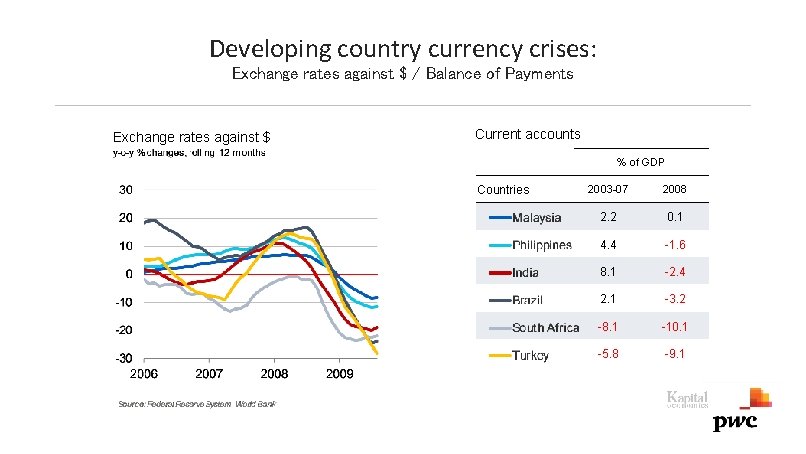
Developing country currency crises: Exchange rates against $ / Balance of Payments Exchange rates against $ Current accounts Countries % of GDP 2003 -07 2008 2. 2 0. 1 4. 4 -1. 6 8. 1 -2. 4 2. 1 -3. 2 -8. 1 -10. 1 -5. 8 -9. 1
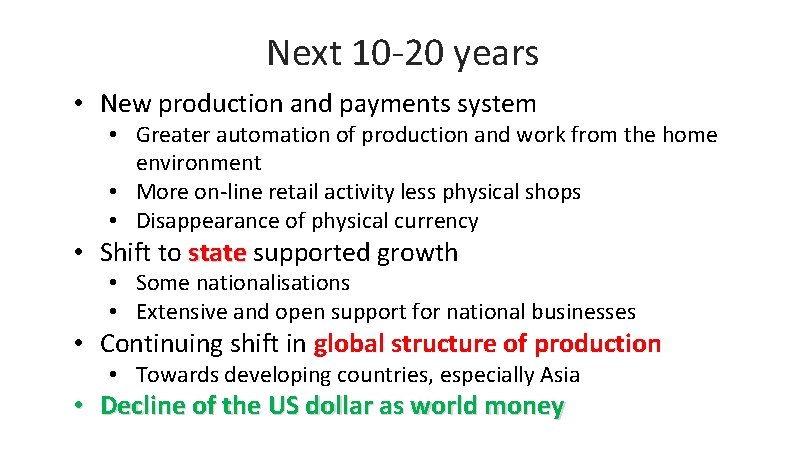
Next 10 -20 years • New production and payments system • Greater automation of production and work from the home environment • More on-line retail activity less physical shops • Disappearance of physical currency • Shift to state supported growth • Some nationalisations • Extensive and open support for national businesses • Continuing shift in global structure of production • Towards developing countries, especially Asia • Decline of the US dollar as world money
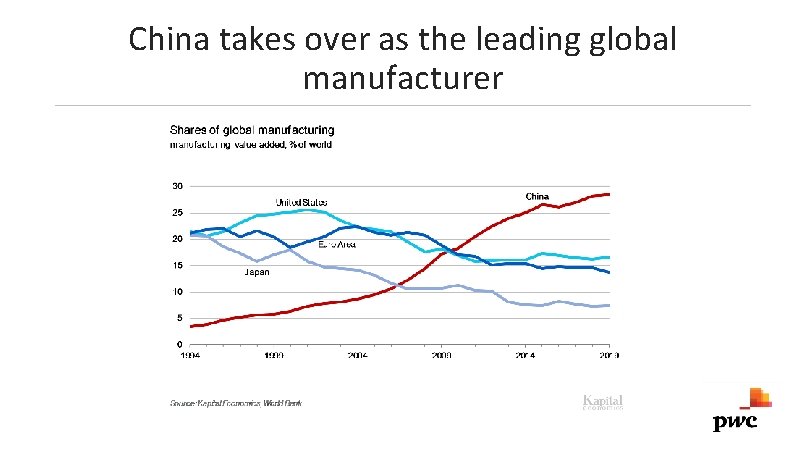
China takes over as the leading global manufacturer
- Slides: 29