
Ethnicity trends The University of Manchester Student Experience

- Slides: 9
Ethnicity trends – The University of Manchester Student Experience and Success Daniel Swain University of Manchester – Planning Support Office
Student Experience and Success Area of Work Key Ethnicity Findings Recruitment Recruiting increasing numbers of undergraduate BME students. Numbers of postgraduate taught (PGT) and postgraduate research (PGR) students have fluctuated but an increasing proportion of PGT students recruited are BME. Student Experience Retention – Asian students had the highest retention levels particularly Chinese, Indian and Bangladeshi students. There were not significant differences between White, Back and Other students. Resiting Exams – Black and Asian students had higher levels of resiting students compared to White and Other. Asian and Black females and Black males were the most likely to resit exams. Attainment Strong historical trend of White students achieving better outcomes than BME students Post University Outcomes BME graduates overall significantly more likely to be in a positive destination at 6 months than White graduates. BME graduates significantly more likely to be unemployed and no significant differences on levels of graduate level further study.
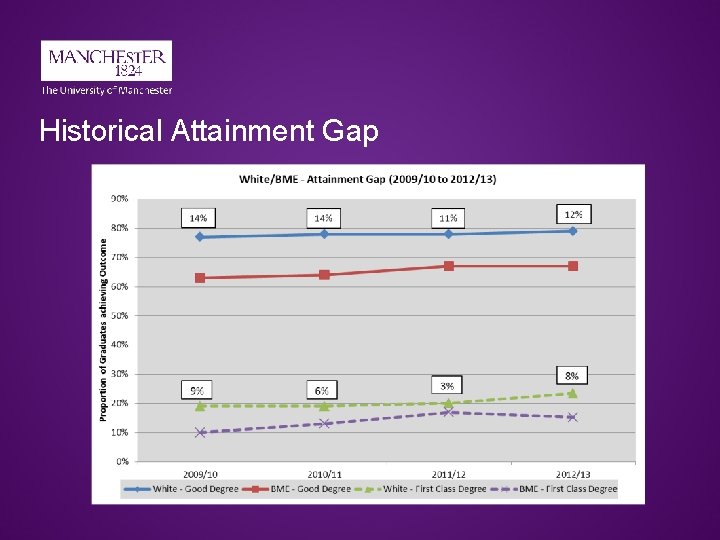
Historical Attainment Gap
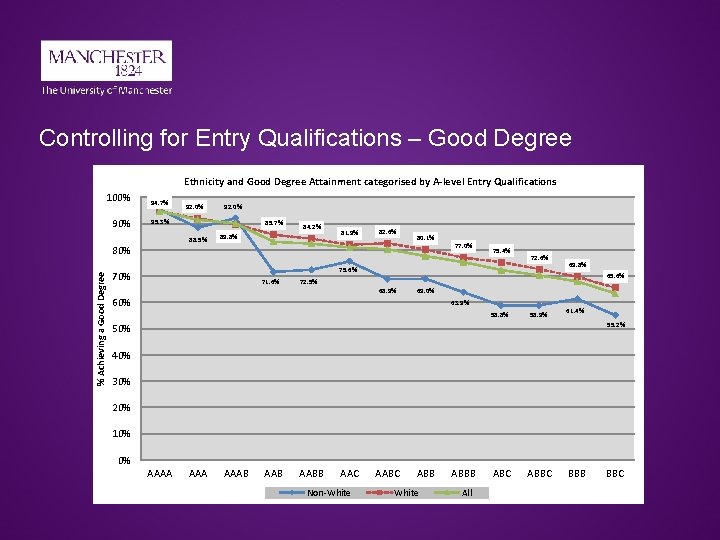
Controlling for Entry Qualifications – Good Degree Ethnicity and Good Degree Attainment categorised by A-level Entry Qualifications 100% 94. 7% 92. 0% 85. 7% 88. 5% 80% % Achieving a Good Degree 92. 0% 95. 3% 84. 2% 89. 8% 81. 9% 82. 6% 80. 1% 77. 0% 75. 4% 72. 6% 75. 6% 70% 71. 6% 69. 8% 65. 6% 72. 5% 68. 9% 69. 0% 63. 9% 58. 8% 58. 9% 61. 4% 55. 2% 50% 40% 30% 20% 10% 0% AAAA AAAB AABB AAC Non-White AABC ABB White ABBB All ABC ABBC BBB BBC
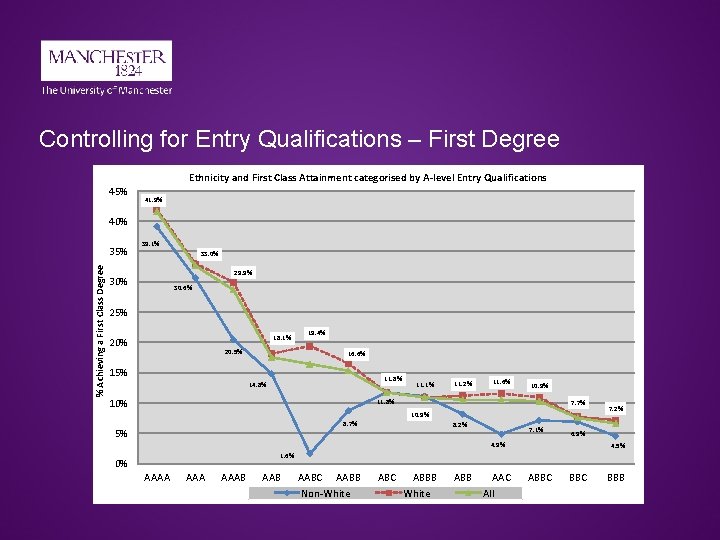
Controlling for Entry Qualifications – First Degree 45% Ethnicity and First Class Attainment categorised by A-level Entry Qualifications 41. 9% 40% % Achieving a First Class Degree 35% 39. 1% 33. 0% 29. 9% 30. 6% 25% 18. 1% 20. 5% 19. 4% 16. 6% 15% 11. 8% 14. 8% 10% 11. 1% 11. 2% 11. 6% 10. 9% 11. 8% 7. 7% 10. 9% 8. 7% 5% 8. 2% 7. 1% 7. 2% 6. 9% 4. 5% 1. 6% 0% AAAA AAAB AABC AABB Non-White ABC ABBB White ABB AAC All ABBC BBB
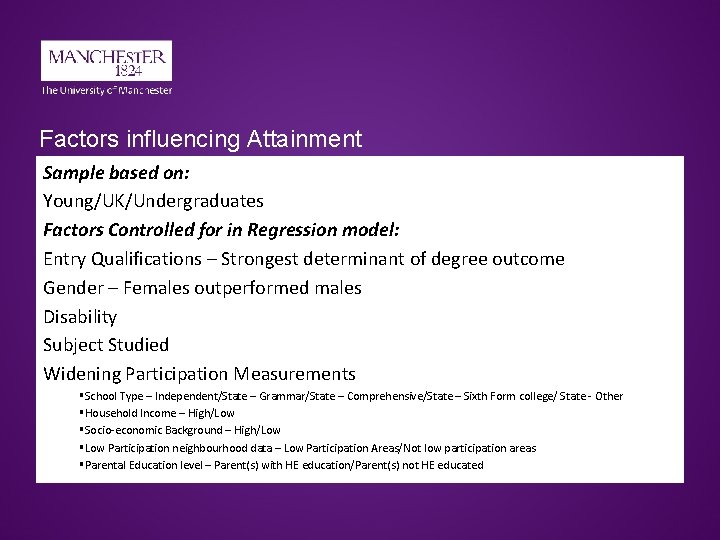
Factors influencing Attainment Sample based on: Young/UK/Undergraduates Factors Controlled for in Regression model: Entry Qualifications – Strongest determinant of degree outcome Gender – Females outperformed males Disability Subject Studied Widening Participation Measurements §School Type – Independent/State – Grammar/State – Comprehensive/State – Sixth Form college/ State - Other §Household Income – High/Low §Socio-economic Background – High/Low §Low Participation neighbourhood data – Low Participation Areas/Not low participation areas §Parental Education level – Parent(s) with HE education/Parent(s) not HE educated
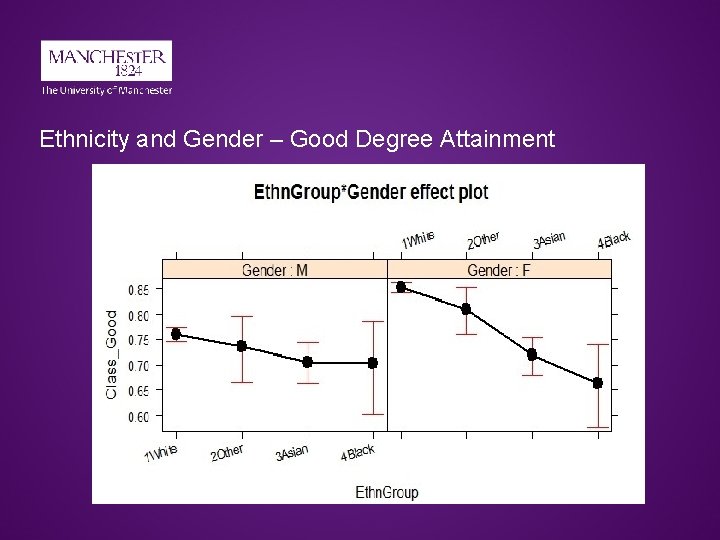
Ethnicity and Gender – Good Degree Attainment
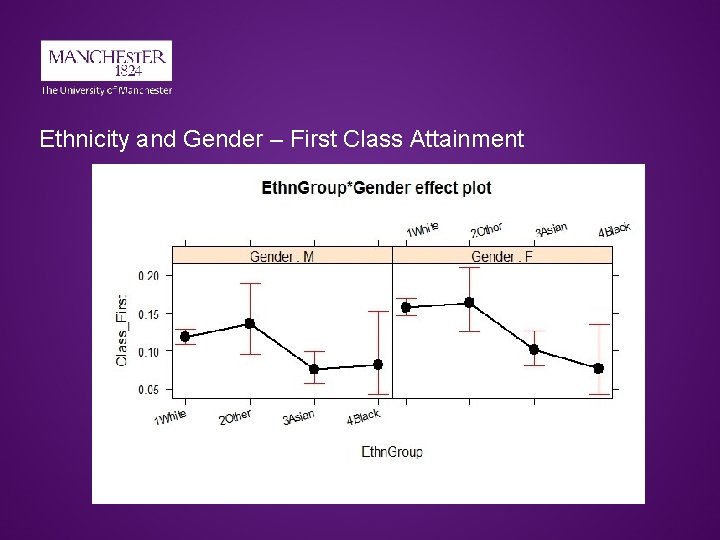
Ethnicity and Gender – First Class Attainment
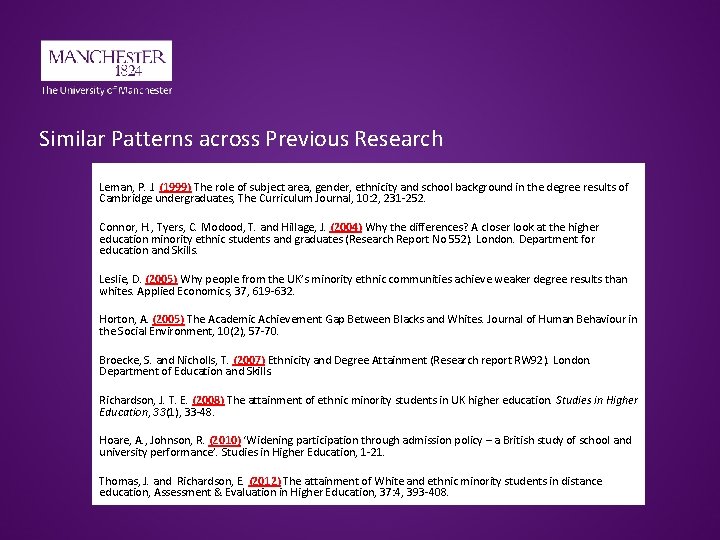
Similar Patterns across Previous Research Leman, P. J. (1999) The role of subject area, gender, ethnicity and school background in the degree results of Cambridge undergraduates, The Curriculum Journal, 10: 2, 231 -252. Connor, H. , Tyers, C. Modood, T. and Hillage, J. (2004) Why the differences? A closer look at the higher education minority ethnic students and graduates (Research Report No 552). London. Department for education and Skills. Leslie, D. (2005) Why people from the UK’s minority ethnic communities achieve weaker degree results than whites. Applied Economics, 37, 619 -632. Horton, A. (2005) The Academic Achievement Gap Between Blacks and Whites. Journal of Human Behaviour in the Social Environment, 10(2), 57 -70. Broecke, S. and Nicholls, T. (2007) Ethnicity and Degree Attainment (Research report RW 92). London. Department of Education and Skills. Richardson, J. T. E. (2008) The attainment of ethnic minority students in UK higher education. Studies in Higher Education, 33(1), 33 -48. Hoare, A. , Johnson, R. (2010) ‘Widening participation through admission policy – a British study of school and university performance’. Studies in Higher Education, 1 -21. Thomas, J. and Richardson, E. (2012) The attainment of White and ethnic minority students in distance education, Assessment & Evaluation in Higher Education, 37: 4, 393 -408.