
ET vs Prefibrotic myelofibrosis Why does it matter
ET vs. Prefibrotic myelofibrosis: Why does it matter Tiziano BARBUI, MD Hematology and Research Foundation, Papa Giovanni XXIII Hospital Bergamo, Italy European Focus on Myeloproliferative Neoplasms and Myelodysplastic Syndromes 5 -7 April 2013, Madrid, Spain
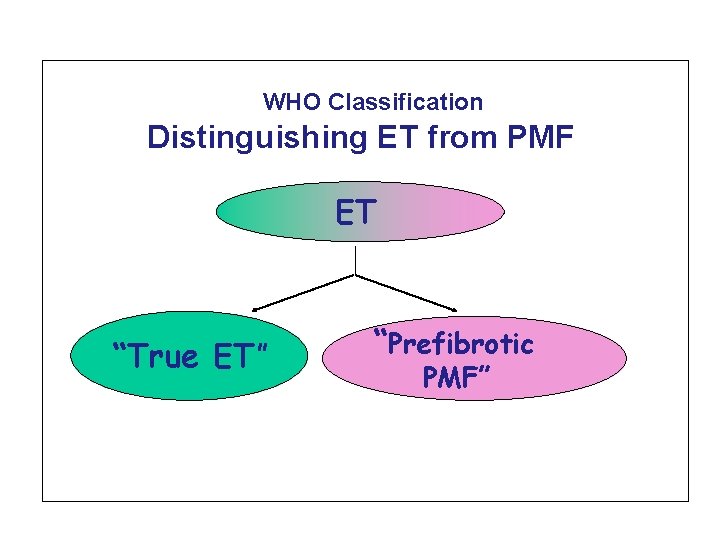
WHO Classification Distinguishing ET from PMF ET “True ET” “Prefibrotic PMF”

Three important components to the process of developing classification of Hema Malignancies First, use morphology, immunophenotype, genetic features, and clinical features to define diseases. Second principle is that classification relies on building a consensus among as many experts as possible on the definition and nomenclature of the disease. Third, while pathologists must take primary responsibility for developing a primary classification, involvement of clinicians is essential to ensure its usefulness and acceptance in daily practice.

Morphology in «true ET» and in prefibrotic myelofibrosis
ET and early PMF: different biology? The molecular mechanisms underlying the development of histological features such as megakaryocyte clustering, are unclear. The cellularity factor, correlates with whether the patient has the JAK 2 V 617 mutation (Wilkins et al Blood 2008; 111: 60 -70) JAK 2 V 617 F allele burden discriminates ET from early PMF (Hussein K et al. , Exp. Hematology 37, 1186, 2009) About the molecular regulation of megakaryocyte location and clustering, it may be relevant that megakaryocyte clusters are observed in mice treated with SDF-1, the ligand for the CXCR 4 receptor. (Avecill et al. Nat Med. 2004; 10: 64 -71) Patients with pre-fibrotic PMF have a pattern of proplatelet formation similar to fibrotic PMF and different from that of «true» ET (Balduini A, PLo. SOne, 2011)
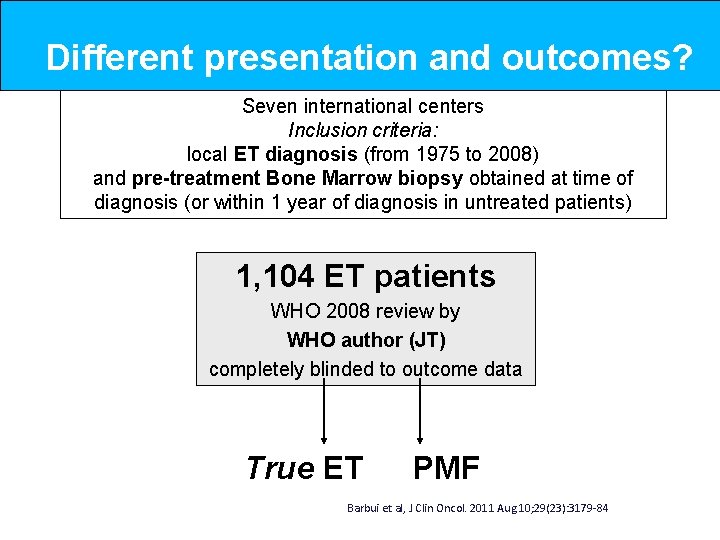
Different presentation and outcomes? Seven international centers Inclusion criteria: local ET diagnosis (from 1975 to 2008) and pre-treatment Bone Marrow biopsy obtained at time of diagnosis (or within 1 year of diagnosis in untreated patients) 1, 104 ET patients WHO 2008 review by WHO author (JT) completely blinded to outcome data True ET PMF Barbui et al, J Clin Oncol. 2011 Aug 10; 29(23): 3179 -84
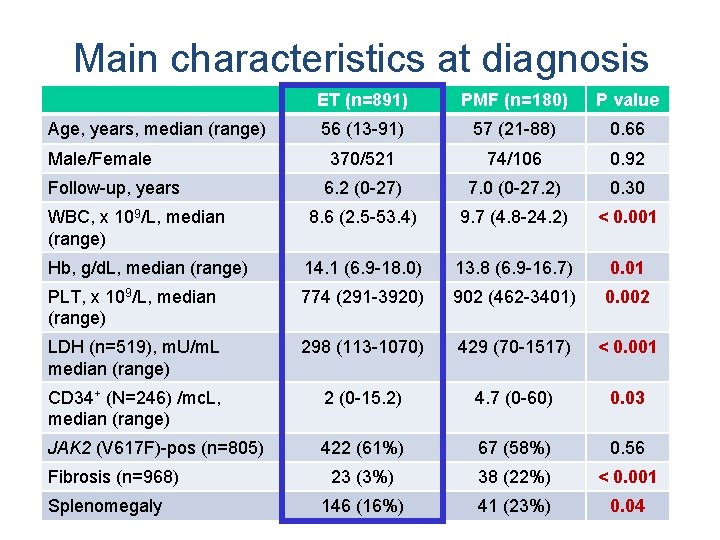
Main characteristics at diagnosis ET (n=891) PMF (n=180) P value 56 (13 -91) 57 (21 -88) 0. 66 370/521 74/106 0. 92 6. 2 (0 -27) 7. 0 (0 -27. 2) 0. 30 WBC, x 109/L, median (range) 8. 6 (2. 5 -53. 4) 9. 7 (4. 8 -24. 2) < 0. 001 Hb, g/d. L, median (range) 14. 1 (6. 9 -18. 0) 13. 8 (6. 9 -16. 7) 0. 01 PLT, x 109/L, median (range) 774 (291 -3920) 902 (462 -3401) 0. 002 LDH (n=519), m. U/m. L median (range) 298 (113 -1070) 429 (70 -1517) < 0. 001 CD 34+ (N=246) /mc. L, median (range) 2 (0 -15. 2) 4. 7 (0 -60) 0. 03 JAK 2 (V 617 F)-pos (n=805) 422 (61%) 67 (58%) 0. 56 23 (3%) 38 (22%) < 0. 001 146 (16%) 41 (23%) 0. 04 Age, years, median (range) Male/Female Follow-up, years Fibrosis (n=968) Splenomegaly
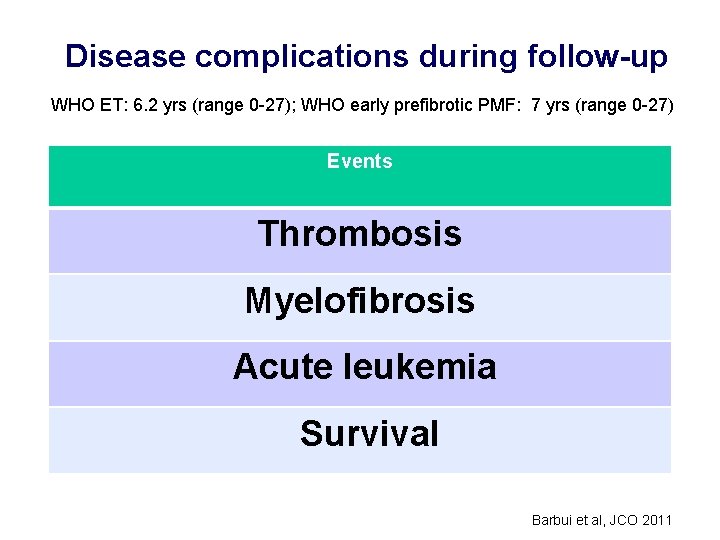
Disease complications during follow-up WHO ET: 6. 2 yrs (range 0 -27); WHO early prefibrotic PMF: 7 yrs (range 0 -27) Events Thrombosis Myelofibrosis Acute leukemia Survival Barbui et al, JCO 2011
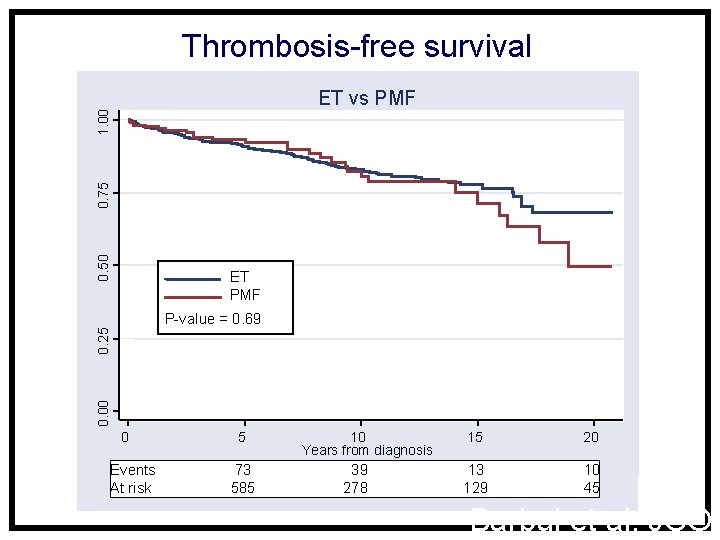
Thrombosis-free survival 0. 50 0. 75 1. 00 ET vs PMF ET PMF 0. 00 0. 25 P-value = 0. 69 0 Events At risk 5 73 585 10 Years from diagnosis 39 278 15 20 13 129 10 45 Barbui et al, JCO
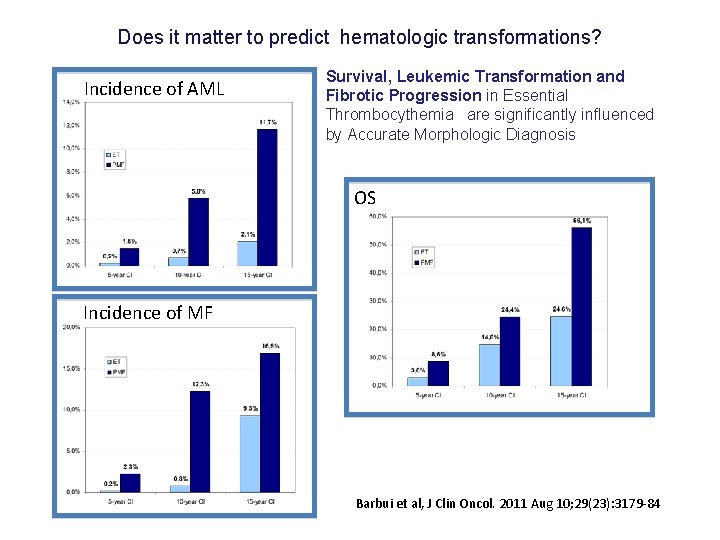
Does it matter to predict hematologic transformations? Incidence of AML Survival, Leukemic Transformation and Fibrotic Progression in Essential Thrombocythemia are significantly influenced by Accurate Morphologic Diagnosis OS Incidence of MF Barbui et al, J Clin Oncol. 2011 Aug 10; 29(23): 3179 -84
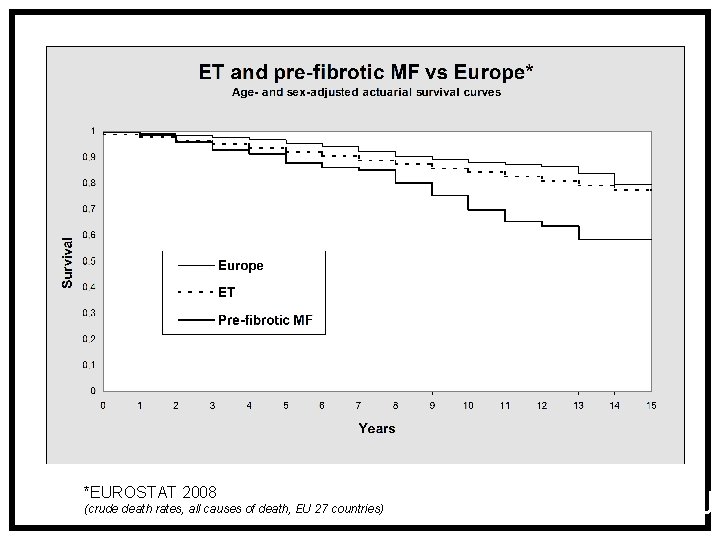
*EUROSTAT 2008 (crude death rates, all causes of death, EU 27 countries) Barbui et al, JC

Survival in patients categorized by different stages of primary myelofibrosis Barosi et al, Plos. One 2012, 7, 4.
Three important components to the process of developing classification of Hema Malignancies First, recognising that the underlying causes of the neoplasm are often unknown and may vary. So, we use morphology, immunophenotype, genetic features, and clinical features to define diseases. Second principle is that classification relies on building a consensus among as many experts as possible on the definition and nomenclature of the disease. Third, while pathologists must take primary responsibility for developing a primary classification, involvement of clinicians is essential to ensure its usefulness and acceptance in daily practice.
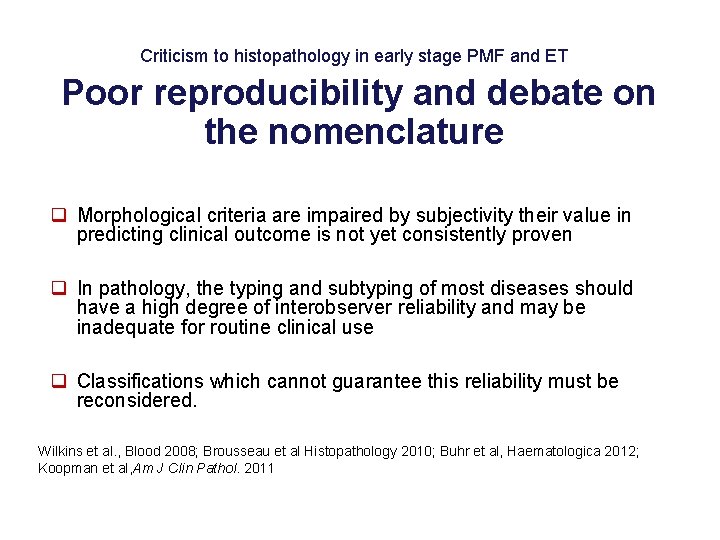
Criticism to histopathology in early stage PMF and ET Poor reproducibility and debate on the nomenclature q Morphological criteria are impaired by subjectivity their value in predicting clinical outcome is not yet consistently proven q In pathology, the typing and subtyping of most diseases should have a high degree of interobserver reliability and may be inadequate for routine clinical use q Classifications which cannot guarantee this reliability must be reconsidered. Wilkins et al. , Blood 2008; Brousseau et al Histopathology 2010; Buhr et al, Haematologica 2012; Koopman et al, Am J Clin Pathol. 2011
Three important components to the process of developing classification of Hema Malignancies First, recognising that the underlying causes of the neoplasm are often unknown and may vary. So, we use morphology, immunophenotype, genetic features, and clinical features to define diseases. Second principle is that classification relies on building a consensus among as many experts as possible on the definition and nomenclature of the disease. Third, while pathologists must take primary responsibility for developing a primary classification, involvement of clinicians is essential to ensure its usefulness and acceptance in daily practice.
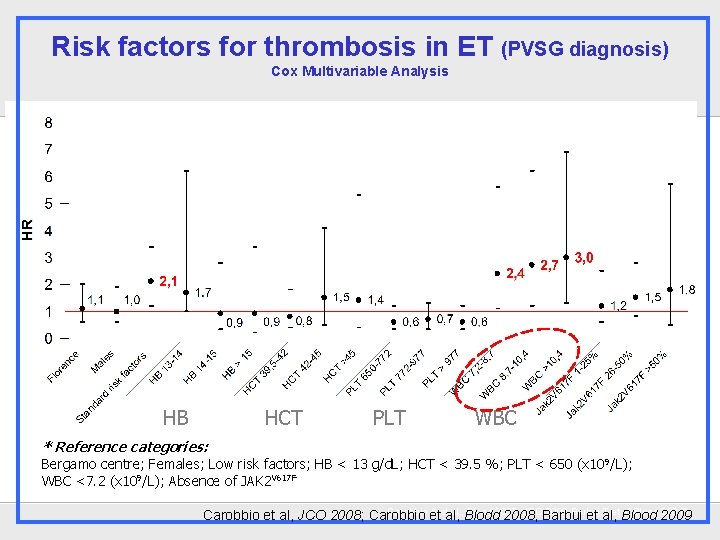
Risk factors for thrombosis in ET (PVSG diagnosis) Cox Multivariable Analysis HB HCT PLT WBC * Reference categories: Bergamo centre; Females; Low risk factors; HB < 13 g/d. L; HCT < 39. 5 %; PLT < 650 (x 10 9/L); WBC <7. 2 (x 109/L); Absence of JAK 2 V 617 F Carobbio et A etal, al. , Blodd Blood 2007; JCOBarbui 2008 Barbui T et Blood al, Blood 2009 20010 Carobbio et al, JCO 2008; Carobbio 2008, et al,
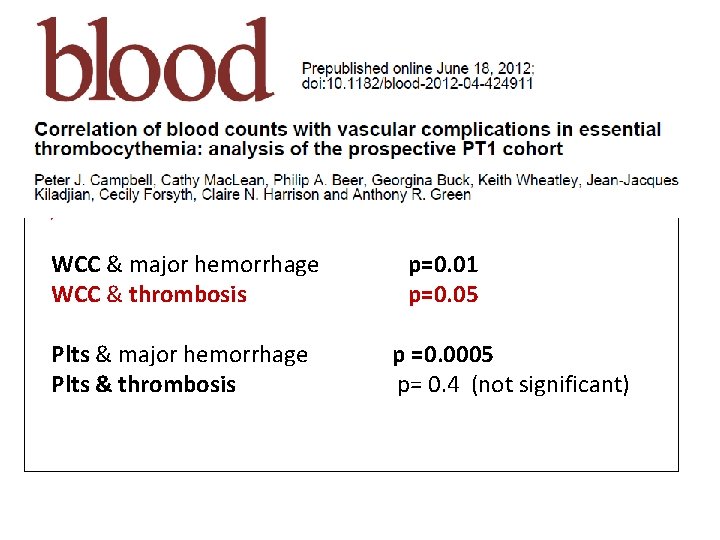
PT-1 randomized clinical trial in high risk ET (Hydroxyurea+asa ) WCC & major hemorrhage WCC & thrombosis Plts & major hemorrhage Plts & thrombosis p=0. 01 p=0. 05 p =0. 0005 p= 0. 4 (not significant)
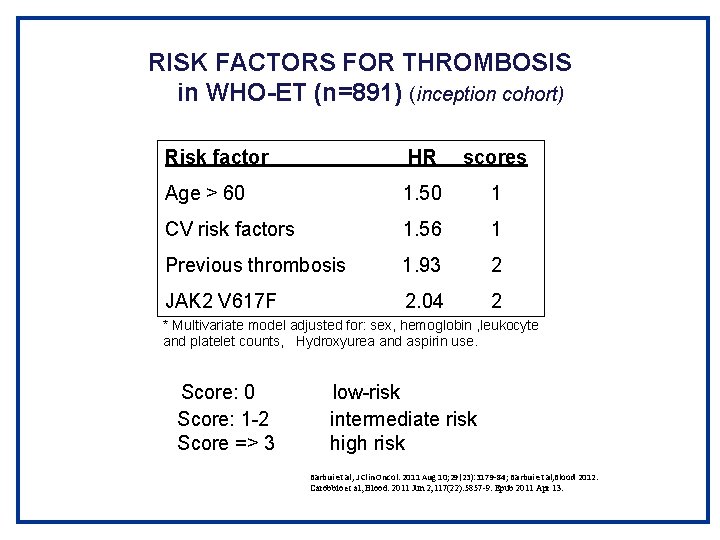
RISK FACTORS FOR THROMBOSIS in WHO-ET (n=891) (inception cohort) Risk factor HR scores Age > 60 1. 50 1 CV risk factors 1. 56 1 Previous thrombosis 1. 93 2 JAK 2 V 617 F 2. 04 2 * Multivariate model adjusted for: sex, hemoglobin , leukocyte and platelet counts, Hydroxyurea and aspirin use. Score: 0 Score: 1 -2 Score => 3 low-risk intermediate risk high risk Barbui et al, J Clin Oncol. 2011 Aug 10; 29(23): 3179 -84; Barbui et al, Blood 2012. Carobbio et al, Blood. 2011 Jun 2; 117(22): 5857 -9. Epub 2011 Apr 13.
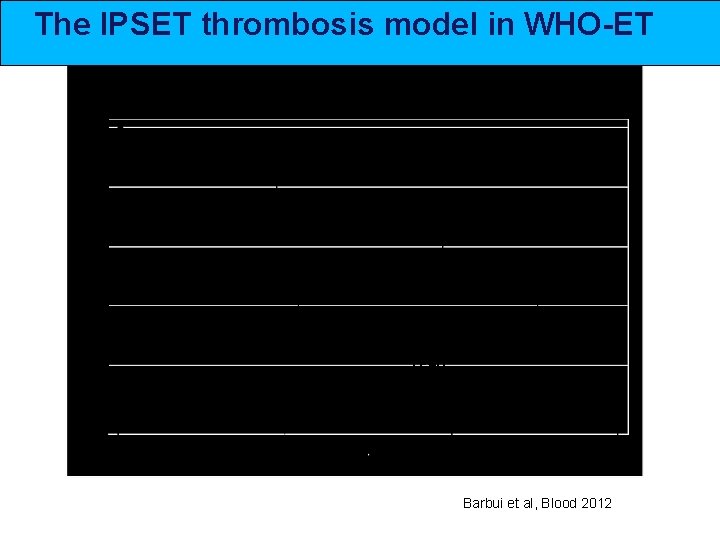
The IPSET thrombosis model in WHO-ET LOW INTERMEDIATE HIGH p=0. 0001 Barbui et al, Blood 2012
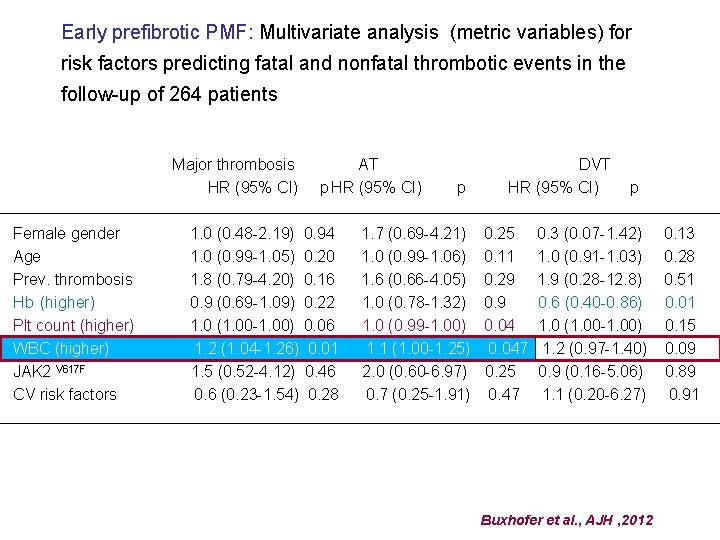
Early prefibrotic PMF: Multivariate analysis (metric variables) for risk factors predicting fatal and nonfatal thrombotic events in the follow-up of 264 patients Major thrombosis HR (95% CI) Female gender Age Prev. thrombosis Hb (higher) Plt count (higher) WBC (higher) JAK 2 V 617 F CV risk factors AT p HR (95% CI) 1. 0 (0. 48 -2. 19) 0. 94 1. 0 (0. 99 -1. 05) 0. 20 1. 8 (0. 79 -4. 20) 0. 16 0. 9 (0. 69 -1. 09) 0. 22 1. 0 (1. 00 -1. 00) 0. 06 1. 2 (1. 04 -1. 26) 0. 01 1. 5 (0. 52 -4. 12) 0. 46 0. 6 (0. 23 -1. 54) 0. 28 p 1. 7 (0. 69 -4. 21) 1. 0 (0. 99 -1. 06) 1. 6 (0. 66 -4. 05) 1. 0 (0. 78 -1. 32) 1. 0 (0. 99 -1. 00) 1. 1 (1. 00 -1. 25) 2. 0 (0. 60 -6. 97) 0. 7 (0. 25 -1. 91) DVT HR (95% CI) 0. 25 0. 11 0. 29 0. 047 0. 25 0. 47 p 0. 3 (0. 07 -1. 42) 1. 0 (0. 91 -1. 03) 1. 9 (0. 28 -12. 8) 0. 6 (0. 40 -0. 86) 1. 0 (1. 00 -1. 00) 1. 2 (0. 97 -1. 40) 0. 9 (0. 16 -5. 06) 1. 1 (0. 20 -6. 27) Buxhofer et al. , AJH , 2012 0. 13 0. 28 0. 51 0. 01 0. 15 0. 09 0. 89 0. 91
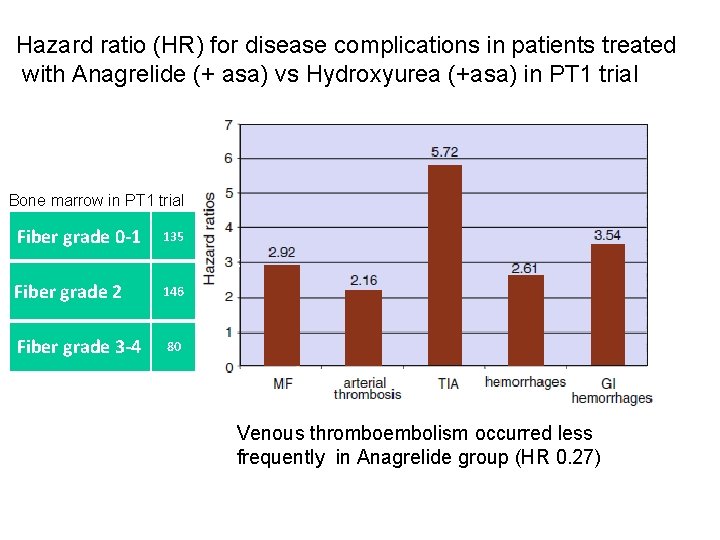
Hazard ratio (HR) for disease complications in patients treated with Anagrelide (+ asa) vs Hydroxyurea (+asa) in PT 1 trial Bone marrow in PT 1 trial Fiber grade 0 -1 135 Fiber grade 2 146 Fiber grade 3 -4 80 Venous thromboembolism occurred less frequently in Anagrelide group (HR 0. 27)
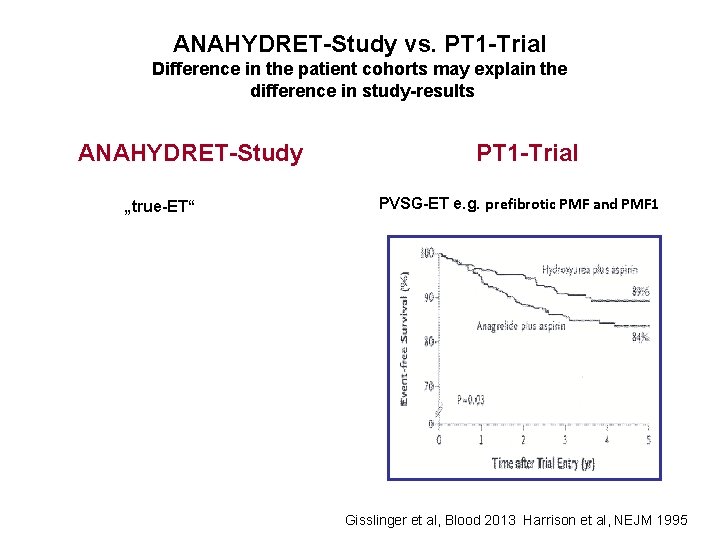
ANAHYDRET-Study vs. PT 1 -Trial Difference in the patient cohorts may explain the difference in study-results ANAHYDRET-Study „true-ET“ PT 1 -Trial PVSG-ET e. g. prefibrotic PMF and PMF 1 Gisslinger et al, Blood 2013 Harrison et al, NEJM 1995
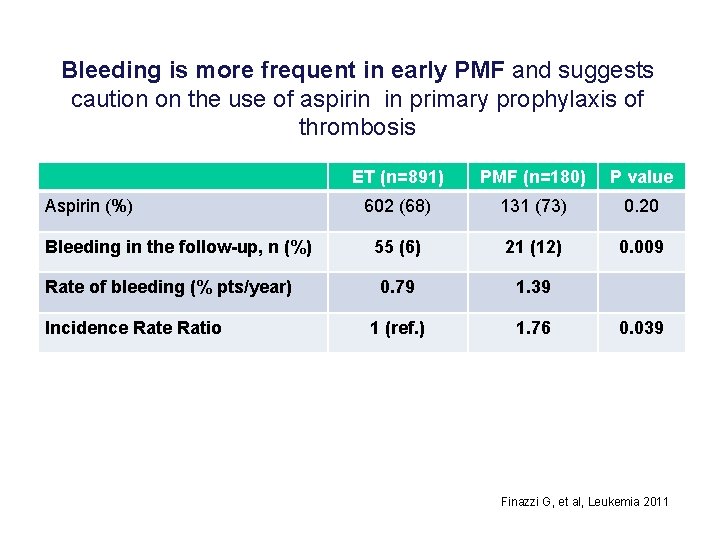
Bleeding is more frequent in early PMF and suggests caution on the use of aspirin in primary prophylaxis of thrombosis Aspirin (%) Bleeding in the follow-up, n (%) Rate of bleeding (% pts/year) Incidence Ratio ET (n=891) PMF (n=180) P value 602 (68) 131 (73) 0. 20 55 (6) 21 (12) 0. 009 0. 79 1. 39 1 (ref. ) 1. 76 0. 039 Finazzi G, et al, Leukemia 2011
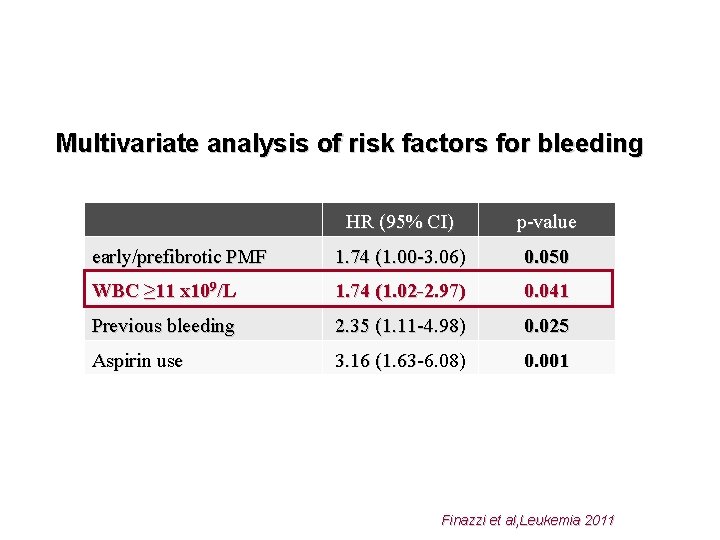
Multivariate analysis of risk factors for bleeding HR (95% CI) p-value early/prefibrotic PMF 1. 74 (1. 00 -3. 06) 0. 050 WBC ≥ 11 x 109/L 1. 74 (1. 02 -2. 97) 0. 041 Previous bleeding 2. 35 (1. 11 -4. 98) 0. 025 Aspirin use 3. 16 (1. 63 -6. 08) 0. 001 Finazzi et al, Leukemia 2011
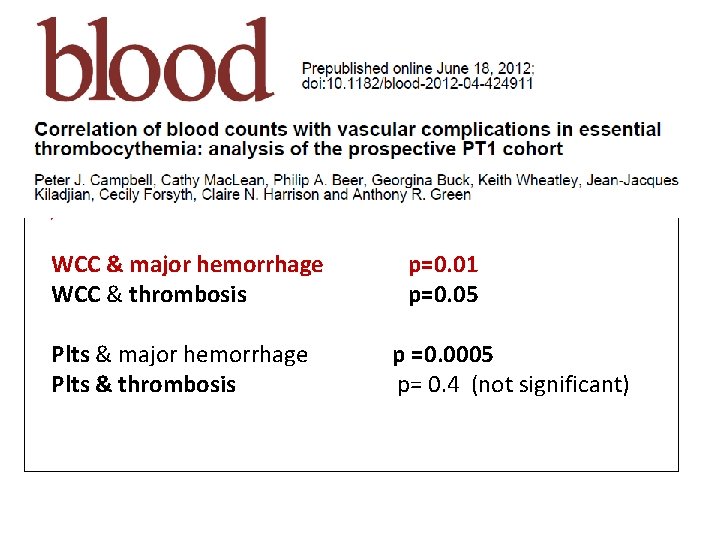
PT-1 randomized clinical trial in high risk ET (Hydroxyurea+asa ) WCC & major hemorrhage WCC & thrombosis Plts & major hemorrhage Plts & thrombosis p=0. 01 p=0. 05 p =0. 0005 p= 0. 4 (not significant)
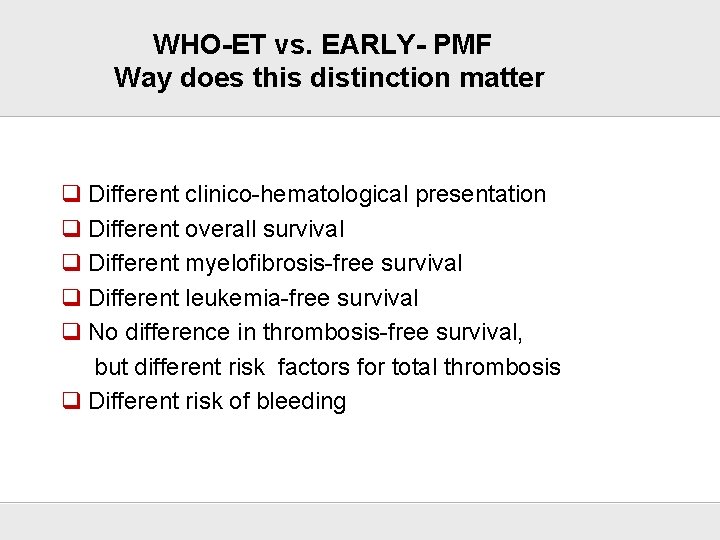
WHO-ET vs. EARLY- PMF Way does this distinction matter q Different clinico-hematological presentation q Different overall survival q Different myelofibrosis-free survival q Different leukemia-free survival q No difference in thrombosis-free survival, but different risk factors for total thrombosis q Different risk of bleeding There is a difference in the risk for thrombosis and bleeding
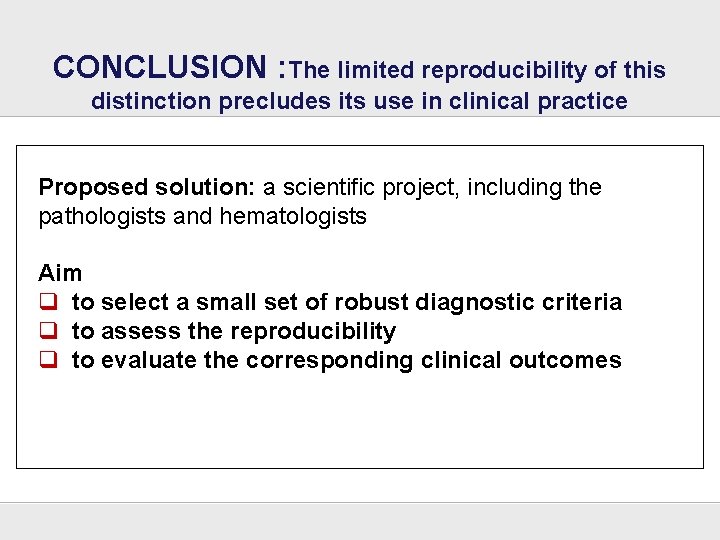
CONCLUSION : The limited reproducibility of this distinction precludes its use in clinical practice Proposed solution: a scientific project, including the pathologists and hematologists Aim q to select a small set of robust diagnostic criteria q to assess the reproducibility q to evaluate the corresponding clinical outcomes
ACKNOWLEDGEMENT
- Slides: 28