Estuaries Where the Rivers meet the Sea Estuaries


 Delaware")
- Slides: 27
Estuaries Where the Rivers meet the Sea
Estuaries • Where the Rivers meet the Sea • Semi- enclosed body of water where there is a mix of river and seawater, and mix of fluvial and marine processes • Mouths of many rivers flooded at last sea level high (last interglacial) • Boundary between fluvial and marine processes – Influenced by tides
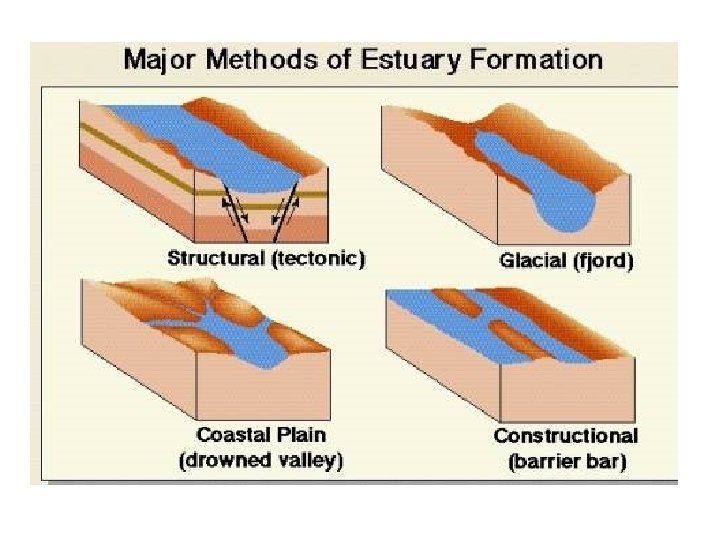
Types of Estuaries • • Drowned river valley Fjord Bar- built Tectonic
Tectonic San Francisco Bay
Fjord
Chesapeake Bay: Drowned Shoreline
ESTUARY The Netherlands
Barrier Island
Value of Estuaries • Greatly influenced by river discharge and tidal mixing. – Environmental conditions fluctuate widely. – Biomass is high because estuaries have high nutrient levels. – Species diversity is low because fewer species can cope with the wide fluctuations in temperature, salinity etc. – “nursery grounds” • young stages develop in the estuary – (abundant food; low predation – may move offshore to adult habitats
• Tidal range – tides are giant shallow water wave – water piles up in enclosed areas • microtidal- up to 2 m • mesotidal 2 – 4 m • macrotidal > 4 m
W. W. Norton
• tidal current – generated by horizontal movement of water • most pronounced in mesotidal • carries great volume in macrotidal – flood tides • Incoming • moves water onshore between low and high – ebb tides • Outgoing • moves water offshore – Slack • top and bottom of cycle (when high is in, or low is in) – bidirectional flow • leads to bidirectional cross- stratification with mud drapes – herring bone, mud drape, reactivation surface
Classification • One way of quantifying is by comparing the volume R of freshwater that enters from the river during one tidal period, with the volume V of water brought into the estuary by the tide and removed over each tidal cycle. • R is sometimes called the river volume, while V is known as the tidal volume.
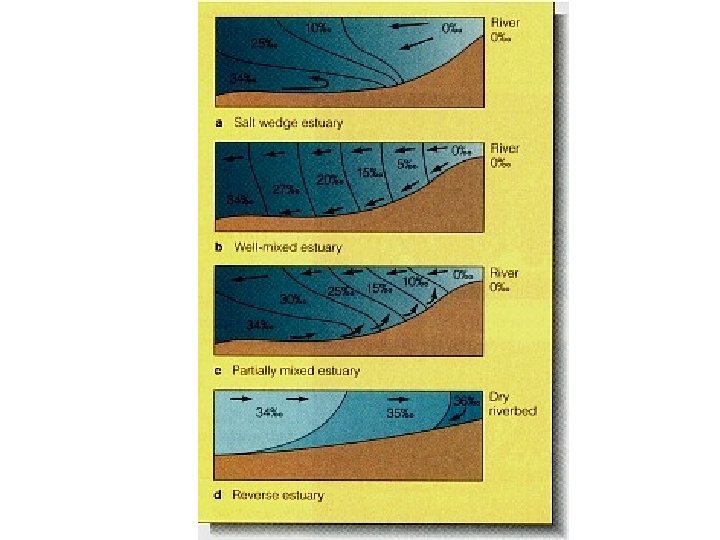
Classification • Estuaries can be grouped into classes, according to their circulation properties and the associated steady state salinity distribution. The most important estuary types are 1. salt wedge estuary (R>>V) 2. highly stratified estuary (R>V) 3. slightly stratified estuary (R<V) 4. vertically mixed estuary (R<<V) 5. inverse or reverse estuary (R=0)
Salt Wedge • River volume R is very much larger than the tidal volume V, or there are no tides at all. • The fresh water flows out over the sea water in a thin layer. • All mixing is restricted to the thin transition layer between the fresh water at the top and the "wedge" of salt water underneath. • Vertical salinity profiles therefore show zero salinity at the surface and oceanic salinity near the bottom all along the estuary. • The depth of the interface decreases slowly as the outer end of the estuary is approached • Mississippi and Congo Rivers
Salt Wedge
Highly Stratified Estuary • River volume R is comparable to but still larger than tidal volume V. • Strong velocity shear at the interface produces internal wave motion at the transition between the two layers. • The waves break and "topple over" in the upper layer, causing entrainment of salt water upward. • Entrainment is a one-way process, so no fresh water is mixed downward. • This results in a salinity increase for the upper layer, while the salinity in the lower layer remains unchanged, provided the lower layer volume is significantly larger than the river volume R and can sustain an unlimited supply of salt water • Examples of this type of estuary are fjords, which are usually very deep and have a large salt water reservoir below the upper layer.
Fjord-Type Estuary
Slightly Stratified Estuary • River volume R is small compared to tidal volume V. • The tidal flow is turbulent through the entire water column (the turbulence induced mainly at the bottom). • As a result, salt water is stirred into the upper layer and fresh water into the lower layer. • Salinity therefore changes along the estuary axis not only in the upper layer but in both layers • This type of estuary is widespread in temperate and subtropical climates
Vertically Mixed Estuary • River volume R is insignificant compared with tidal volume V. • Tidal mixing dominates the entire estuary. • Locally it achieves complete mixing of the water column between surface and bottom, erasing all vertical stratification. • As a result, vertical salinity profiles show uniform salinity but a salinity increase from station to station as the outer end of the estuary is approached • This type of estuary is found in regions of particularly strong tides; an example is the River Severn in England.
Well Mixed
Slightly Mixed
Inverse or Reverse Estuaries • These estuaries have no fresh water input from rivers and are in a region of high evaporation. • Surface salinity does not decrease from the ocean to the inner estuary, but water loss from evaporation leads to a salinity increase as the inner end of the estuary is approached • This results in a density increase and sinking of high salinity water at the inner end. • As a result, movement of water is directed inward at the surface and towards the sea at the bottom, with sinking at the inward end.
Flushing Time? • Considered the amount of time in which all water is totally exchanged in an estuary • Varies according to the estuary due to ocean access, freshwater runoff (called inflow) and depth of the estuary t. F = VF / R t. F is the flushing time Vf is the freshwater volume R is the river discharge rate
Flushing Time* Comparisons Estuary Minimum Maximum Mean Chesapeake Bay, MD-VA 210 days (Guo) Delaware Bay, DE-NJ 100 days (Delaware Estuary Program) Barnegat Bay, NJ 24 days (January 1995) 74 days (June/July 1995) 49 days (Guo) North River, MA 3 days (Geyer) 9 days (Geyer) Not determined