
ESTIMATION PSYSTA 1 Week 9 CONSIDER UNIVERSITY PROFESSORS
- Slides: 11
ESTIMATION PSYSTA 1 – Week 9
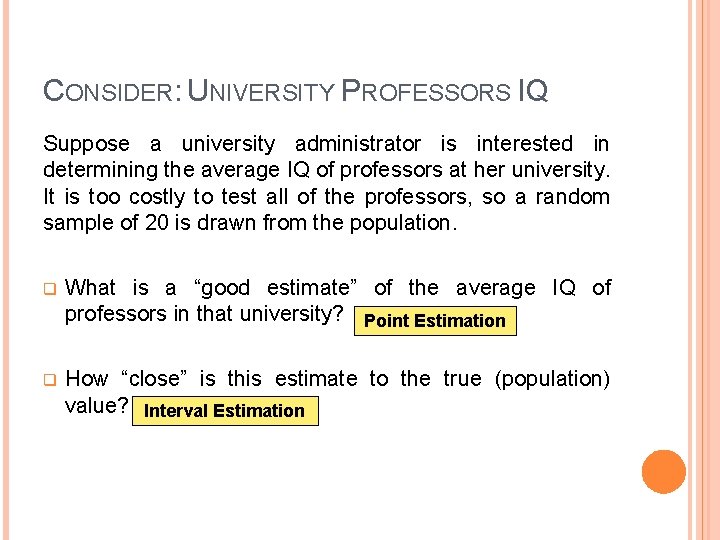
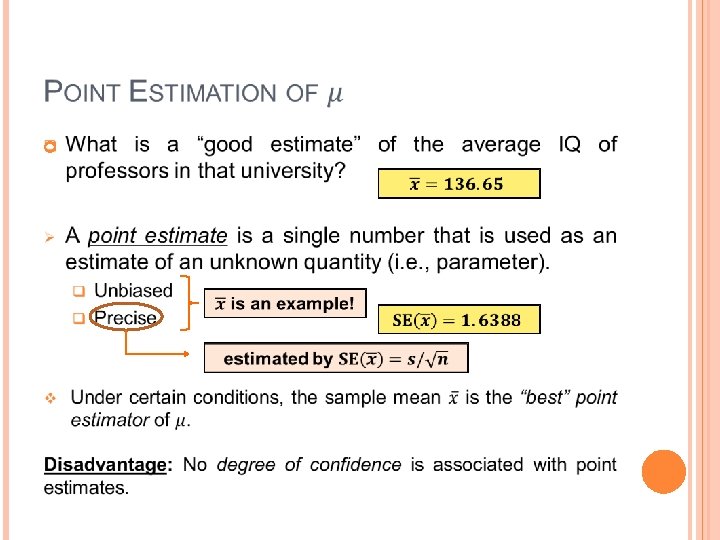
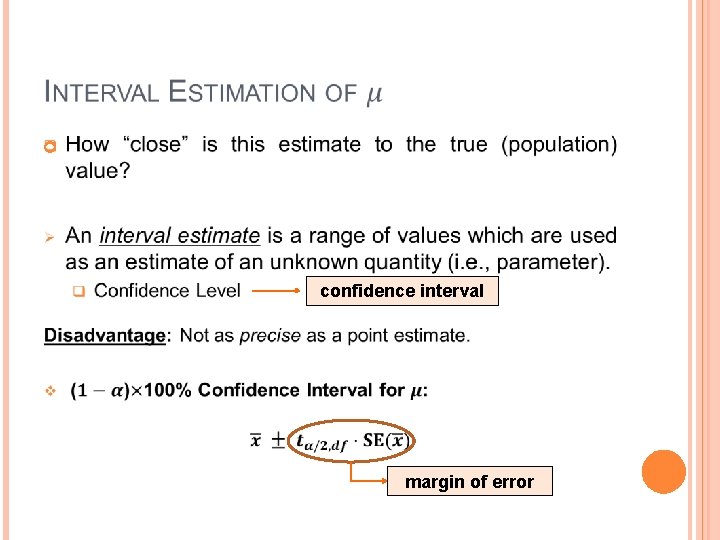
CONSIDER: UNIVERSITY PROFESSORS IQ Suppose a university administrator is interested in determining the average IQ of professors at her university. It is too costly to test all of the professors, so a random sample of 20 is drawn from the population. q What is a “good estimate” of the average IQ of professors in that university? Point Estimation q How “close” is this estimate to the true (population) value? Interval Estimation
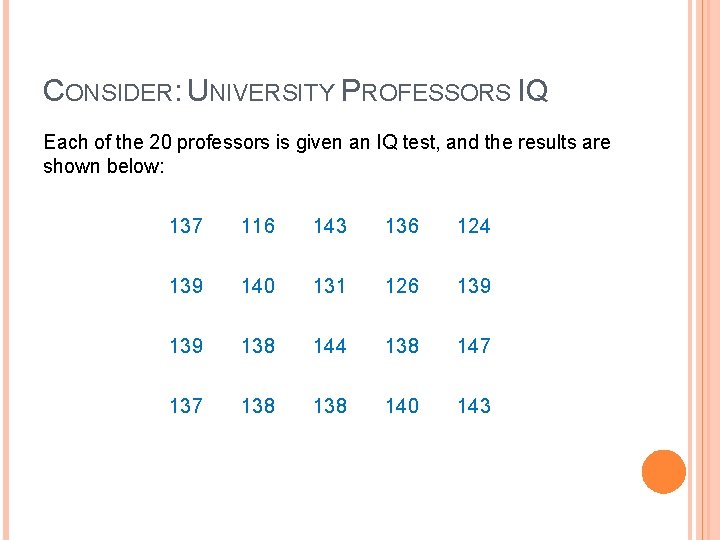
CONSIDER: UNIVERSITY PROFESSORS IQ Each of the 20 professors is given an IQ test, and the results are shown below: 137 116 143 136 124 139 140 131 126 139 138 144 138 147 138 138 140 143
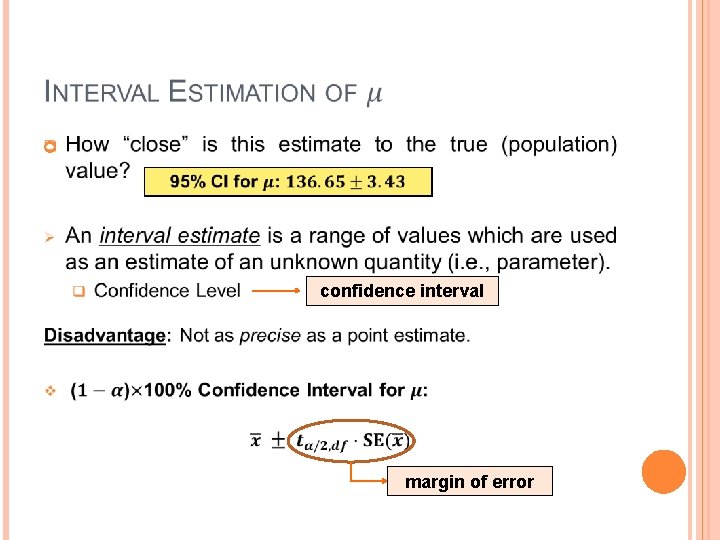
confidence interval margin of error
confidence interval margin of error
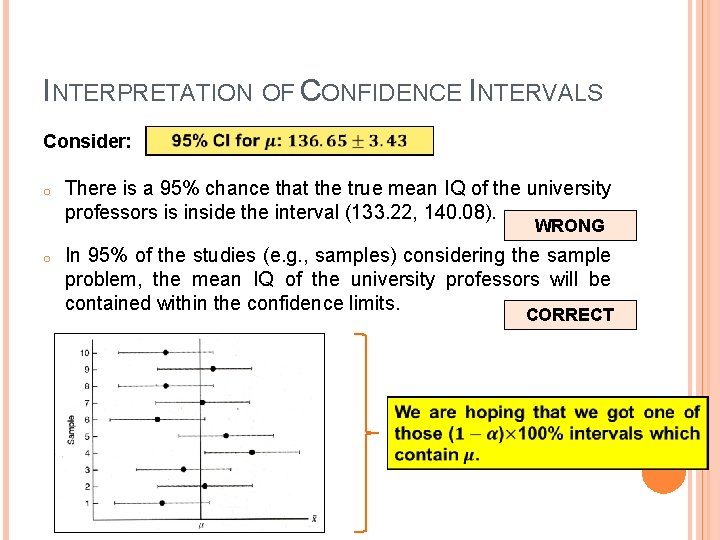
INTERPRETATION OF CONFIDENCE INTERVALS Consider: o There is a 95% chance that the true mean IQ of the university professors is inside the interval (133. 22, 140. 08). WRONG o In 95% of the studies (e. g. , samples) considering the sample problem, the mean IQ of the university professors will be contained within the confidence limits. CORRECT
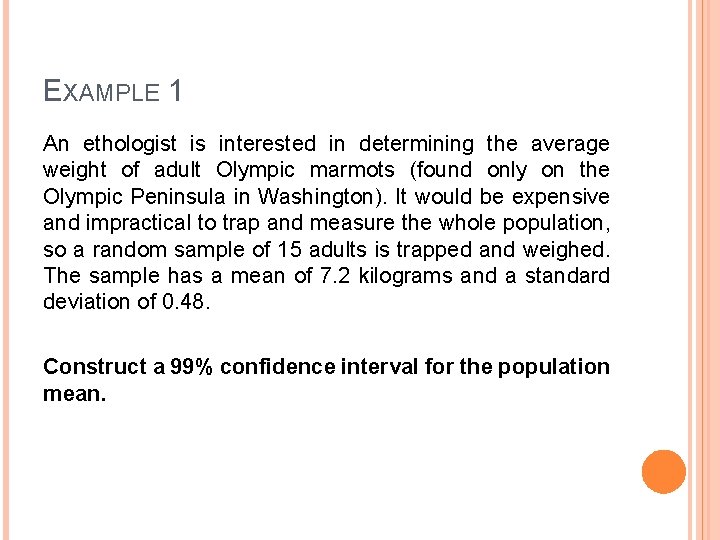
EXAMPLE 1 An ethologist is interested in determining the average weight of adult Olympic marmots (found only on the Olympic Peninsula in Washington). It would be expensive and impractical to trap and measure the whole population, so a random sample of 15 adults is trapped and weighed. The sample has a mean of 7. 2 kilograms and a standard deviation of 0. 48. Construct a 99% confidence interval for the population mean.
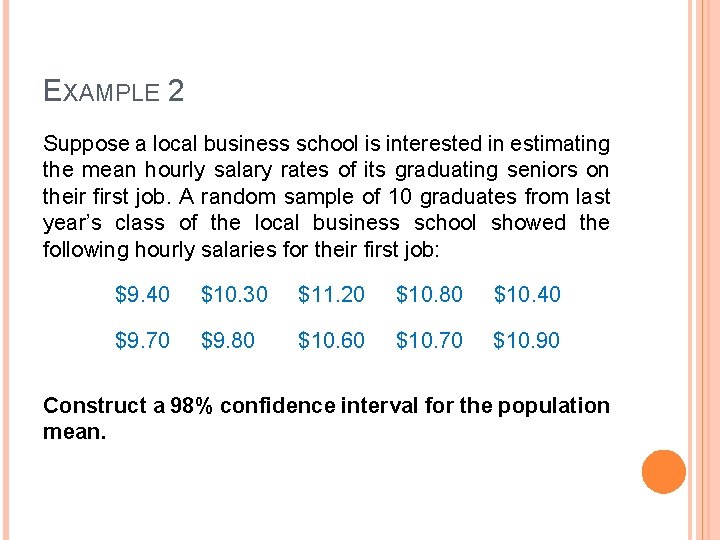
EXAMPLE 2 Suppose a local business school is interested in estimating the mean hourly salary rates of its graduating seniors on their first job. A random sample of 10 graduates from last year’s class of the local business school showed the following hourly salaries for their first job: $9. 40 $10. 30 $11. 20 $10. 80 $10. 40 $9. 70 $9. 80 $10. 60 $10. 70 $10. 90 Construct a 98% confidence interval for the population mean.
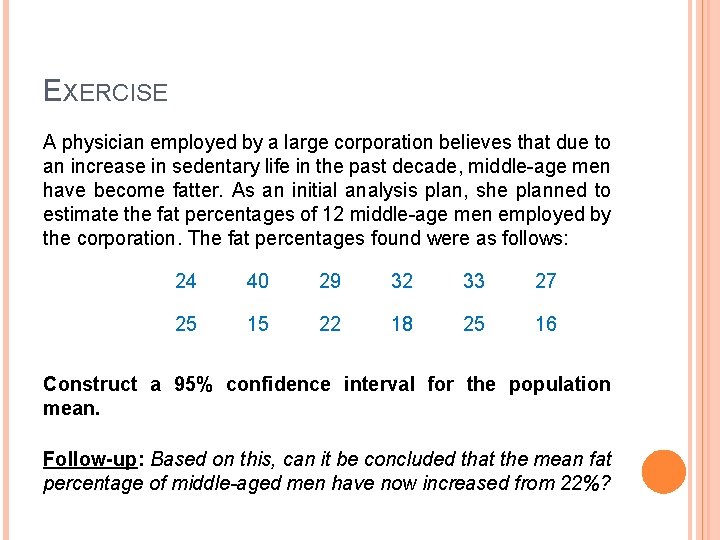
EXERCISE A physician employed by a large corporation believes that due to an increase in sedentary life in the past decade, middle-age men have become fatter. As an initial analysis plan, she planned to estimate the fat percentages of 12 middle-age men employed by the corporation. The fat percentages found were as follows: 24 40 29 32 33 27 25 15 22 18 25 16 Construct a 95% confidence interval for the population mean. Follow-up: Based on this, can it be concluded that the mean fat percentage of middle-aged men have now increased from 22%?