ESTIMATING WOODY BROWSE ABUNDANCE IN REGENERATING CLEARCUTS USING

ESTIMATING WOODY BROWSE ABUNDANCE IN REGENERATING CLEARCUTS USING AERIAL IMAGERY Shawn M. Crimmins, Alison R. Mynsberge, Timothy A. Warner

INTRODUCTION Timber harvest • Common in eastern hardwood forests • Can create wildlife habitat • Abundance of available forage • Assessment of forage abundance • Time consuming, labor intensive field work • Method to quantify browse remotely? •

INTRODUCTION Remote sensing in forestry • Forest species classification • Forest health • Forest regeneration • Remote sensing in wildlife • Habitat classification • Habitat quality? •

OBJECTIVE Use readily available aerial imagery to estimate the abundance of woody browse in regenerating clearcuts •
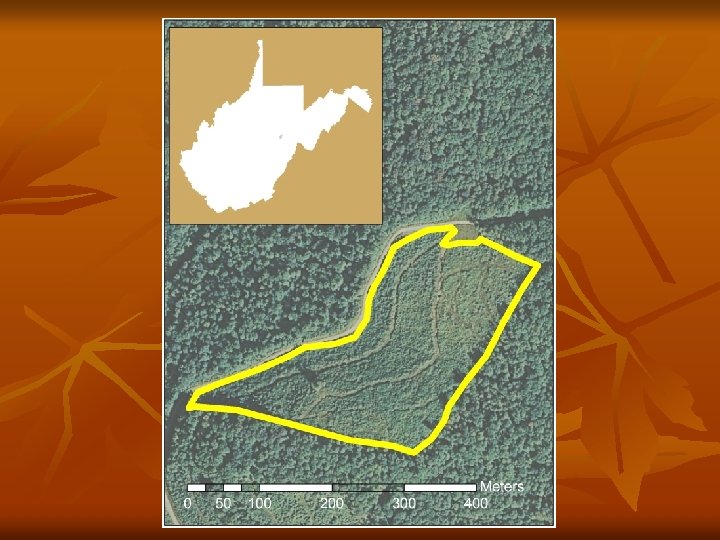
 Wildlife and Ecosystem Research Forest • 3413 hectares")
STUDY AREA Penn-Virginia (formerly Mead. Westvaco) Wildlife and Ecosystem Research Forest • 3413 hectares • Randolph County, WV • Northern hardwood forest community • Actively harvested • Dominated by clearcutting •
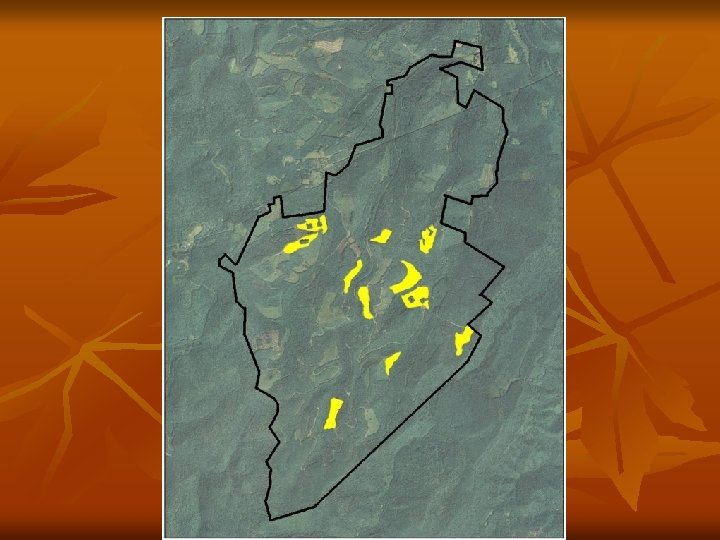

METHODS 12 regenerating clearcuts • Surveyed as part of large-scale deer research • 6 age classes (0 – 5 years post harvest) • 2 cuts in each class • 30 plots in each cut (15 edge, 15 interior), 0. 5 m 2 • Identified and counted all woody stems < 1. 5 m • Maximum browse height of deer • Variable of interest •

METHODS
 • 2 meter resolution •")
METHODS Aerial imagery • National Agriculture Imagery Program (USDA) • 2 meter resolution • Visible spectrum only • Taken on September 24 (37 days after last field survey) • Chosen due to availability • Publicly available • Representative of data available to forest/wildlife managers •

METHODS Generated 12 image metrics • Mean and variance • Red, Green, Blue • Ratios calculated, but abandoned later • Hand digitized clearcuts in Arc. GIS 9. 1 • Multiple Linear Regression (PROC REG) • Forward variable selection • α = 0. 10 for entry into model •

RESULTS Censored one cut from analysis due to excessive shadows covering edge plots • Ratio terms removed • Insufficient degrees of freedom • 12 predictor variables • 11 observations •
 • Variable Estimate p Intercept")
RESULTS Forward selection-first step (r 2 = 0. 5109) • Variable Estimate p Intercept 261. 42376 0. 0052 Red-mean -1. 82409 0. 0134 • Forward selection-second step (r 2 = 0. 7684) Variable Estimate p Intercept 424. 79332 0. 0005 Red-mean -2. 38020 0. 0010 Green-variance -0. 12022 0. 0175
 • Variable Estimate p Intercept")
RESULTS Forward selection-third step (r 2 = 0. 8953) • Variable Estimate p Intercept 345. 49928 0. 0007 Red-mean -1. 93586 0. 0013 Blue-variance 0. 13138 0. 0226 Green-variance -0. 19743 0. 0015
 • Variable Estimate p Intercept")
RESULTS Forward selection-final step (r 2 = 0. 9375) • Variable Estimate p Intercept 240. 05731 0. 0166 Red-mean -2. 23253 0. 0006 Blue-variance 0. 16328 0. 0072 Green-mean 0. 81805 0. 0910 Green-variance -0. 18525 0. 0014 • Variable selection summary Variable Partial r 2 F value Red-mean 0. 5109 9. 40 Blue-variance 0. 2575 8. 90 Green-mean 0. 1269 8. 48 Green-variance 0. 0422 4. 04
 • • Global model (p = 0.")
RESULTS Final model (p = 0. 0009) • • Global model (p = 0. 0062, r 2 = 0. 9671)

RESULTS Accurate across abundances •
 predictive accuracy • Minimal complexity • 4")
DISCUSSION High (r 2 > 0. 9) predictive accuracy • Minimal complexity • 4 predictor variables • Visible spectrum • Normally distributed error term • Slight deviance in tails • Low abundance sites (logging slash) • High abundance sites (canopy growth) •

DISCUSSION Visible spectrum only • Available in almost all imagery • Still allowed high predictive accuracy • Lack of IR bands (required for NDVI) • Growth > 1. 5 meters • Technique available to most managers • No knowledge of remote sensing/GIS required •

FUTURE DIRECTIONS Temporal replication • Only 1 year • Track individual cuts across growing seasons • Spatial replication • Local weather/climate affecting growth? • Different forest types? •

ACKNOWLEDGMENTS Matt Shumar, Chris Runner • Mead. Westvaco Corporation • West Virginia Division of Natural Resources • WVU • Division of Forestry and Natural Resources • Cooperative Fisheries & Wildlife Research Unit • Department of Geology and Geography • WV View •

QUESTIONS?
- Slides: 22