Estimating the effects of copy number variants on

Estimating the effects of copy number variants on intelligence quotient using hierarchical Bayesian models LAI JIANG LADY DAVIS INSTITUTE, MCGILL UNIVERSITY

Outline Context and Problem Data sets ◦ IMAGEN ◦ Saguenay Youth Study ◦ (Generation Scotland) Hierarchical Bayesian model Results Discussion

Copy number variation Image from MDPI

Variation in copy number: Small : ‘indel’ AAACATAAAGA AAACAAGA 3 bp deletion AAACATATCTTAAGA 4 bp insertion Medium-sized : « CNVs» Often inferred from genotyping data Large : chromosomal re-arrangements
 Score derived from standardized tests designed to assess general intelligence. ◦")
Intelligence Quotient (IQ) Score derived from standardized tests designed to assess general intelligence. ◦ General population mean = 100 ◦ General population standard deviation = 15 First behavioral trait studied ◦ Spearman, 1904; Binet, 1905 Associated with many physical and mental illnesses Strong genetic contribution (80%) ◦ Plomin, 2015 Sub-scores: ◦ Verbal IQ (VIQ) ◦ Non-verbal or Performance IQ (PIQ)
 N = 2090 adolescents Wechsler")
Data Sets Sample Measure of intelligence Genotyping IMAGEN (Europe) N = 2090 adolescents Wechsler IQ (verbal and performance) Illumina 610 K Saguenay Youth Study (Quebec) N = 1983 (486 Wechsler IQ families) (verbal and performance) Illumina 610 K (N=599); Human. Omni. Expres s Beadchip (N=1395) Generation Scotland (Scotland) N = 13, 597 Human Omni Express Exome-8 G-score

Team Sebastien Jacquemont, Ste. Justine Hospital, Montreal ◦ Guillaume Huguet, Catherine Schramm Tomas Paus, Baycrest Centre for Geriatric Care, Toronto Zdenka Pausova, Hospital for Sick Children, Toronto Gunter Schumann, King’s College London, UK Ian Deary, University of Edinburgh, UK Aurélie Labbe, HEC, Montreal Celia Greenwood, Jewish General Hospital, Montreal • Lai Jiang, postdoctoral fellow

Calling CNVs from genotyping data Algorithms: Penn. CNV and Quanti. SNP Cleaning here: At least 50 Kb in size Partially overlapping CNVs were merged Manually curated for rare and psychiatric CNVs De novo deletions: From Huguet et al. 2018; JAMA Psychiatry

IMAGEN and SYS - numbers of CNVs

Context: CNVs contribute to neurodevelopmental disorders ◦ Intellectual disability ◦ Autism spectrum disorders ◦ Schizophrenia Impact of most identified CNVs is unknown ◦ Unique to family seen in clinic ◦ Extremely rare Goal: predict effect of CNVs on IQ and other neurodevelopmental traits ◦ i. e. Predict effect of rare features

Can predictions be based on annotation information? Schematic layout of region deleted or duplicated in the “reference” genome Gene 1 Gene 2 Gene 3 • Size of CNV; Number of genes in CNV; • Expected deleterious effects of mutations in each gene and other gene-based annotation scores • e. QTL for genes expressed in brain

Details Scores included ◦ Mutation Intolerance scores ◦ p. LI: Lek et al. 2016; RVIS: Petrovski et al. 2013; DEL: Ruderfer et al. 2016) ◦ Number of protein-protein interactions ◦ PPI: Szklarczyk et al. , 2015 ◦ Differential stability (DS) ◦ DS: Hawrylycz et al. 2015 ◦ Genes involved in postsynaptic density of the human cortex ◦ PSD: Bayés et al. 2011 ◦ Genes regulated by protein FMRP ◦ FMRP: Darnell et al. 2011 ◦ Expression quantitative trait loci (e. QTL) expressed in brain Some CNVs contained no genes ◦ Most models assumed all gene scores were zero except for e. QTL

Details: scoring CNVs CNV 1 Gene 1 score gene 1 Gene 2 + CNV 2 score gene 2 Gene 3 score gene 3 score CNV 1 + Gene 4 + score gene 4 Gene 5 + score gene 5 score CNV 2 score individual 1 Annotation by individual Removed individuals carrying very large CNVs (>10 MB) Deletions and duplications were analyzed separately Huguet G. , Schramm C. , Douard E. et al; 2018 JAMA Psy

Hypothesis 1
 JAMA Psychiatry Stepwise regression")
IMAGEN and SYS – linear model Huguet et al. (2018) JAMA Psychiatry Stepwise regression ◦ One annotation feature predicted IQ : p. LI ◦ the probability of being “loss of function intolerant”. ◦ PIQ: Slope = − 2. 74, SE = 0. 68, p=8 x 10 -5 ◦ VIQ: Slope - -2. 52, SE = 0. 71, p= 7 x 10 -4

IMAGEN and SYS Figure 2 from Huguet et al. 2018
 unsatisfactory")
Possible deficiencies of Model Effects of individual CNVs are lost Interpretation is (possibly) unsatisfactory

Hypothesis 2

Estimation :

Skewed distributions of scores

Correlated scores
: PCA of annotation scores Scree plot of all scores Scree plot")
Model tweaks (2): PCA of annotation scores Scree plot of all scores Scree plot of mutation severity scores
 Winsorizing RED: log GREEN: square root BLUE: winsorized")
Model tweaks: (1) Winsorizing RED: log GREEN: square root BLUE: winsorized

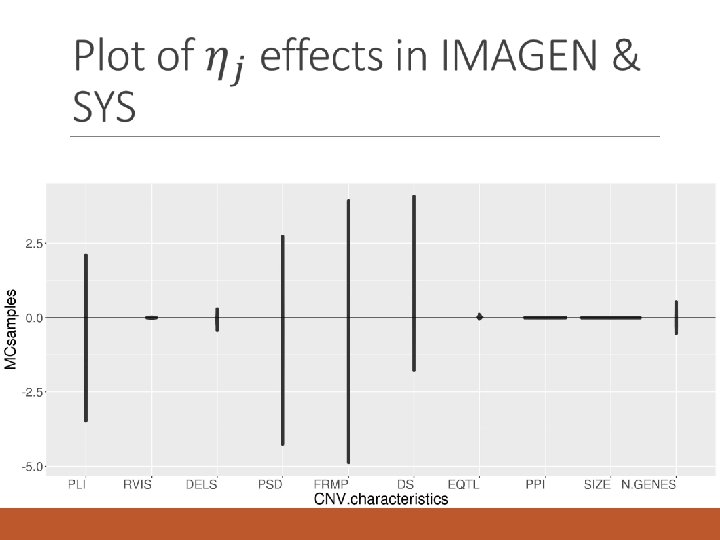
IMAGEN and SYS – Model 1 Bayesian R 2 =0. 014 PC. mut: 1 st PC of p. LI, RVIS, DEL, mutation intolerance PSD: post-synaptic density of the cortex FRMP: Genes regulated by FRMP protein DS: Differential stability score EQTL: expression quantitative trait locus PPI: protein-protein interactions PC. size. genes: 1 st principal component of size and number of genes in CNV Gene. ind: # of genes and indels in CNV
 : Non-linear transformations")
Model tweaks (3) : Non-linear transformations
 : Non linear transformations")
Model tweaks (3) : Non linear transformations

Normal 2. 09% Sigmoid Normal -0. 02% Normal Sigmoid -0. 18% Sigmoid 0. 25%

IMAGEN and SYS: concordance

IMAGEN and SYS: Manhattan

Validation in Generation Scotland Deletions: 0 – 6 person with mean 0. 60 Duplications: 0 – 7 person with mean 0. 64 Analysis is ongoing

Generation Scotland – G factor First PC of several cognitive evaluation tests ◦ Zscore (Logical Memory Immediate + Logical Memory Delay) ◦ Zscore (Digit-Symbol Coding) ◦ Zscore (Verbal Fluency total) ◦ Zscore (Mill Hill Vocabulary) Typical correlations with IQ ◦ 0. 4 - 0. 5

Discussion Estimating the effects of rare events is always difficult – by definition! The Bayesian approach allows us to obtain estimates for each CNV, ◦ but of course the priors play a larger role when the CNV is extremely rare For prediction purposes, the Bayesian model may not be the best choice ◦ However, for inferring new genomic regions, it may have promise
 Guillaume Huguet (postdoc) Sebastien Jacquemont")
www. mcgill. ca/statisticalgenetics Acknowledgements Celia Greenwood Catherine Schramm (postdoc) Guillaume Huguet (postdoc) Sebastien Jacquemont Aurélie Labbe
- Slides: 34