Estimates of Global Sea Level Change from Tide

Estimates of Global Sea Level Change from Tide Gauges Sampling Issues 20 th Century Global Sea Level (GSL) Rise Estimates • Average of Trends (Douglas et al) • GSL Recontructions (Church et al) Unresolved Vertical Land Motion - main uncertainty

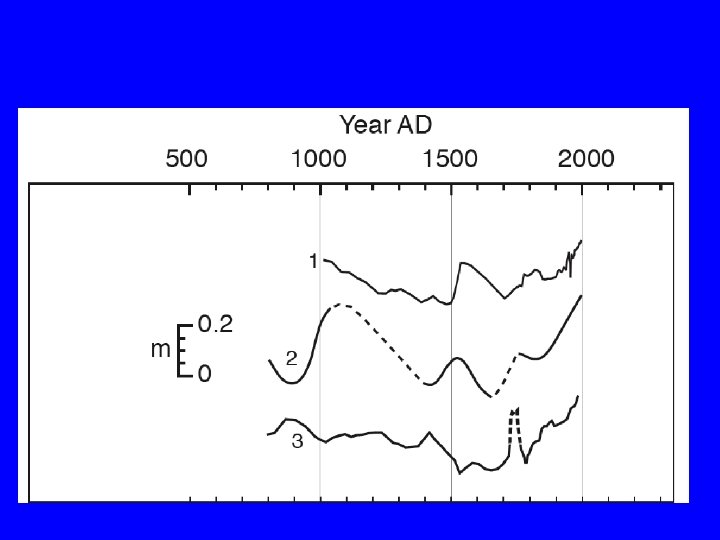
Longest records suggest rate increase in the 1900 s relative to the 1800 s Woodworth (1999)
 Halifax tide gauge (open")
Tide Gauge and Geological Records: Nova Scotia Reconstruction (black circles) Halifax tide gauge (open circles) Gehrels et al. (2005)
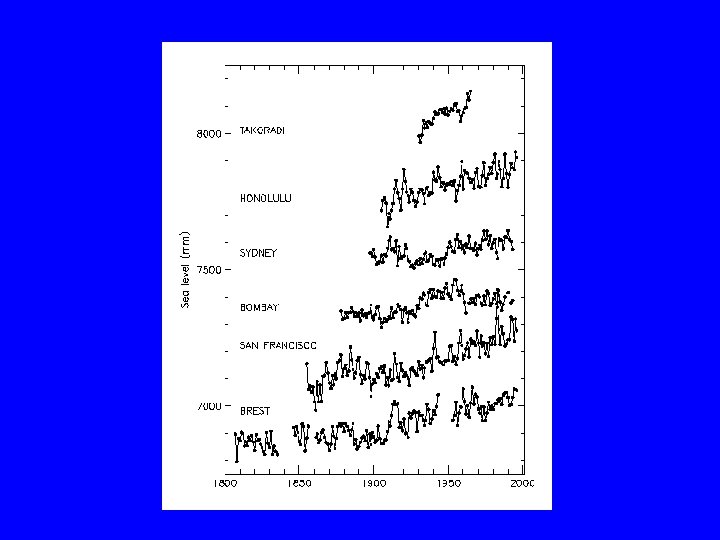

PSMSL Database
")
Church and White (2006)

Interdecadal Variability San Diego San Francisco Honolulu

San Franciso Honolulu Firing et al. , 2004

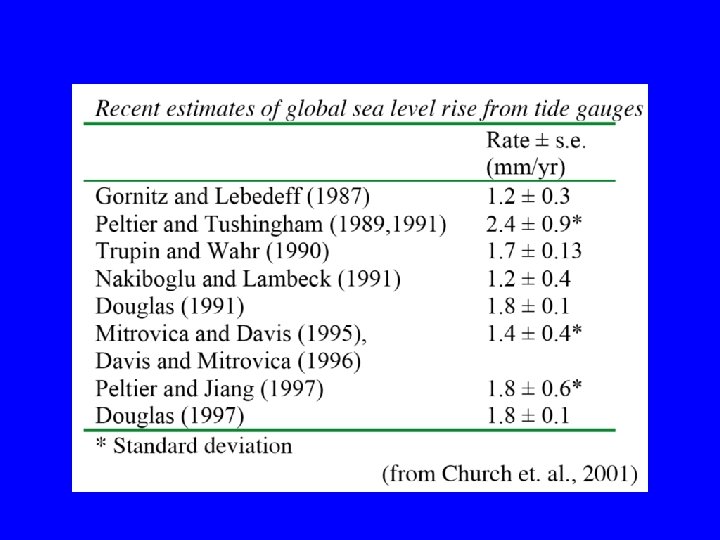
Estimate GSL Change as the average of linear trends from selected tide gauges • Requires long records (> 60 years) at “stable” sites resulting in poor spatial coverage, few degrees of freedom • Ground motion correction specified using Global Isostatic Adjustment (GIA) models
 Average = 1. 84± 0. 35 mm/yr Record lengths:")
Douglas - GIA (Peltier, 2001) Average = 1. 84± 0. 35 mm/yr Record lengths: 72 -97 years
 Average of overlapping decadal trends within each region after subtracting")
Holgate and Woodworth (2004) Average of overlapping decadal trends within each region after subtracting long-term trend. 177 stations from 14 regions.

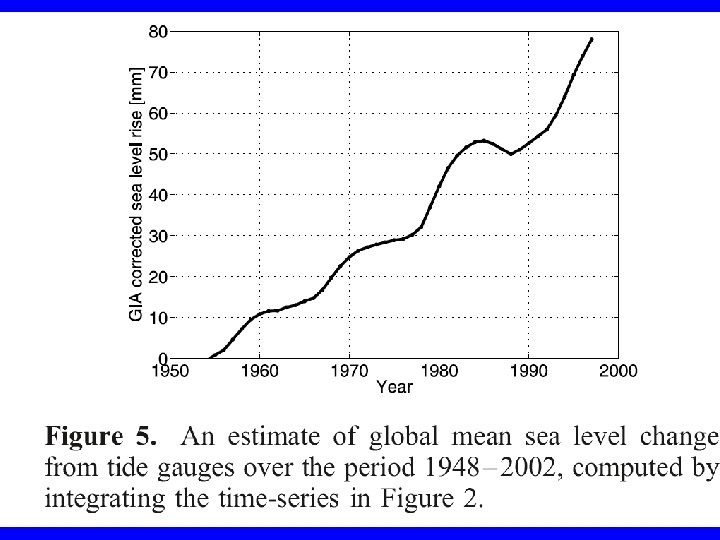
Average decadal trends, Overall average = 1. 7 mm/yr Estimated GSL change 1948 -2002 Holgate and Woodworth (2004)
, Church et al. (2004), Church and White (2006)")
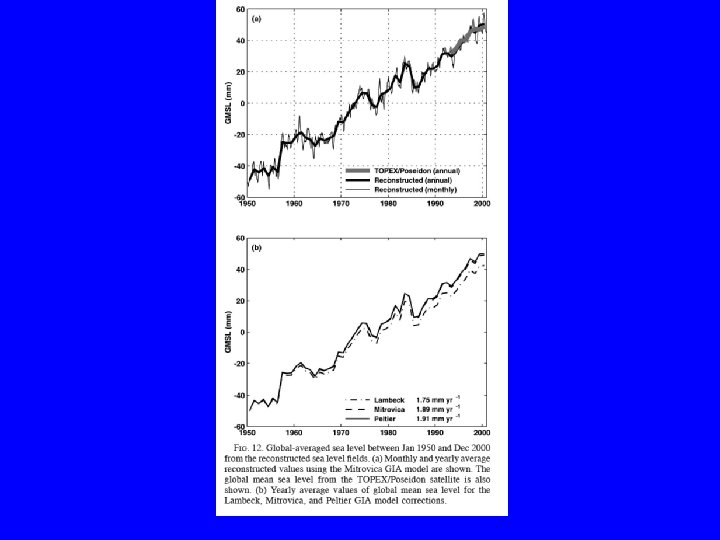
GSL Reconstruction Chambers et al. (2002), Church et al. (2004), Church and White (2006) • Fit T/P EOFs to tide gauge first-differenced time series • Can include more stations, variable number of stations over time • Explicit model of redistribution signal, assumes T/P modes are representative of past sea level variability

1870 -1935: 0. 71± 0. 40 mm/yr 1936 -2001: 1. 84 ± 0. 19 mm/yr 1950 -2000: 1. 75 ± 0. 4 mm/yr Consistent with Douglas et al. (1991, 2001), Peltier (2001), Holgate and Woodworth (2004) Church and White (2006)

Trend primarily from EOF 0 Redistribution modes non-stationary Remains an average of tide gauge records and the number of stations is a concern prior to 1950

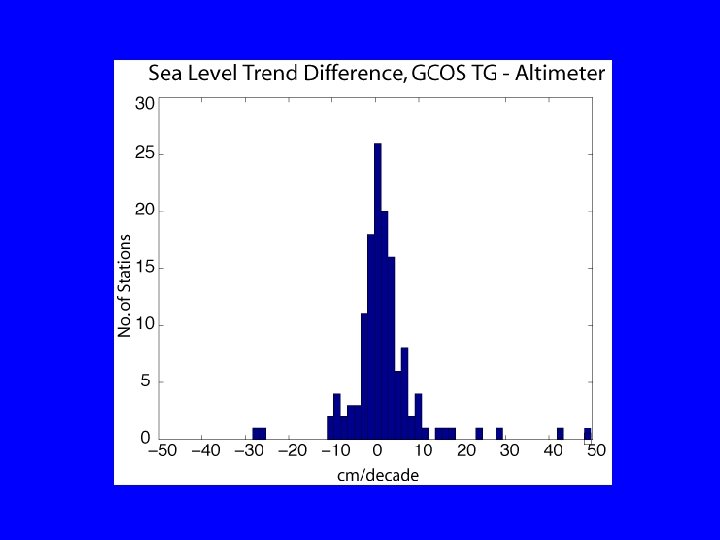
Trend of Sea Level Difference, Tide Gauge - T/P, Jason
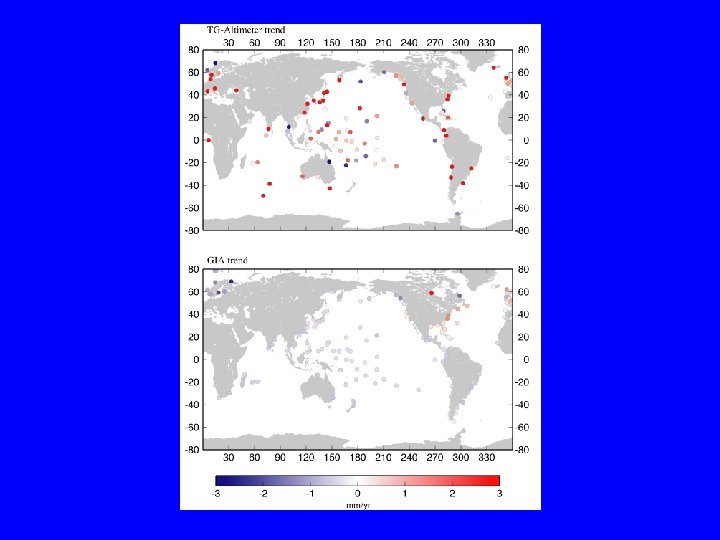

CGPS Vertical Rates Relative to Regional Reference Frame Valparaiso, Chile: TG - ALT = 5. 65 mm/yr CGPS = -6. 4 mm/yr Foster et al. (2006)
")
Church and White (2006)

Land Motion and Sea Level Trends at Hawaii
")
Steric Trends, World Ocean Atlas Caccamise et al. (2004)

Summary • Different analyses of RLR dataset yield consistent 1. 7 -1. 8 mm/yr GSL rise over last half of the 20 th century • Faster rise rate in 1900 s than 1800 s in North Atlantic records - need for more georeconstructions in undersampled regions • GSL reconstructions highlight interdecadal component, possible 20 th century acceleration • Major uncertainty is unresolved Vertical Land Motion, need for direct measurements
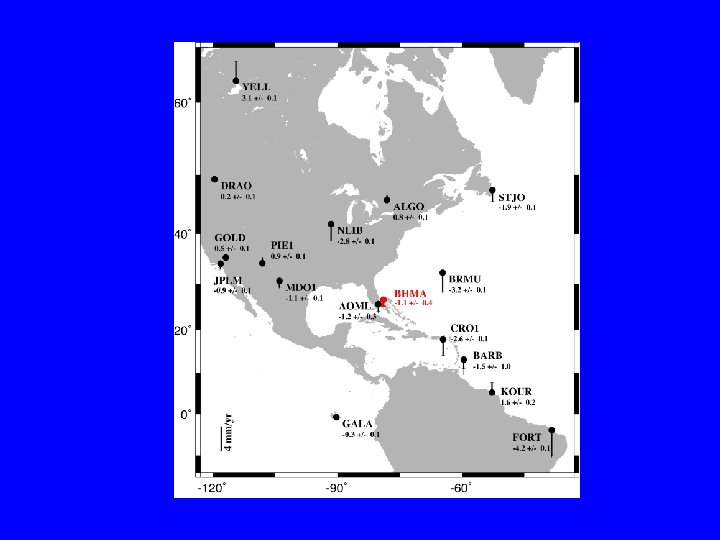

GPS Velocities Hilo-Honolulu Differential Sea Level* 1. 9 ± 0. 9 mm/yr GPS -0. 4 ± 0. 4 mm/yr 95% Confidence intervals. KOKB -0. 2 mm/yr KOK 1 -1. 2 mm/yr HNLC -1. 4 mm/yr MAUI -1. 5 mm/yr MKEA -1. 8 mm/yr HILO -1. 9 mm/yr * entire time series

GSL change 1948 -2002

Trend Changes 1945 -2002 Computation of the average rate of relative sea level rise from time t 0 to Dec. 2002, for various starting times t 0, as well as the associated 95% confidence interval

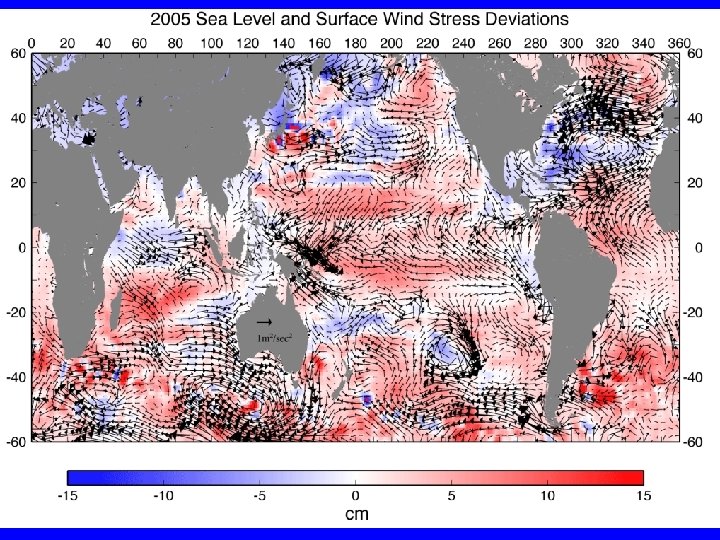
TOPEX/Poseidon SSH Trends
- Slides: 33