
Essentials of Climate Modelling and Intro to PRECIS


- Slides: 50
Essentials of Climate Modelling and Intro to PRECIS RCM Data Analysis and postprocessing workshop Malaysian Met. Department, Nov 2012 © Crown copyright Met Office
Essentials of Climate Modelling The goal of this session is a brief introduction to: • the PRECIS regional climate model • the climate system • climate variability • modelling of the climate system • climate of the past • projection of future climate © Crown copyright Met Office
PRECIS © Crown copyright Met Office
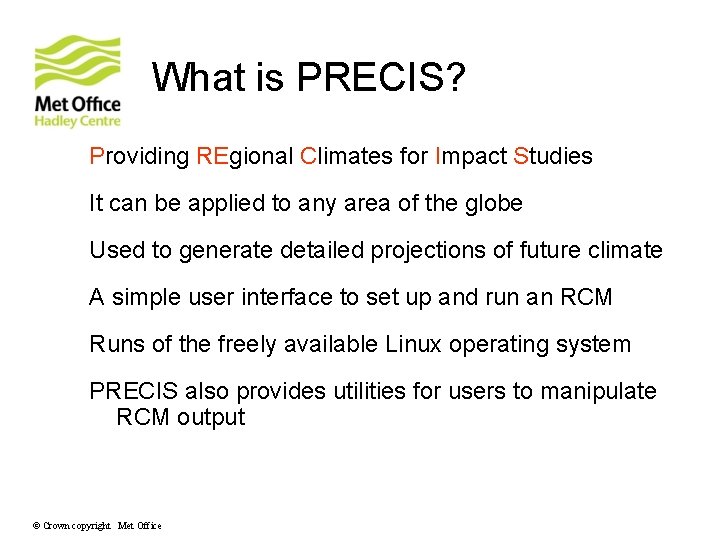
What is PRECIS? Providing REgional Climates for Impact Studies It can be applied to any area of the globe Used to generate detailed projections of future climate A simple user interface to set up and run an RCM Runs of the freely available Linux operating system PRECIS also provides utilities for users to manipulate RCM output © Crown copyright Met Office
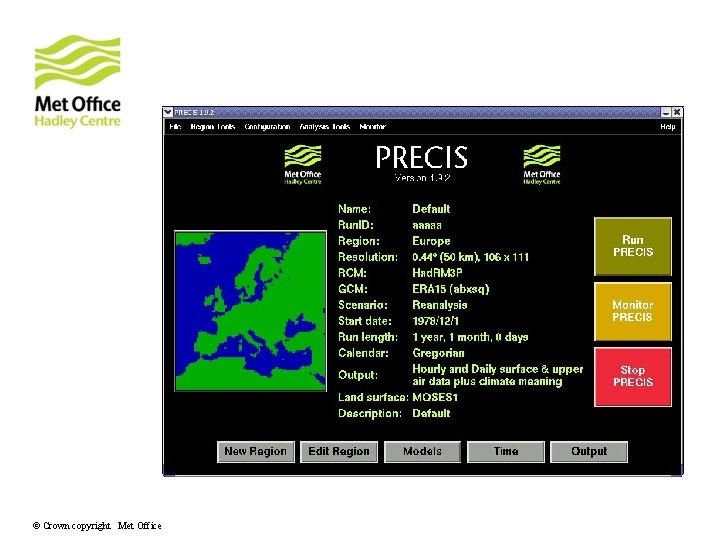
The PRECIS user interface © Crown copyright Met Office
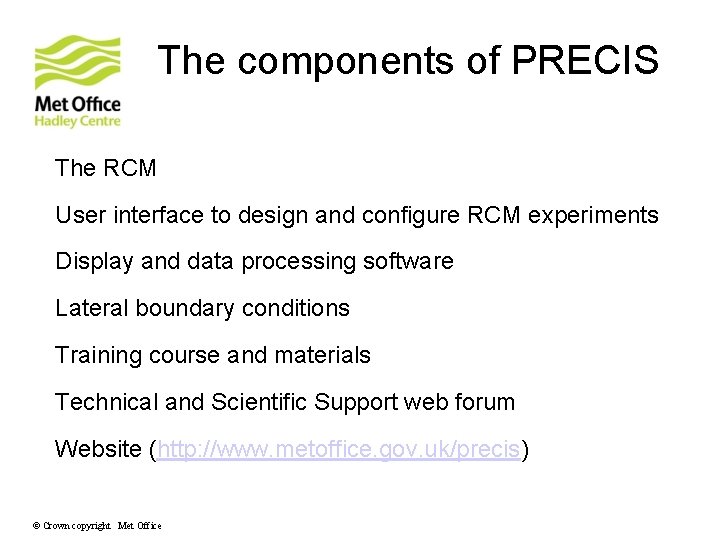
The components of PRECIS The RCM User interface to design and configure RCM experiments Display and data processing software Lateral boundary conditions Training course and materials Technical and Scientific Support web forum Website (http: //www. metoffice. gov. uk/precis) © Crown copyright Met Office
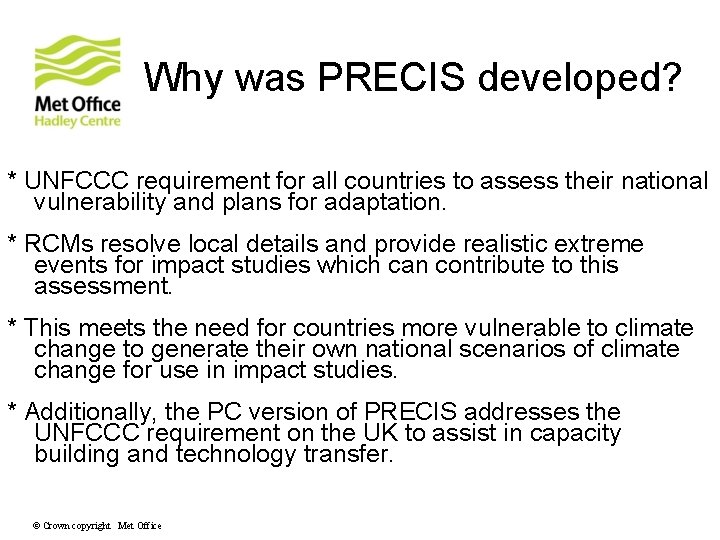
Why was PRECIS developed? * UNFCCC requirement for all countries to assess their national vulnerability and plans for adaptation. * RCMs resolve local details and provide realistic extreme events for impact studies which can contribute to this assessment. * This meets the need for countries more vulnerable to climate change to generate their own national scenarios of climate change for use in impact studies. * Additionally, the PC version of PRECIS addresses the UNFCCC requirement on the UK to assist in capacity building and technology transfer. © Crown copyright Met Office
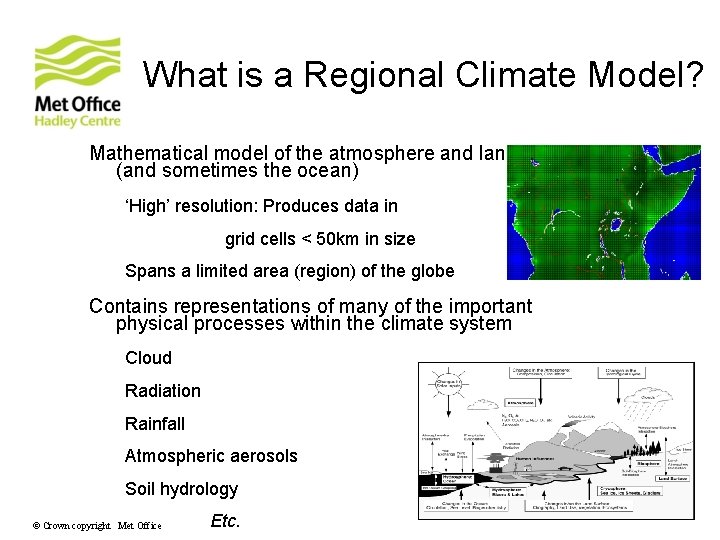
What is a Regional Climate Model? Mathematical model of the atmosphere and land surface (and sometimes the ocean) ‘High’ resolution: Produces data in grid cells < 50 km in size Spans a limited area (region) of the globe Contains representations of many of the important physical processes within the climate system Cloud Radiation Rainfall Atmospheric aerosols Soil hydrology © Crown copyright Met Office Etc.
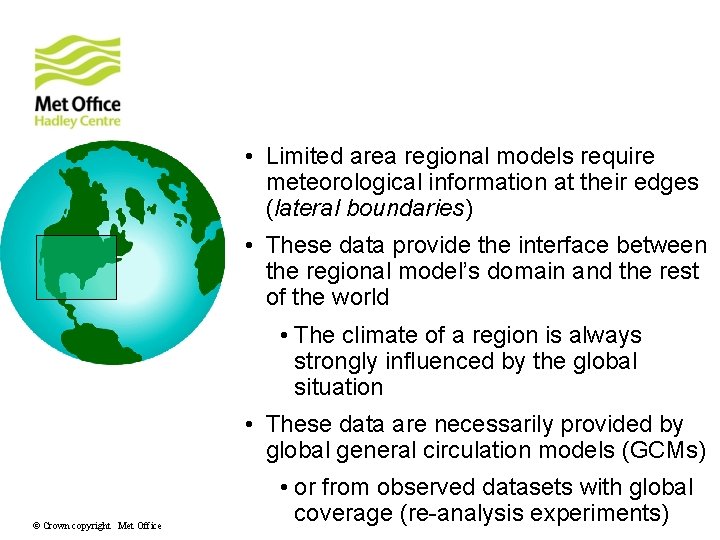
Boundary conditions • Limited area regional models require meteorological information at their edges (lateral boundaries) • These data provide the interface between the regional model’s domain and the rest of the world • The climate of a region is always strongly influenced by the global situation • These data are necessarily provided by global general circulation models (GCMs) © Crown copyright Met Office • or from observed datasets with global coverage (re-analysis experiments)
Future developments * Continuously upgraded to new processors/new Linux * PRECIS version 2. 0 – the Had. RM 3 P RCM driven by CMIP 5/AR 5 GCMs * PRECIS version 3. 0 – the Had. GEM 3 -RA RCM (derived from the Had. GEM 3 GCM) driven by CMIP 5/AR 5 GCMs © Crown copyright Met Office
The Climate System © Crown copyright Met Office
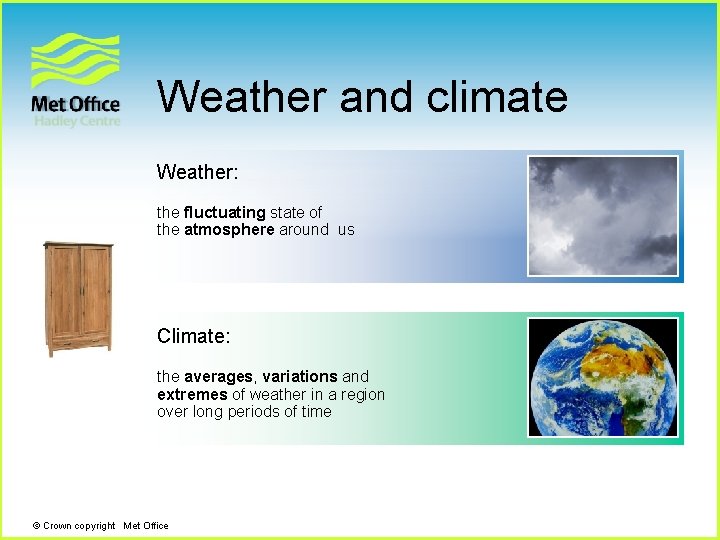
Weather and climate Weather: the fluctuating state of the atmosphere around us Climate: the averages, variations and extremes of weather in a region over long periods of time © Crown copyright Met Office
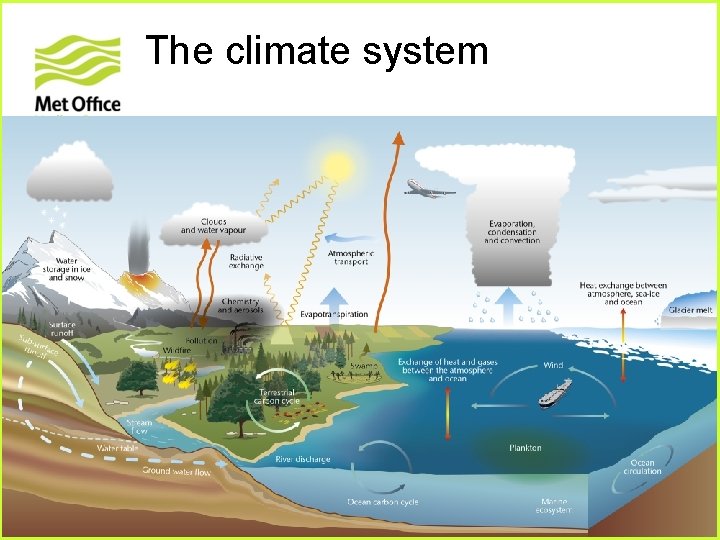
The climate system © Crown copyright Met Office
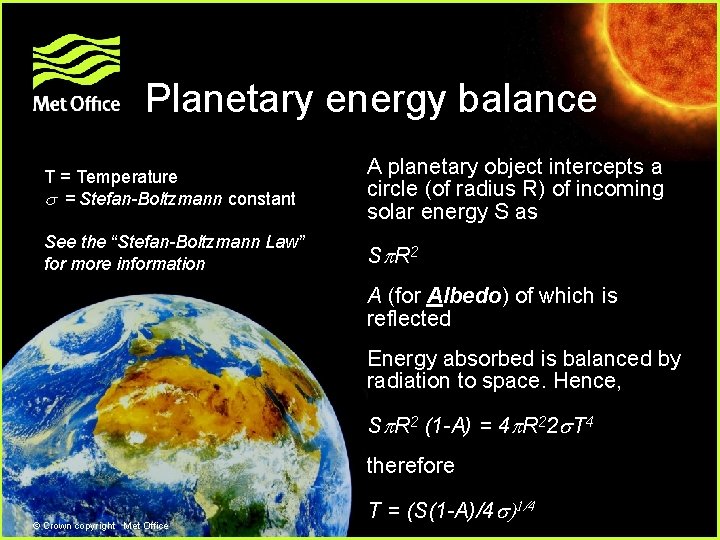
Planetary energy balance T = Temperature = Stefan-Boltzmann constant A planetary object intercepts a circle (of radius R) of incoming solar energy S as See the “Stefan-Boltzmann Law” for more information S R 2 A (for Albedo) of which is reflected Energy absorbed is balanced by radiation to space. Hence, S R 2 (1 -A) = 4 R 22 T 44 therefore © Crown copyright Met Office T = (S(1 -A)/4 )1/4
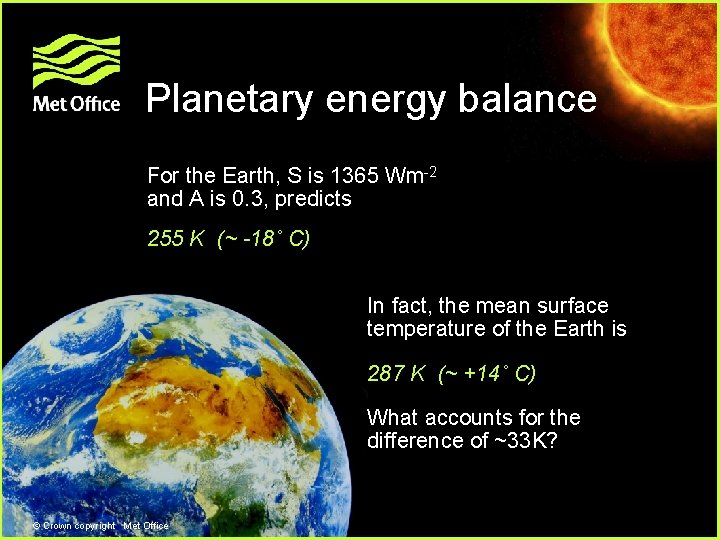
Planetary energy balance For the Earth, S is 1365 Wm-2 and A is 0. 3, predicts 255 K (~ -18˚ C) In fact, the mean surface temperature of the Earth is 287 K (~ +14˚ C) What accounts for the difference of ~33 K? © Crown copyright Met Office
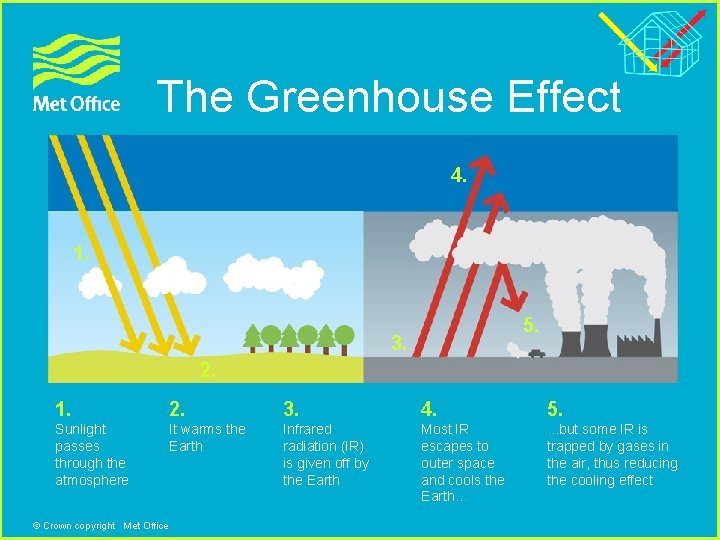
The Greenhouse Effect 4. 1. 5. 3. 2. 1. 2. 3. 4. 5. Sunlight passes through the atmosphere It warms the Earth Infrared radiation (IR) is given off by the Earth Most IR escapes to outer space and cools the Earth… . . . but some IR is trapped by gases in the air, thus reducing the cooling effect © Crown copyright Met Office
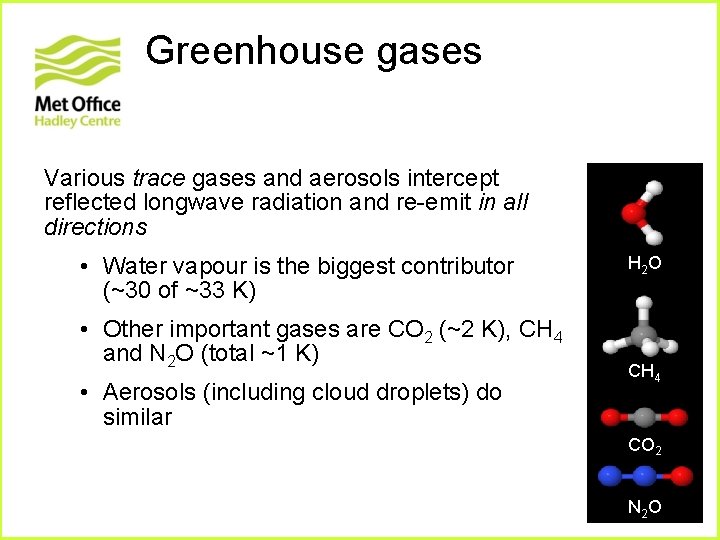
Greenhouse gases Various trace gases and aerosols intercept reflected longwave radiation and re-emit in all directions • Water vapour is the biggest contributor (~30 of ~33 K) • Other important gases are CO 2 (~2 K), CH 4 and N 2 O (total ~1 K) • Aerosols (including cloud droplets) do similar H 2 O CH 4 CO 2 N 2 O
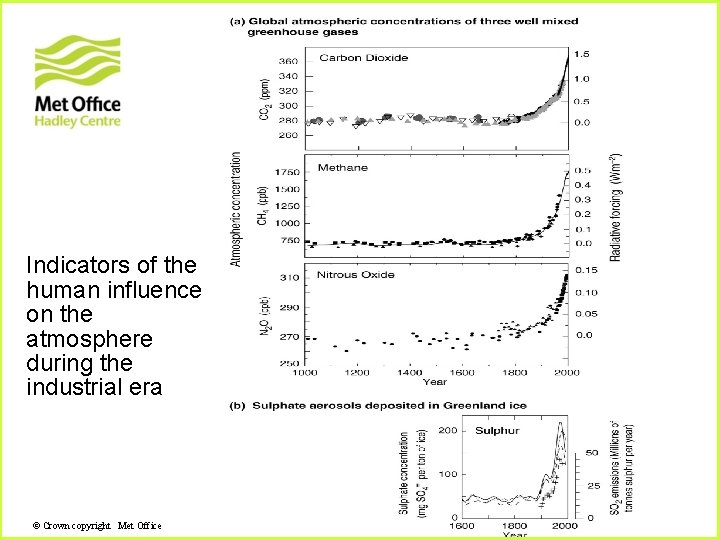
Indicators of the human influence on the atmosphere during the industrial era © Crown copyright Met Office
Climate variability © Crown copyright Met Office
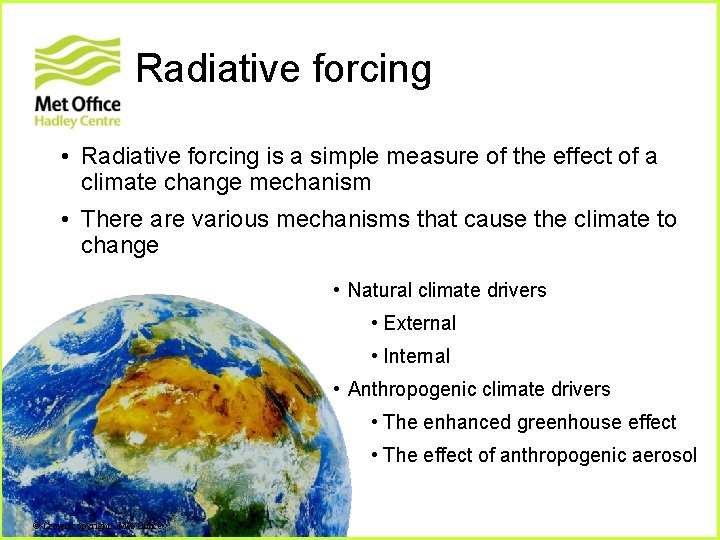
Radiative forcing • Radiative forcing is a simple measure of the effect of a climate change mechanism • There are various mechanisms that cause the climate to change • Natural climate drivers • External • Internal • Anthropogenic climate drivers • The enhanced greenhouse effect • The effect of anthropogenic aerosol © Crown copyright Met Office
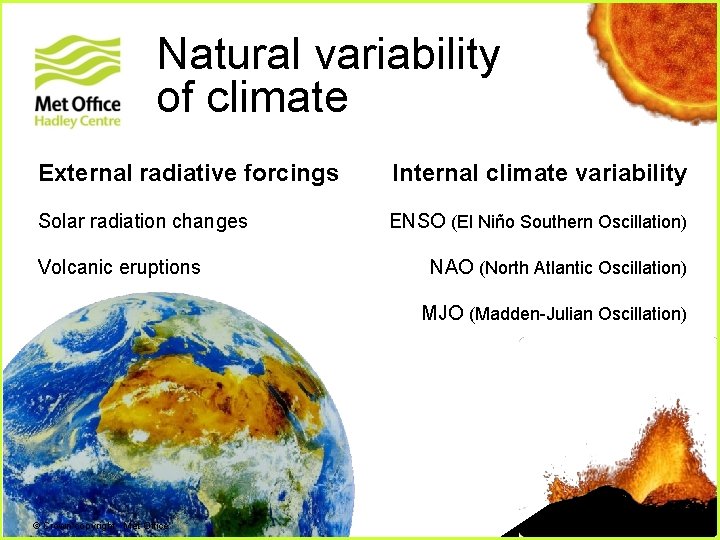
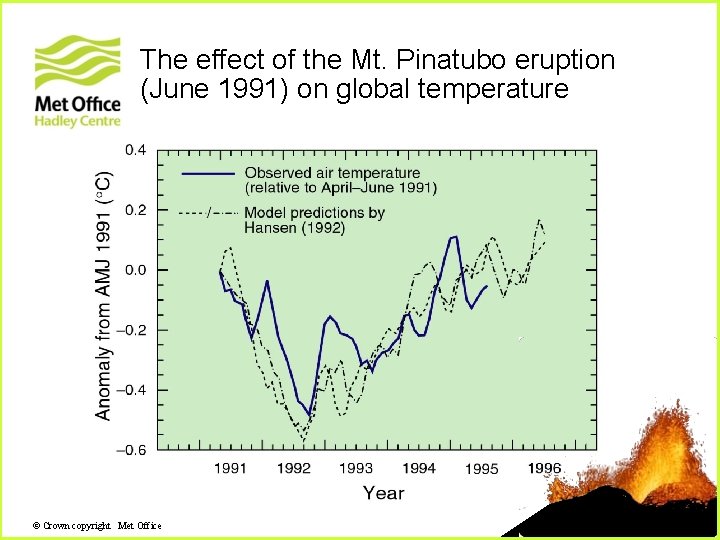
Natural variability of climate External radiative forcings Internal climate variability Solar radiation changes ENSO (El Niño Southern Oscillation) Volcanic eruptions + NAO (North Atlantic Oscillation) MJO (Madden-Julian Oscillation) © Crown copyright Met Office
The effect of the Mt. Pinatubo eruption (June 1991) on global temperature © Crown copyright Met Office
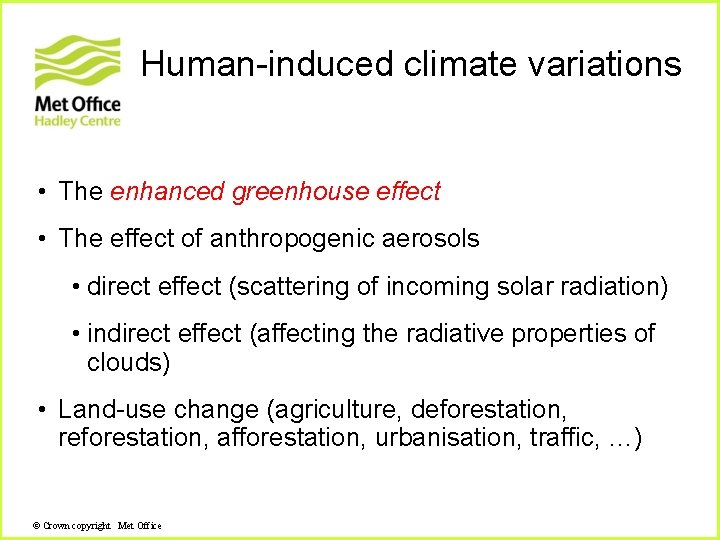
Human-induced climate variations • The enhanced greenhouse effect • The effect of anthropogenic aerosols • direct effect (scattering of incoming solar radiation) • indirect effect (affecting the radiative properties of clouds) • Land-use change (agriculture, deforestation, reforestation, afforestation, urbanisation, traffic, …) © Crown copyright Met Office
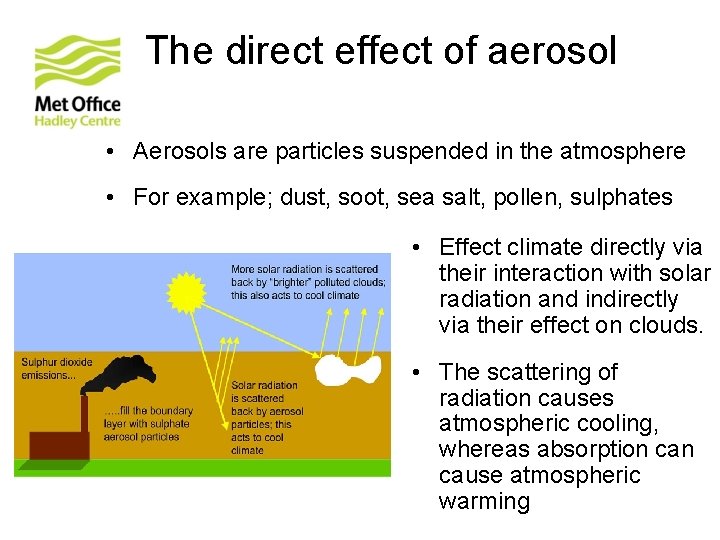
The direct effect of aerosol • Aerosols are particles suspended in the atmosphere • For example; dust, soot, sea salt, pollen, sulphates • Effect climate directly via their interaction with solar radiation and indirectly via their effect on clouds. • The scattering of radiation causes atmospheric cooling, whereas absorption cause atmospheric warming
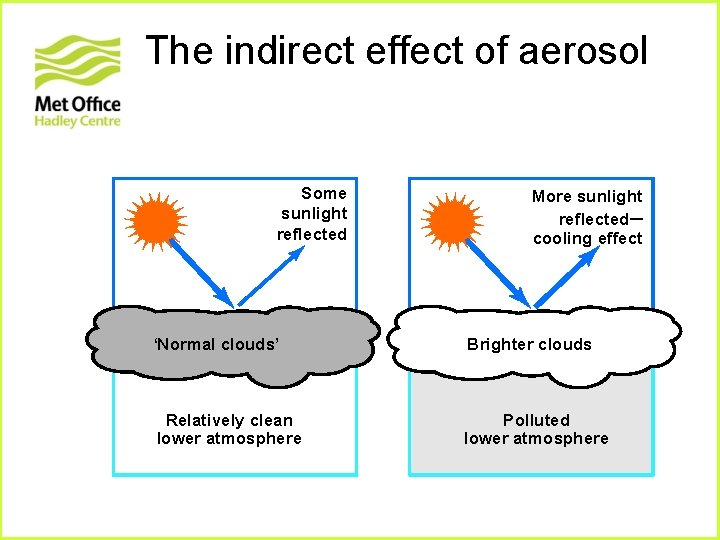
The indirect effect of aerosol Some sunlight reflected More sunlight reflected– cooling effect ‘Normal clouds’ Brighter clouds Relatively clean lower atmosphere Polluted lower atmosphere
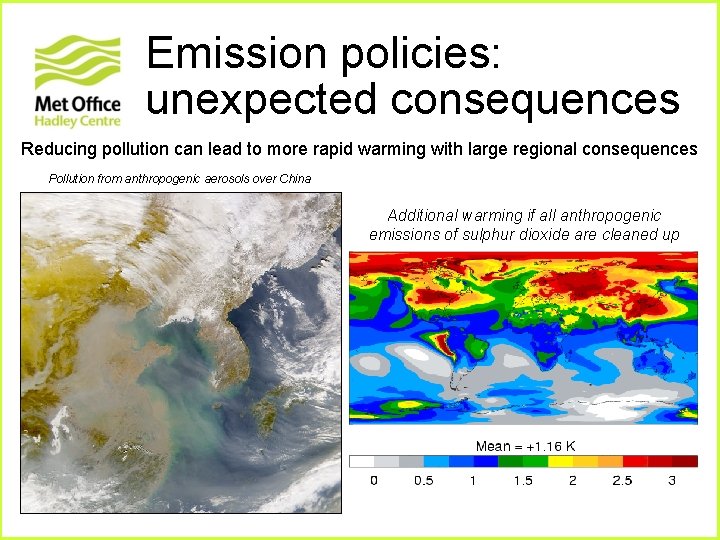
Emission policies: unexpected consequences Reducing pollution can lead to more rapid warming with large regional consequences Pollution from anthropogenic aerosols over China Additional warming if all anthropogenic emissions of sulphur dioxide are cleaned up
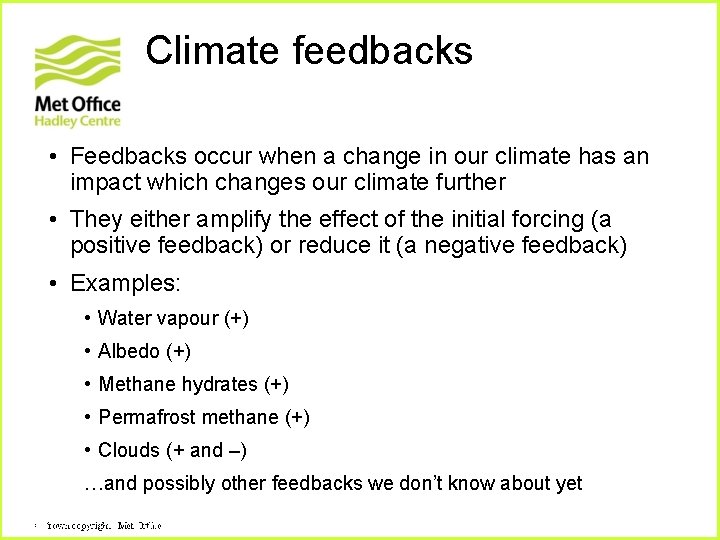
Climate feedbacks • Feedbacks occur when a change in our climate has an impact which changes our climate further • They either amplify the effect of the initial forcing (a positive feedback) or reduce it (a negative feedback) • Examples: • Water vapour (+) • Albedo (+) • Methane hydrates (+) • Permafrost methane (+) • Clouds (+ and –) …and possibly other feedbacks we don’t know about yet Crown copyright Met. Office © Crown
How do we quantify the response of the climate? • The response of the climate system to radiative forcings is complicated by: • feedbacks • the non-linearity of many processes • different response times of the different components to a given perturbation • We can use numerical models of the climate system as a means to calculate the climate response
Climate models © Crown copyright Met Office
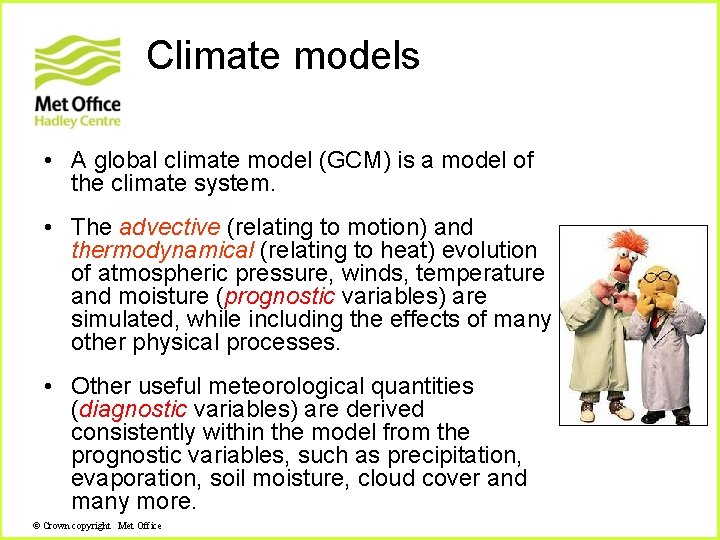
Climate models • A global climate model (GCM) is a model of the climate system. • The advective (relating to motion) and thermodynamical (relating to heat) evolution of atmospheric pressure, winds, temperature and moisture (prognostic variables) are simulated, while including the effects of many other physical processes. • Other useful meteorological quantities (diagnostic variables) are derived consistently within the model from the prognostic variables, such as precipitation, evaporation, soil moisture, cloud cover and many more. © Crown copyright Met Office
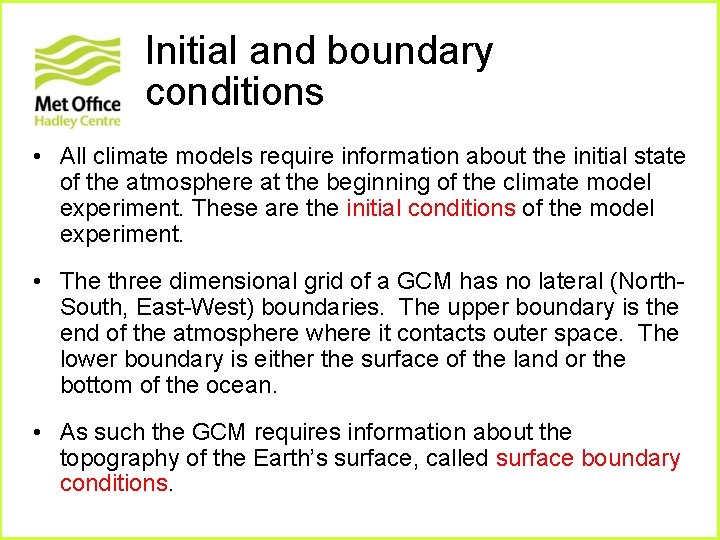
Main components of global climate models • Atmosphere and ocean dynamics • Model grid • Physical parameterizations • Initial conditions of the model • Boundary conditions (e. g. land sea mask, orographic height, vegetation and soil characteristics) © Crown copyright Met Office
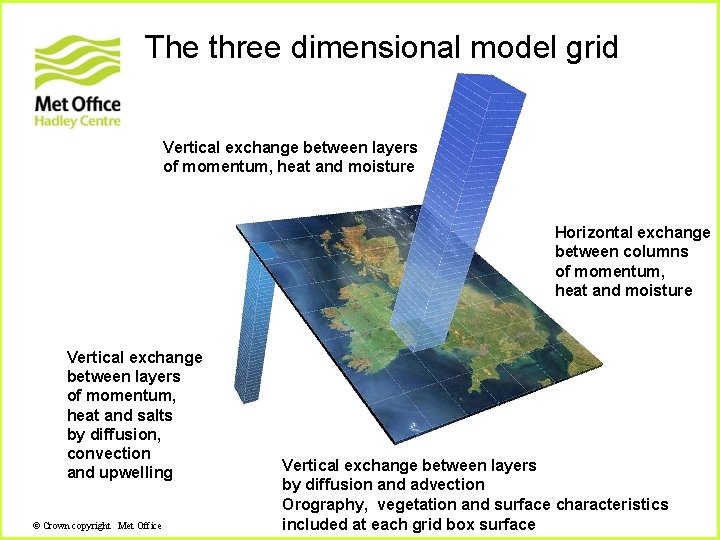
The three dimensional model grid Vertical exchange between layers of momentum, heat and moisture Horizontal exchange between columns of momentum, heat and moisture Vertical exchange between layers of momentum, heat and salts by diffusion, convection and upwelling © Crown copyright Met Office Vertical exchange between layers by diffusion and advection Orography, vegetation and surface characteristics included at each grid box surface
Parameterization of physical processes • Important processes occur in the atmosphere on scales smaller than those which are resolved by the grid of the dynamical part of the model. • The effects of these unresolved (sub-grid scale) processes are deduced from the large scale state variables predicted by the model (wind, pressure, temperature, moisture). • This procedure is called parameterization. © Crown copyright Met Office
Initial and boundary conditions • All climate models require information about the initial state of the atmosphere at the beginning of the climate model experiment. These are the initial conditions of the model experiment. • The three dimensional grid of a GCM has no lateral (North. South, East-West) boundaries. The upper boundary is the end of the atmosphere where it contacts outer space. The lower boundary is either the surface of the land or the bottom of the ocean. • As such the GCM requires information about the topography of the Earth’s surface, called surface boundary conditions.
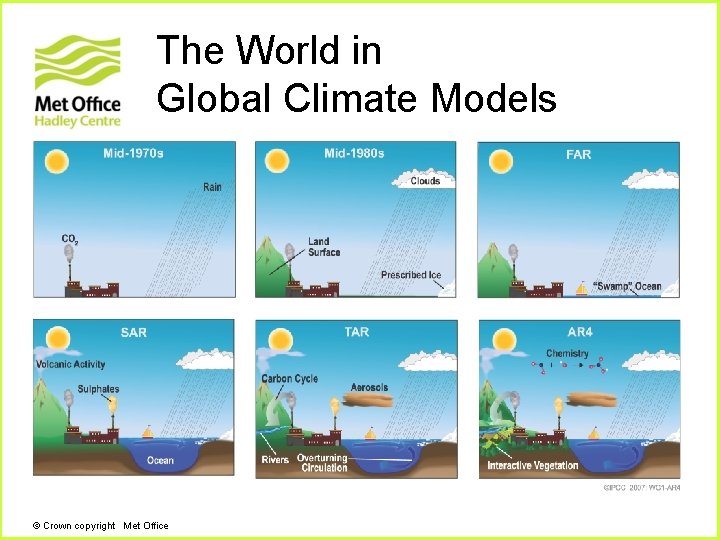
The World in Global Climate Models © Crown copyright Met Office
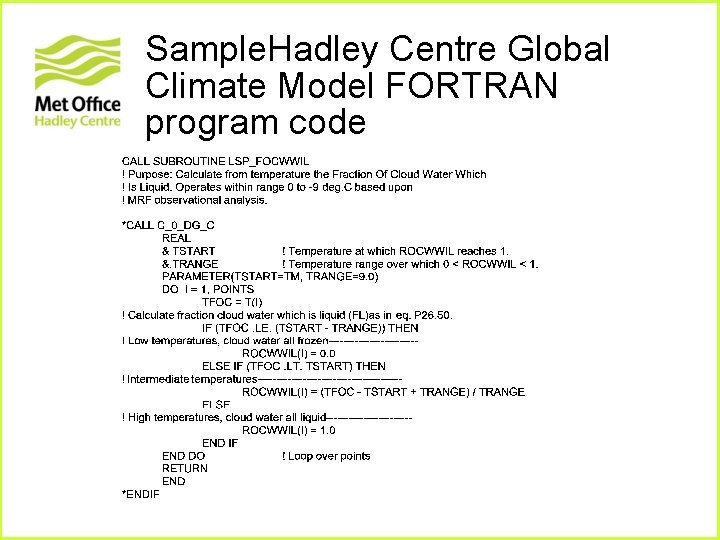
Sample. Hadley Centre Global Climate Model FORTRAN program code
20 th Century climate © Crown copyright Met Office
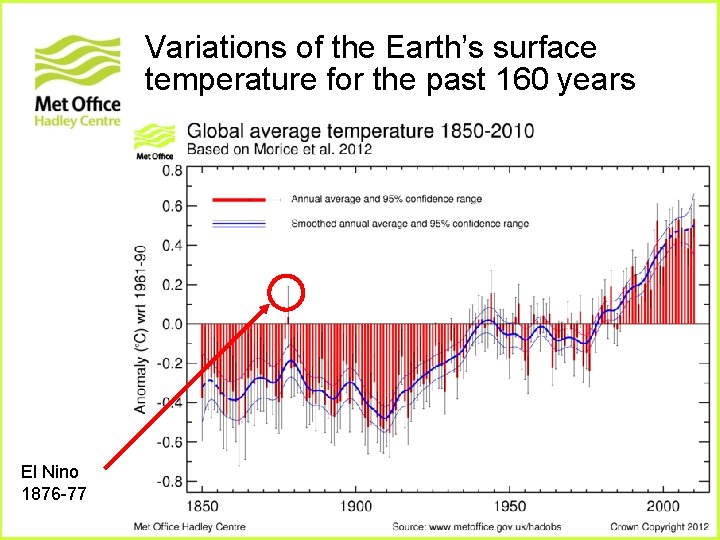
Variations of the Earth’s surface temperature for the past 160 years El Nino 1876 -77
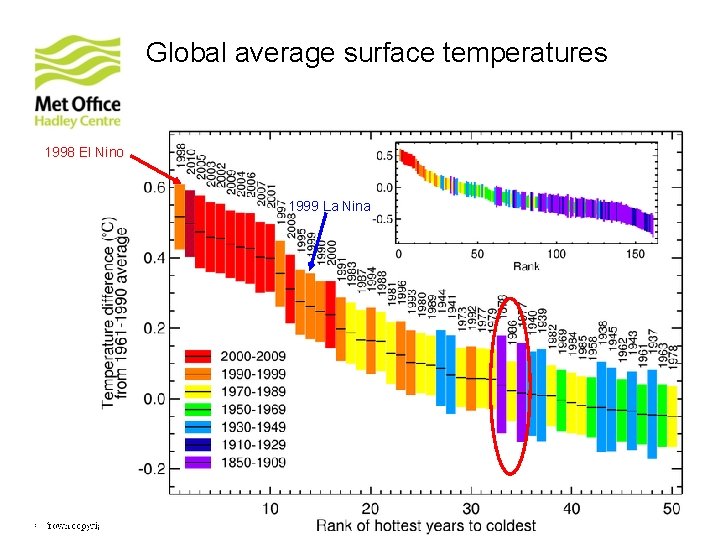
Global average surface temperatures 1998 El Nino 1999 La Nina 2010 Met Office – CRU Crown copyright Met. Office © Crown
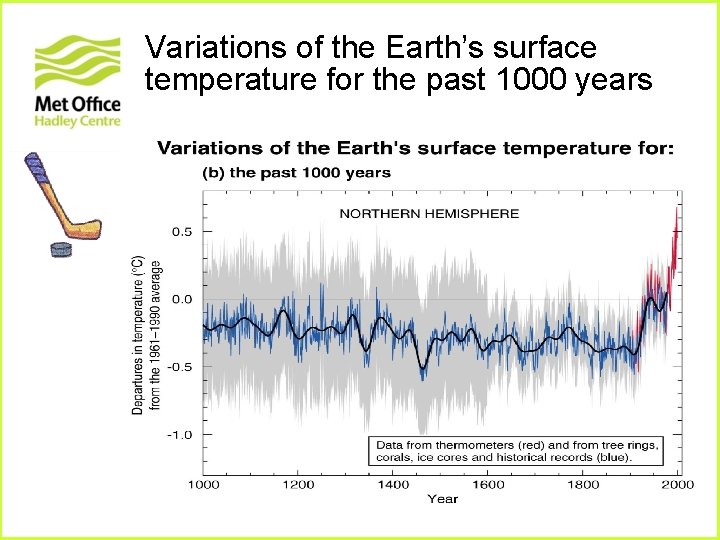
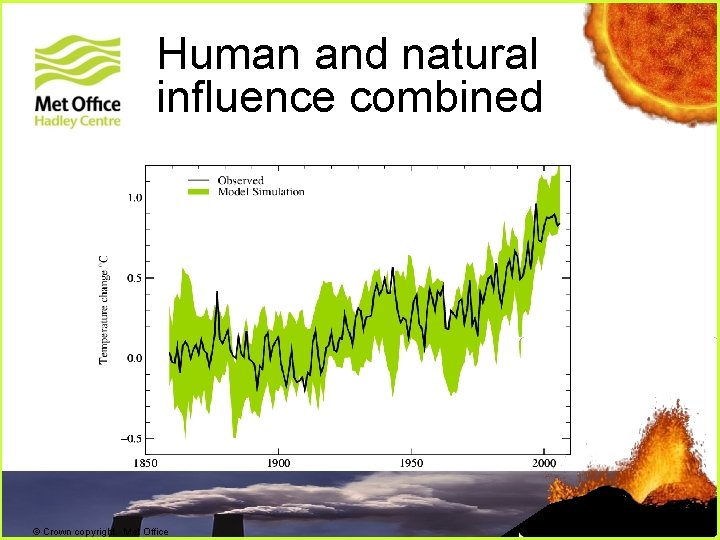
Variations of the Earth’s surface temperature for the past 1000 years
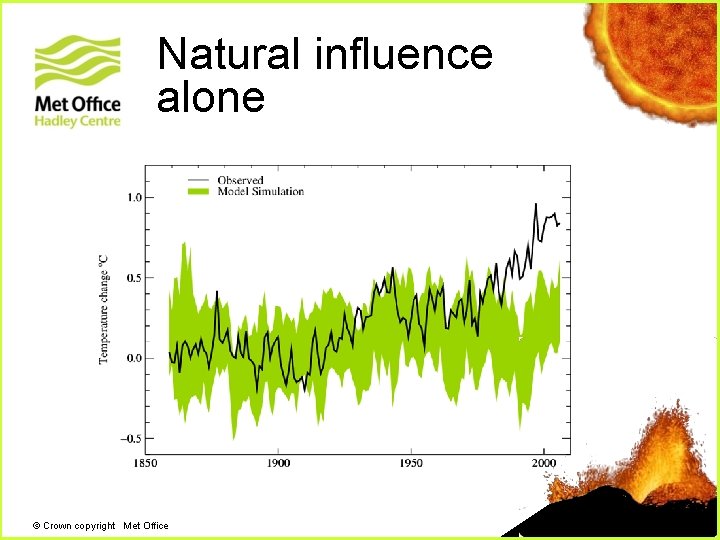
Natural influence alone + © Crown copyright Met Office
Human and natural influence combined + + © Crown copyright Met Office
Predicting climate change © Crown copyright Met Office
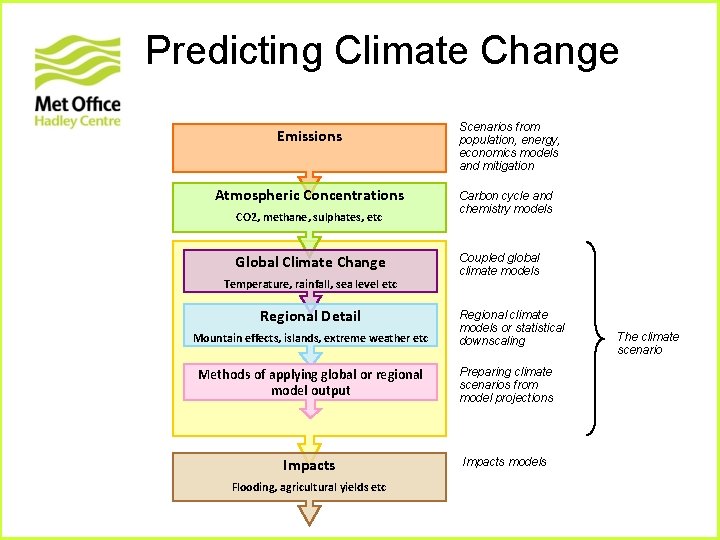
Predicting Climate Change Emissions Atmospheric Concentrations CO 2, methane, sulphates, etc Global Climate Change Temperature, rainfall, sea level etc Regional Detail Mountain effects, islands, extreme weather etc Scenarios from population, energy, economics models and mitigation Carbon cycle and chemistry models Coupled global climate models Regional climate models or statistical downscaling Methods of applying global or regional model output Preparing climate scenarios from model projections Impacts models Flooding, agricultural yields etc The climate scenario
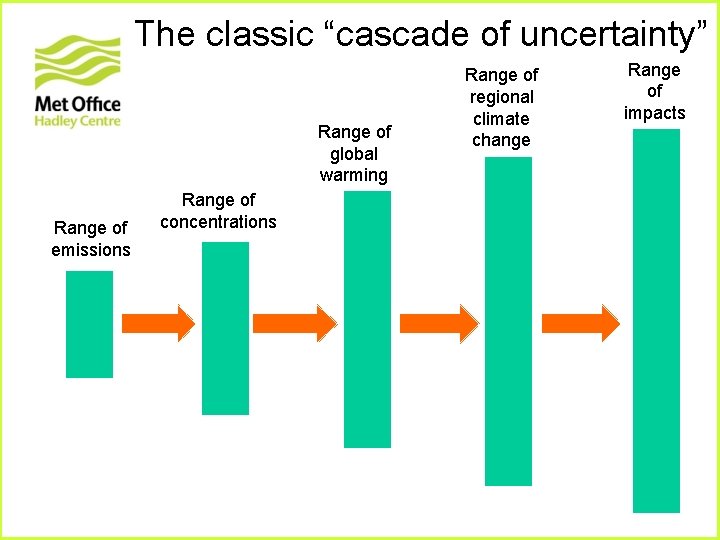
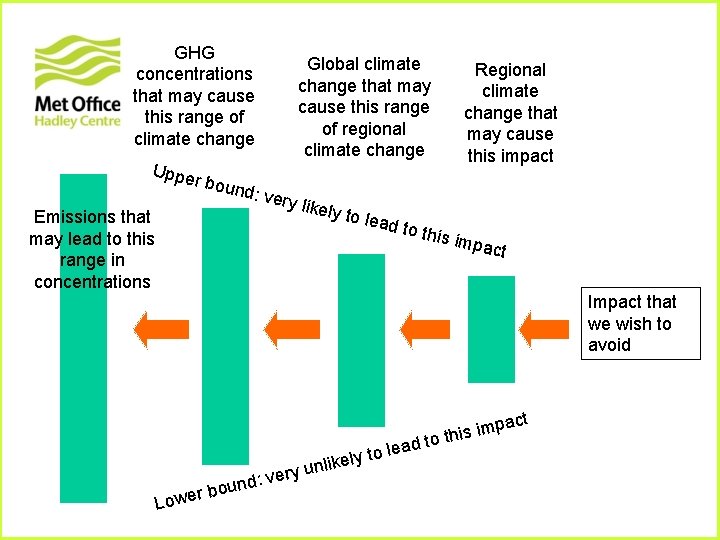
The classic “cascade of uncertainty” Range of global warming Range of emissions Range of concentrations Range of regional climate change Range of impacts
GHG concentrations that may cause this range of climate change Uppe r bou nd: ve r Global climate change that may cause this range of regional climate change Regional climate change that may cause this impact y like Emissions that may lead to this range in concentrations ly to l ead to this im pact Impact that we wish to avoid Lo ery v : d n ou wer b y to l e k i l un lea pact m i s i d to th
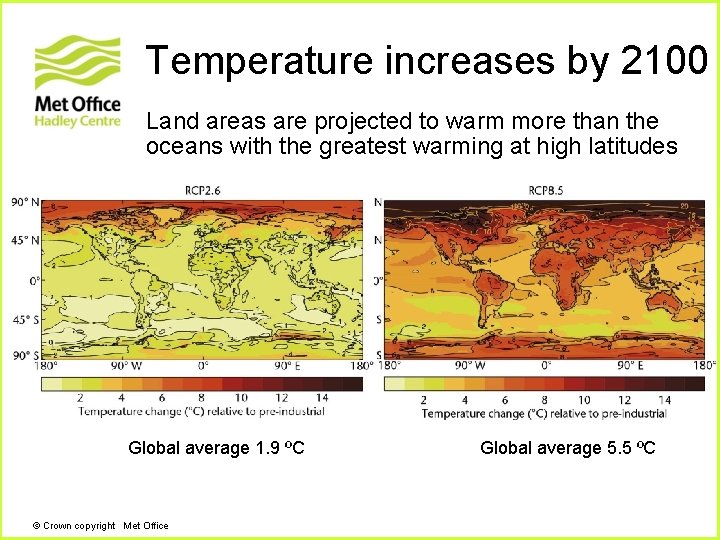
Temperature increases by 2100 Land areas are projected to warm more than the oceans with the greatest warming at high latitudes Global average 1. 9 ºC © Crown copyright Met Office Global average 5. 5 ºC
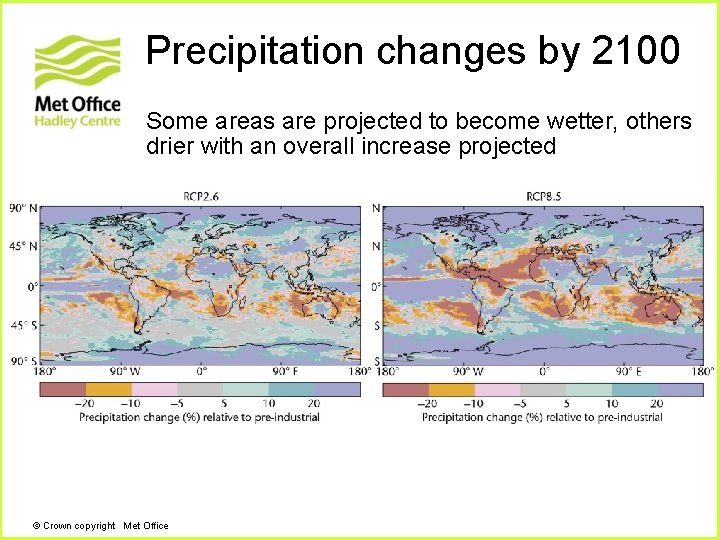
Precipitation changes by 2100 Some areas are projected to become wetter, others drier with an overall increase projected © Crown copyright Met Office
. . . And in conclusion This presentation is intended as a brief overview of the climate system and climate modelling. For more in-depth training, consider registering for the free online course in the science of climate change and modelling at http: //www. climateeducation. net This is a joint effort of the University of Oxford Continuing Education Department and the Met Office Hadley Centre consisting of 8 interactive online units intended for an educated (but non-scientist) audience.
Questions © Crown copyright Met Office