ESSA Steering Committee October 24 2018 Stakeholder Feedback

ESSA Steering Committee October 24, 2018

Stakeholder Feedback on Reports 2017 Results

Timeline for Feedback on 2017 Reports Spring 2018 - contacted CCSSO and Battelle for Kids April 11, 2018 – 2017 ESSA School Index Report Summer 2018 – focus groups and statewide survey August 2018 – Critical Friends review with CCSSO

ESSA School Index 2018 Reports

ESSA School Index Score: All Students 2018 N Mean Std Dev Minimum Maximum 1 - Elementary Level 528 70. 86 7. 43 51. 36 90. 19 2 - Middle Level 203 69. 97 7. 38 47. 56 87. 55 3 - High School Level 315 66. 28 7. 93 30. 84 97. 40

ESSA School Index Score: Statistical Markers for Distributions by Grade Span* 2018 P_5 P_10 P_15 P_20 P_25 P_30 P_35 P_40 P_45 P_50 P_55 P_60 P_65 P_70 P_75 P_80 P_85 P_90 P_95 1 - Elementary Level 57. 73 60. 60 63. 44 65. 02 66. 14 67. 30 68. 38 69. 09 69. 95 70. 55 71. 47 72. 48 73. 50 74. 78 75. 84 76. 98 78. 71 80. 69 83. 64 2 - Middle Level 55. 87 59. 63 62. 99 64. 04 65. 17 66. 68 67. 77 69. 01 69. 40 70. 69 71. 42 72. 27 72. 97 74. 01 74. 81 75. 74 77. 25 79. 11 81. 62 3 - High School Level 52. 78 57. 01 59. 62 61. 25 62. 80 63. 77 64. 63 65. 19 66. 22 67. 02 67. 71 68. 45 69. 02 69. 54 70. 79 71. 63 73. 10 74. 13 76. 64 -2 SD -1. 5 SD -1 SD -0. 5 SD Mean 0. 5 SD 1. 0 SD 1. 5 SD 2. 0 SD 1 -Elementary 56. 00 59. 72 63. 43 67. 15 70. 86 74. 58 78. 29 82. 01 85. 72 2 -Middle 55. 21 58. 90 62. 59 66. 28 69. 97 73. 66 77. 35 81. 04 84. 73 3 -High School 50. 42 54. 39 58. 35 62. 32 66. 28 70. 25 74. 21 78. 18 82. 14 *Percentiles are calculated for all schools in the grade span including schools participating in Title I and schools not participating or not eligible.

2018 ESSA School Index Score Subgroup Summary 2018 Subgroup N Mean Std Dev Minimum Maximum 1 - Elementary Level 2 African American 246 63. 36 6. 06 51. 02 80. 10 3 Hispanic/Latino 254 71. 08 5. 73 56. 22 89. 61 4 White 482 73. 57 7. 01 52. 91 92. 01 5 Econ. Disadv. 527 68. 02 6. 07 51. 32 90. 35 6 EL 191 71. 55 6. 42 54. 00 91. 94 7 SPED 437 55. 69 5. 52 39. 63 75. 42 2 African American 118 61. 16 6. 13 46. 81 78. 56 3 Hispanic/Latino 148 69. 34 6. 17 52. 93 85. 20 4 White 191 73. 45 6. 40 48. 37 89. 52 5 Econ. Disadv. 203 66. 45 5. 73 47. 80 81. 64 6 EL 105 68. 30 6. 83 52. 84 94. 84 7 SPED 193 53. 52 5. 09 43. 65 74. 10 2 African American 97 56. 71 4. 90 38. 55 69. 06 3 Hispanic/Latino 61 65. 70 7. 29 46. 16 96. 86 4 White 265 69. 79 6. 36 44. 17 97. 42 5 Econ. Disadv. 282 62. 66 5. 87 38. 07 78. 86 6 EL 39 61. 65 6. 01 45. 99 73. 68 7 SPED 83 50. 71 3. 55 44. 19 61. 27 2 - Middle Level 3 - High School Level Subgroup must meet minimum N of 15 for all indicators to be included in analysis for ESSA.

School Rating 2018 Results

ESSA Index Score Ranges for Each Letter Grade by Grade Span

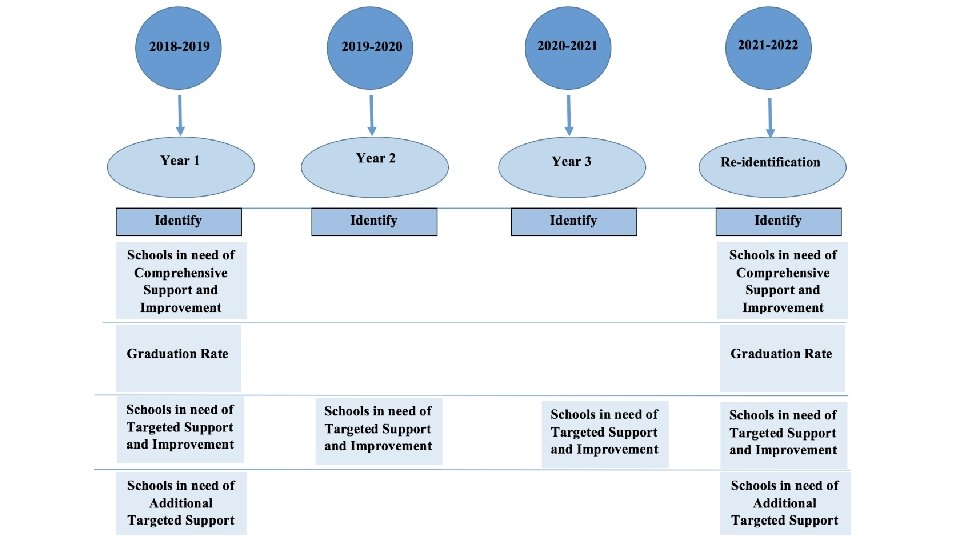
ESSA Identification 2018

ESSA School Index Scores at 1 st and 5 th Percentiles* of Statewide Title I School Distributions Grade Span 1 – Elementary Level 2 – Middle Level 3 – High School Level Value at 1 st Value at 5 th Percentile Percentile 2016 2017 2018 56. 00 55. 62 54. 09 59. 67 59. 68 57. 48 55. 22 53. 60 51. 12 58. 40 58. 63 55. 50 39. 95 33. 82 38. 86 51. 07 53. 53 52. 14 *Fifth Percentile values in this table are based on the Title I participating schools in each grade span; thus these values may differ from the Percentile values reported when including all schools.

Schools in need of comprehensive support and improvement Grade Span 1 Grade Span 2 Grade Span 3 Totals 25 8 12* 45 43 schools have an all students ESSA School Index score under the value at the 5 th percentile for their grade span using the 2018 ESSA School Index. • Two schools had the same ESSA School Index score in each of Grade Span 1 and Grade Span 2 which resulted in 43 schools identified as having a value at or below the 5 th percentile rank score of Title I schools. • Two schools closed at the end of 2017 -2018. • Two high schools were identified based on the criteria of having a 4 -Year Adjusted Cohort Graduation Rate less than 66. 667%. • 41 Title I schools identified in need of comprehensive support and improvement based on 5 th percentile rank score of Title I schools accounting for closures. • 2 Title I schools identified based on graduation rate.

Continuous Cycle of Inquiry

Academics Facilities Fiscal Operations Students Communication Stakeholder Engagement Human Capital Student Support

Exit criteria for CSI • Arkansas exit criteria requires the school in need of CSI to demonstrate continued progress by exhibiting an upward trend on the ESSA School Index for two or more years and meet or exceed the ESSA School Index score that initially led to identification. • Arkansas exit criteria requires the school to meet or exceed the Fouryear Adjusted Cohort Graduation Rate of 66. 667 percent.

Schools in need of targeted support and improvement and additional targeted support Grade Span 1 Grade Span 2 Grade Span 3 Totals 101 41 0 142 Targeted Support and Improvement is determined by creating a subset of all schools’ subgroup rows that meet the minimum N of 15 for all indicators. This subset is created for each of three years 2016, 2017, and 2018. For each year the value of the ESSA School Index Score at the 1 st percentile is used to determine whether a subgroup is at or below that value. Three years of subgroup ESSA School Index Scores, along with three years of score values at the 1 st percentile, are used to determine whether a subgroup within a school had an ESSA School Index Value at or below the 1 st percentile for three consecutive years and is in need of targeted support and improvement. In 2018, all schools meeting this criteria will be identified in need of additional targeted support.

Continuous Cycle of Inquiry

Academics Facilities Fiscal Operations Students Communication Stakeholder Engagement Human Capital Student Support
,")
Exit criteria for ATS • Beginning in 2018 -2019 (and every three years thereafter), for schools identified in need of additional targeted support, Arkansas exit criteria requires the school to demonstrate continued progress by exhibiting an upward trend on the ESSA School Index for two or more years for each identified subgroup of students and meet or exceed the ESSA School Index Score that initially led to identification.
- Slides: 20