Esri International User Conference July 23 27 San









- Slides: 71

Esri International User Conference July 23– 27 | San Diego Convention Center Arc. GIS Enterprise Systems: Performance and Scalability Testing Methodologies Frank Pizzi Andrew Sakowicz

Introductions Who are we? • Esri Professional Services, Enterprise Implementation - Frank Pizzi - Andrew Sakowicz

Introductions • Target audience - GIS, DB, System administrators Testers - Architects - Developers - Project managers - • Level - Intermediate • .

Agenda • Performance engineering throughout project phases • Performance Factors – Software • Performance Factors - Hardware • Performance Tuning • Performance Testing • Monitoring Enterprise GIS

Performance Engineering Benefits • • Lower costs - Optimal resource utilization - Less hardware and licenses - Higher scalability Higher user productivity - Better performance

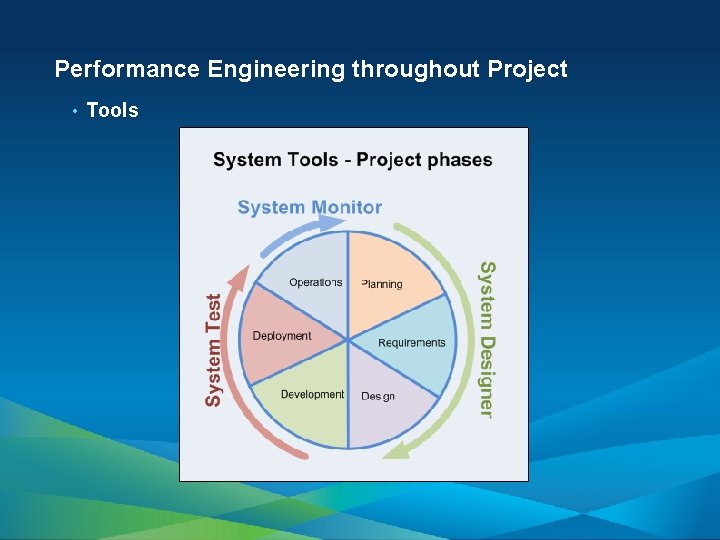
Performance Engineering throughout Project Phases

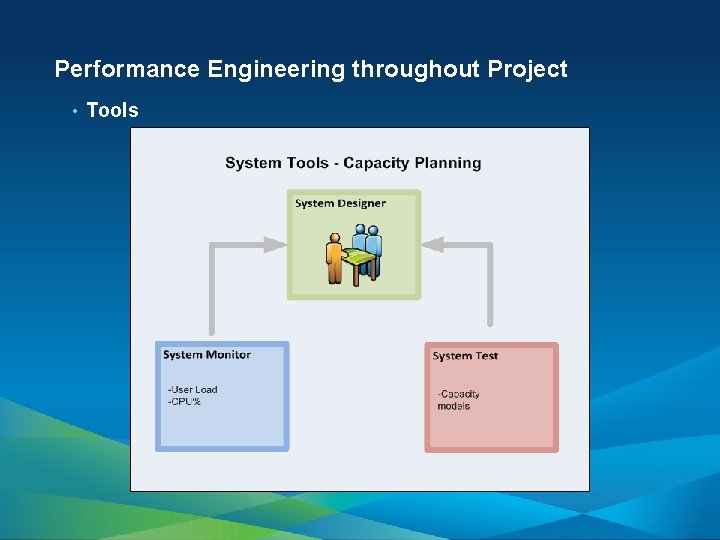
Performance Engineering throughout Project • Tools

Performance Factors Software

Performance Factors - Software • Application • GIS Services

Performance Factors - Software • Application • Type (e. g. , mobile, web, desktop) • Stateless vs. stateful (ADF) • Design • - Chattiness - Data access (feature service vs. map service) Output image format

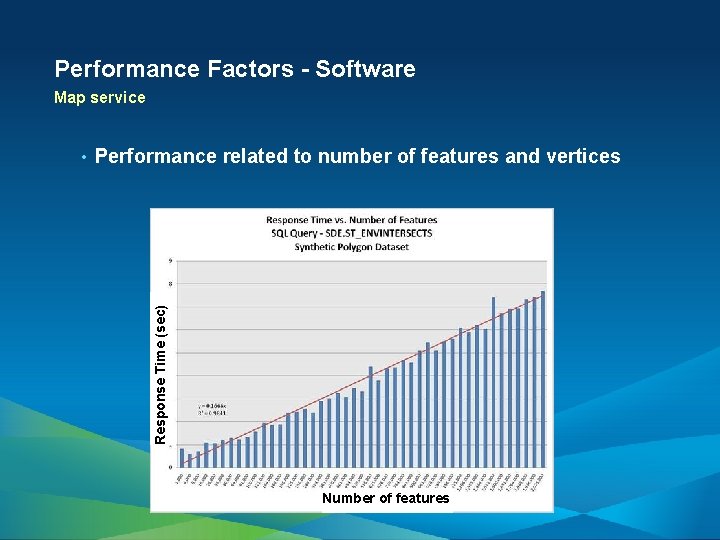
Performance Factors - Software Map service Performance related to number of features and vertices Response Time (sec) • Number of features

Performance Factors - Software GIS Services—Geodata • Database Maintenance/Design - • Keep versioning tree small, compress, schedule synchronizations, rebuild indexes, and have a well-defined data model. Geodata Service Configuration - Server Object usage timeout (set larger than 10 min. default) - Upload/Download default IIS size limits (200 K upload/ 4 MB download)

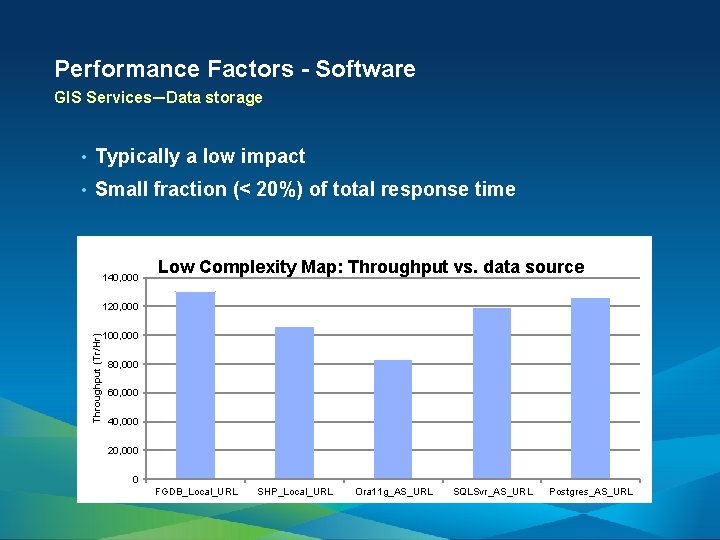
Performance Factors - Software GIS Services—Data storage • Typically a low impact • Small fraction (< 20%) of total response time 140, 000 Low Complexity Map: Throughput vs. data source Throughput (Tr/Hr) 120, 000 100, 000 80, 000 60, 000 40, 000 20, 000 0 FGDB_Local_URL SHP_Local_URL Ora 11 g_AS_URL SQLSvr_AS_URL Postgres_AS_URL

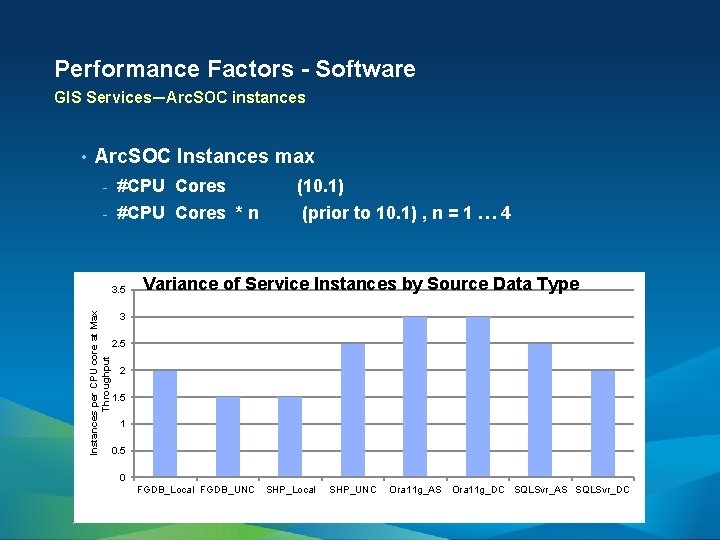
Performance Factors - Software GIS Services—Arc. SOC instances Arc. SOC Instances max - #CPU Cores (10. 1) - #CPU Cores * n (prior to 10. 1) , n = 1 … 4 3. 5 Instances per CPU core at Max Throughput • Variance of Service Instances by Source Data Type 3 2. 5 2 1. 5 1 0. 5 0 FGDB_Local FGDB_UNC SHP_Local SHP_UNC Ora 11 g_AS Ora 11 g_DC SQLSvr_AS SQLSvr_DC

Performance Factors Hardware

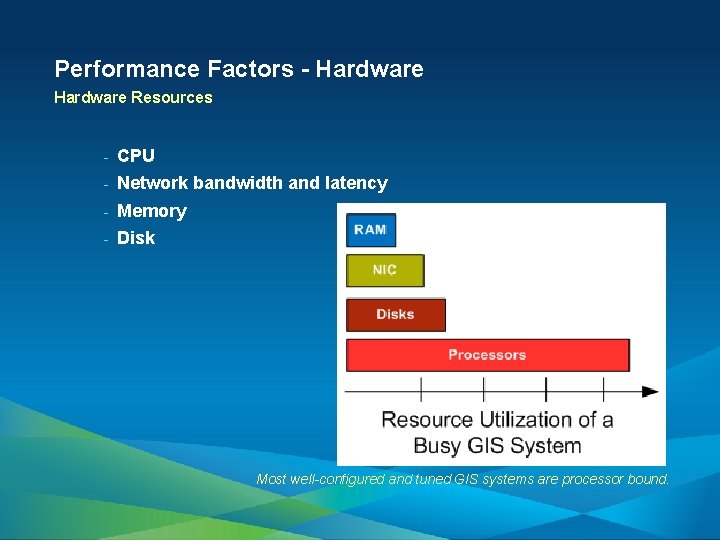
Performance Factors - Hardware Resources - CPU - Network bandwidth and latency - Memory - Disk Most well-configured and tuned GIS systems are processor bound.

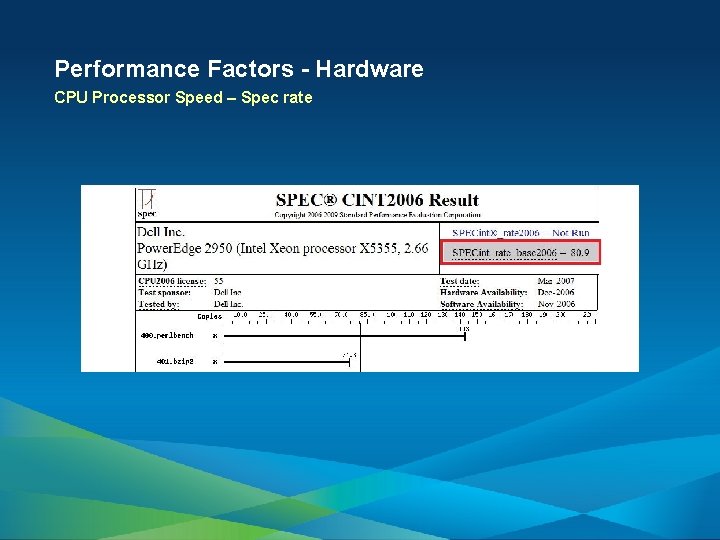
Performance Factors - Hardware CPU Processor Speed – Spec rate

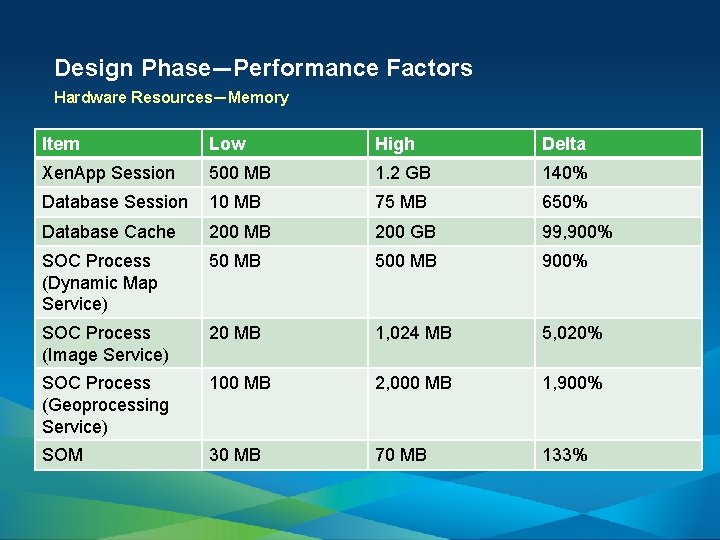
Design Phase—Performance Factors Hardware Resources—Memory Item Low High Delta Xen. App Session 500 MB 1. 2 GB 140% Database Session 10 MB 75 MB 650% Database Cache 200 MB 200 GB 99, 900% SOC Process (Dynamic Map Service) 50 MB 500 MB 900% SOC Process (Image Service) 20 MB 1, 024 MB 5, 020% SOC Process (Geoprocessing Service) 100 MB 2, 000 MB 1, 900% SOM 30 MB 70 MB 133% • Wide ranges of memory consumptions

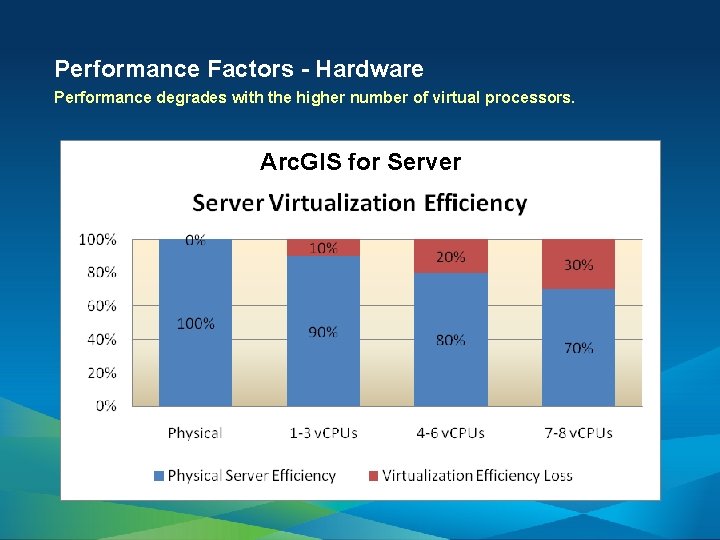
Performance Factors - Hardware Performance degrades with the higher number of virtual processors. Arc. GIS for Server

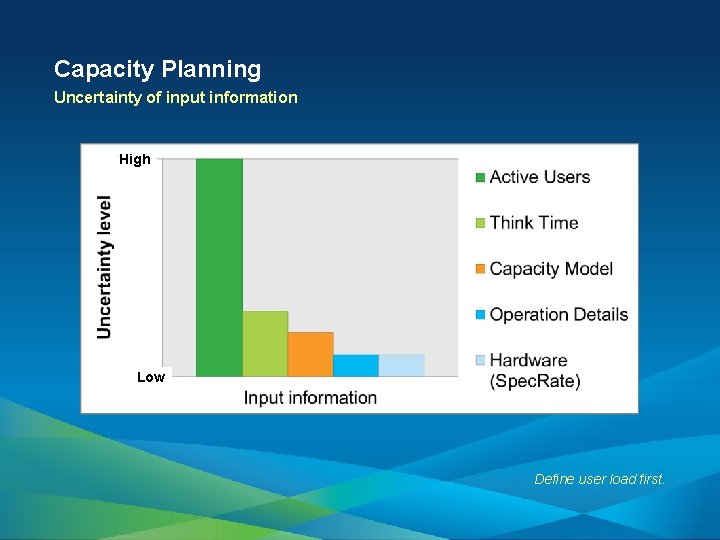
Capacity Planning Uncertainty of input information High Low Define user load first.

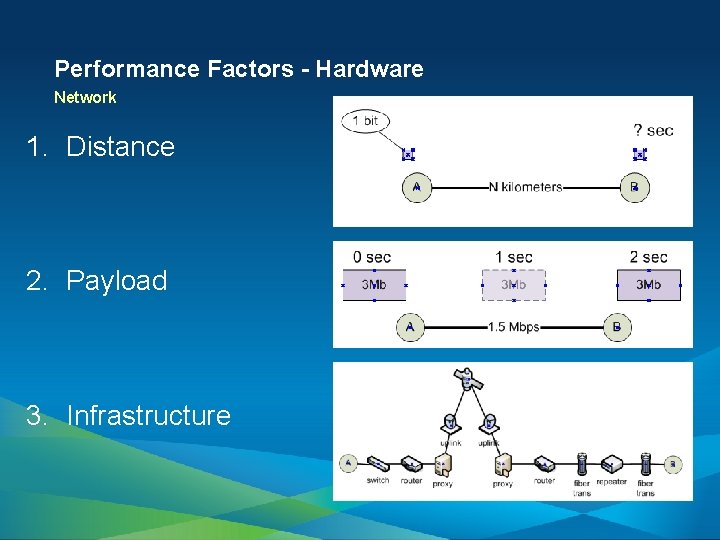
Performance Factors - Hardware Network 1. Distance 2. Payload 3. Infrastructure

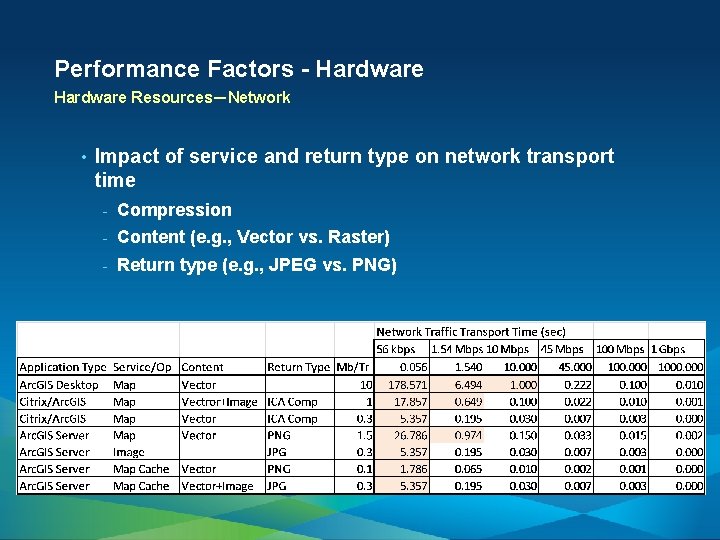
Performance Factors - Hardware Resources—Network • Impact of service and return type on network transport time - Compression - Content (e. g. , Vector vs. Raster) - Return type (e. g. , JPEG vs. PNG)

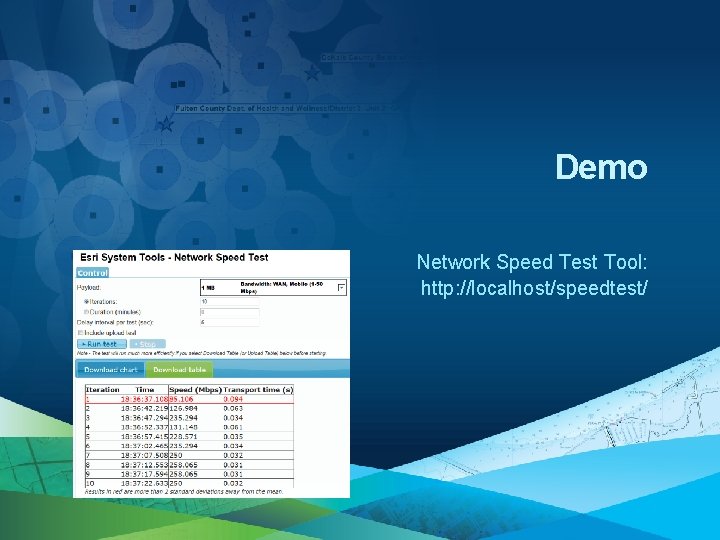
Demo Network Speed Test Tool: http: //localhost/speedtest/

Performance Tuning

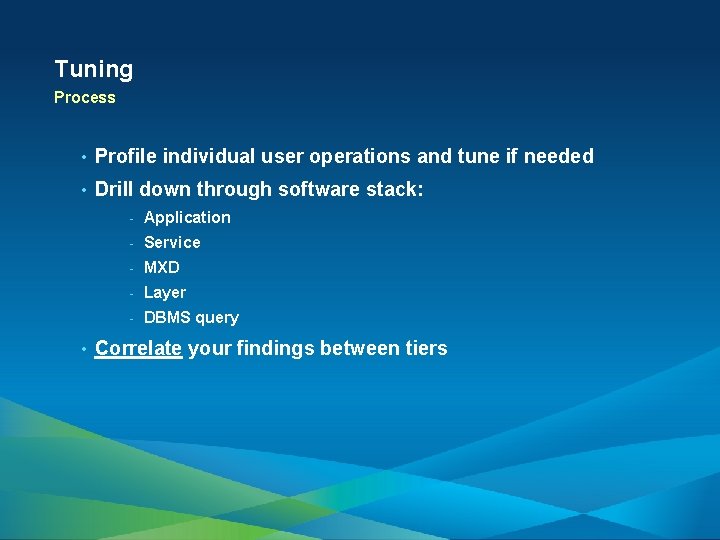
Tuning Process • Profile individual user operations and tune if needed • Drill down through software stack: • - Application - Service - MXD - Layer - DBMS query Correlate your findings between tiers

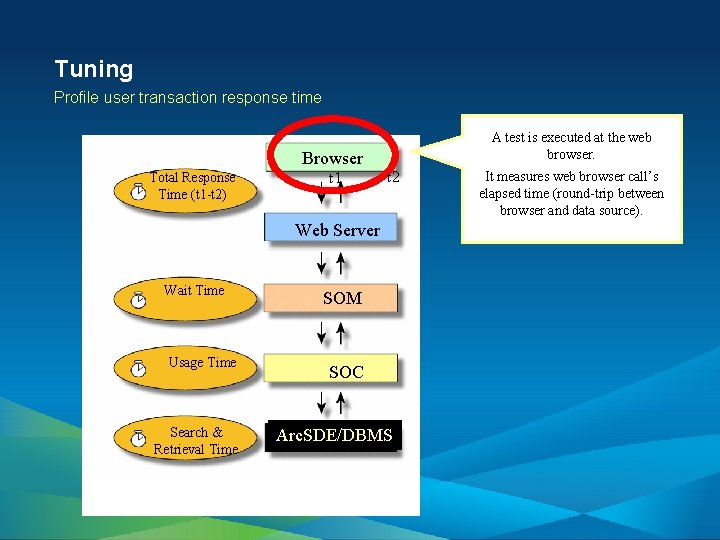
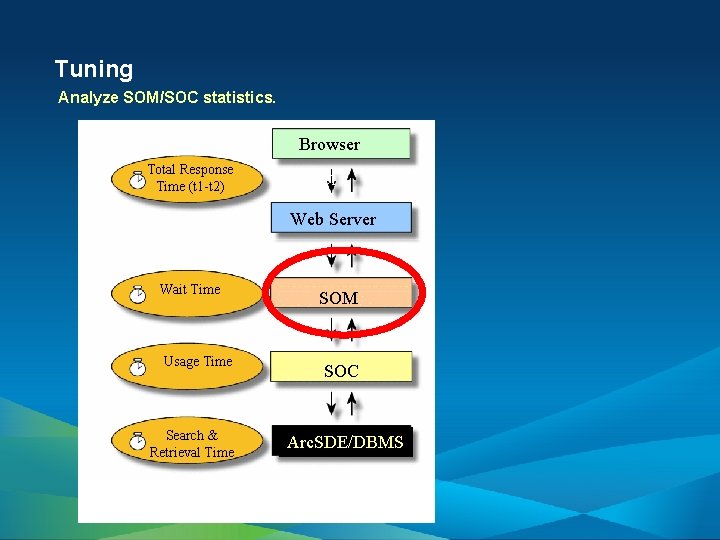
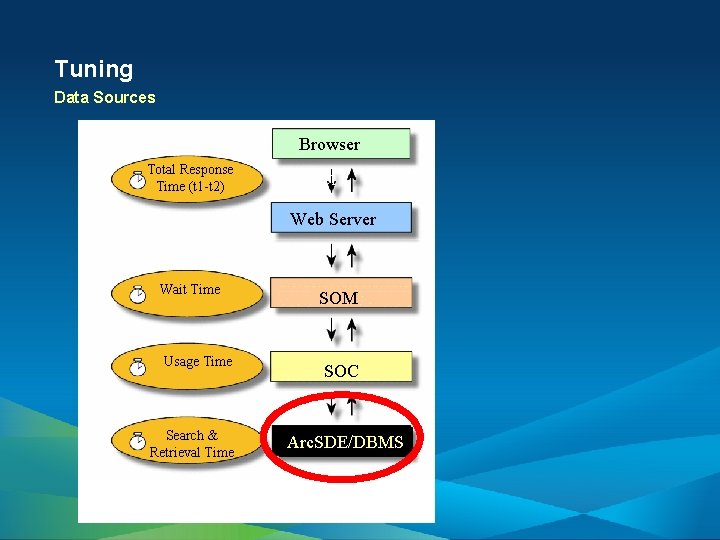
Tuning Profile user transaction response time Browser Total Response Time (t 1 -t 2) t 1 A test is executed at the web browser. t 2 Web Server Wait Time Usage Time Search & Retrieval Time SOM SOC Arc. SDE/DBMS It measures web browser call’s elapsed time (round-trip between browser and data source).

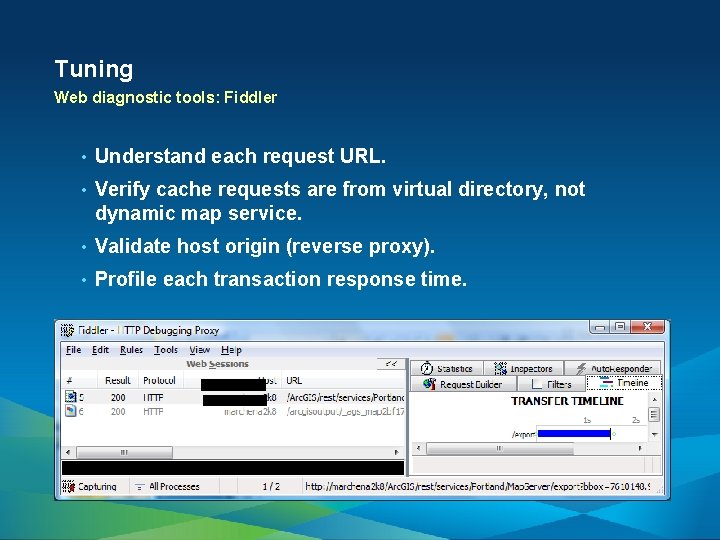
Tuning Web diagnostic tools: Fiddler • Understand each request URL. • Verify cache requests are from virtual directory, not dynamic map service. • Validate host origin (reverse proxy). • Profile each transaction response time.

Tuning Analyze SOM/SOC statistics. Browser Total Response Time (t 1 -t 2) t 1 t 2 Web Server Wait Time Usage Time Search & Retrieval Time SOM SOC Arc. SDE/DBMS

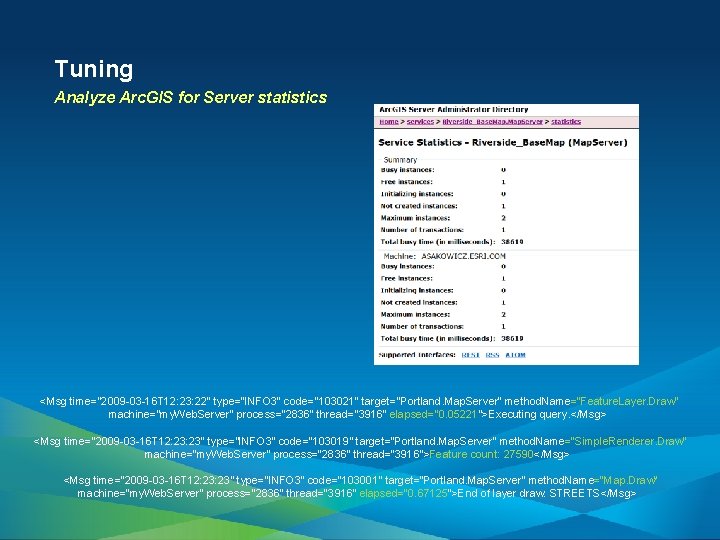
Tuning Analyze Arc. GIS for Server statistics <Msg time="2009 -03 -16 T 12: 23: 22" type="INFO 3" code="103021" target="Portland. Map. Server" method. Name="Feature. Layer. Draw" machine="my. Web. Server" process="2836" thread="3916" elapsed="0. 05221">Executing query. </Msg> <Msg time="2009 -03 -16 T 12: 23" type="INFO 3" code="103019" target="Portland. Map. Server" method. Name="Simple. Renderer. Draw" machine="my. Web. Server" process="2836" thread="3916">Feature count: 27590</Msg> <Msg time="2009 -03 -16 T 12: 23" type="INFO 3" code="103001" target="Portland. Map. Server" method. Name="Map. Draw" machine="my. Web. Server" process="2836" thread="3916" elapsed="0. 67125">End of layer draw: STREETS</Msg>

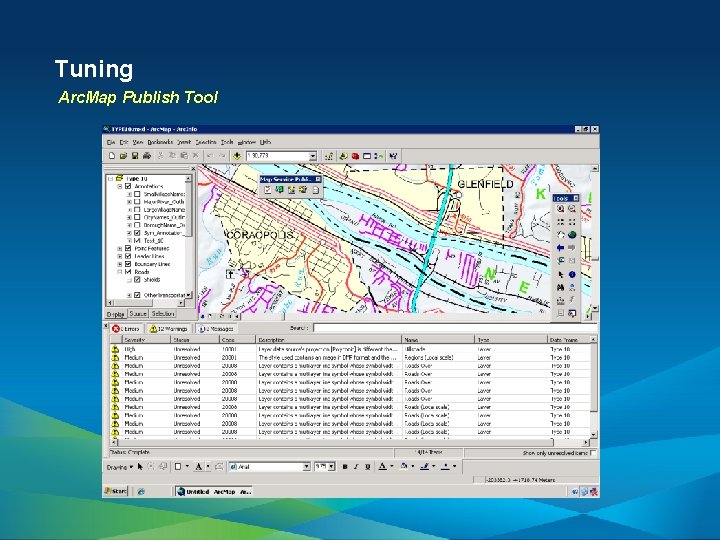
Tuning Arc. Map Publish Tool

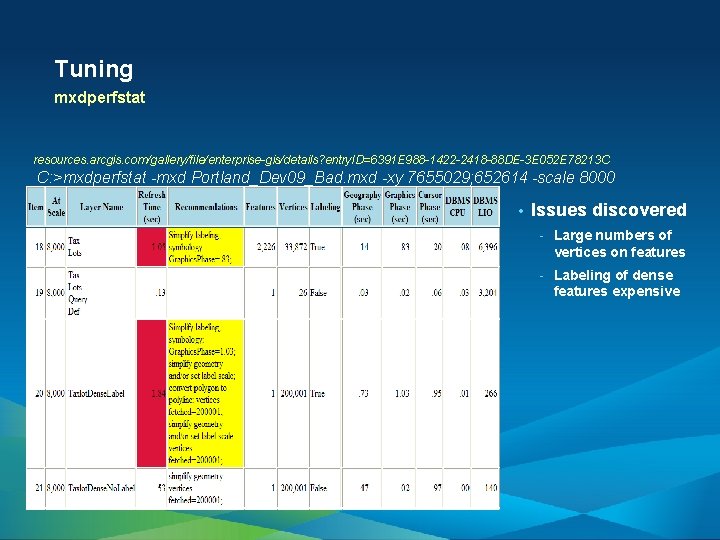
Tuning mxdperfstat resources. arcgis. com/gallery/file/enterprise-gis/details? entry. ID=6391 E 988 -1422 -2418 -88 DE-3 E 052 E 78213 C C: >mxdperfstat -mxd Portland_Dev 09_Bad. mxd -xy 7655029; 652614 -scale 8000 • Issues discovered - Large numbers of vertices on features - Labeling of dense features expensive

Tuning Data Sources Browser Total Response Time (t 1 -t 2) t 1 t 2 Web Server Wait Time Usage Time Search & Retrieval Time SOM SOC Arc. SDE/DBMS

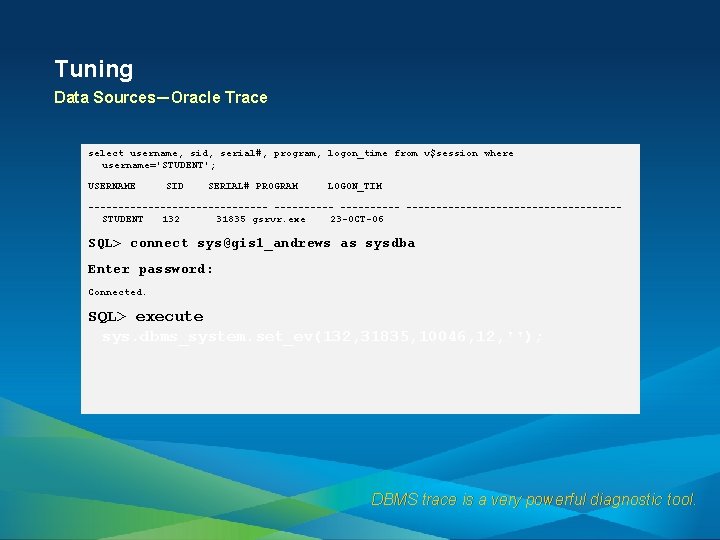
Tuning Data Sources—Oracle Trace select username, sid, serial#, program, logon_time from v$session where username='STUDENT'; USERNAME SID SERIAL# PROGRAM LOGON_TIM --------------- ------------------STUDENT 132 31835 gsrvr. exe 23 -OCT-06 SQL> connect sys@gis 1_andrews as sysdba Enter password: Connected. SQL> execute sys. dbms_system. set_ev(132, 31835, 10046, 12, ''); DBMS trace is a very powerful diagnostic tool.

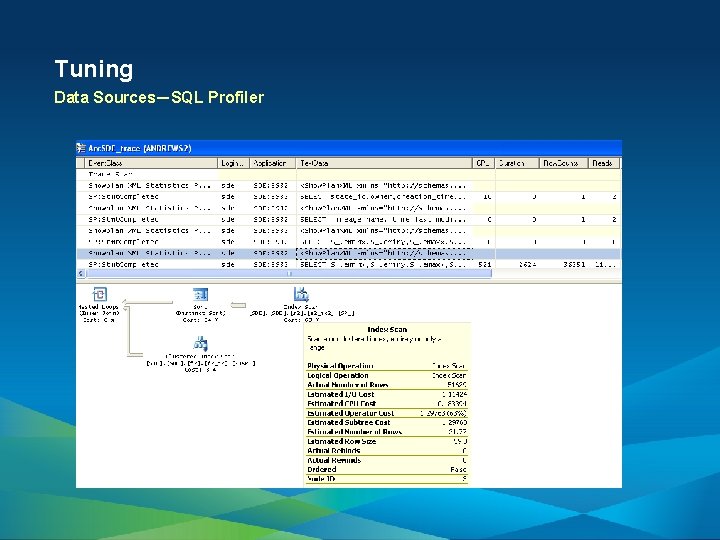
Tuning Data Sources—SQL Profiler

Performance Testing

Testing Performance Testing—Objectives - Define Objectives - Contractual Service-Level Agreement? - Bottlenecks - Capacity - Benchmark

Testing Performance Testing—Prerequisites • Functional testing completed • Performance tuning

Testing Performance Testing—Test Plan - Workflows - Expected User Experience (Pass/Fail Criteria) - Single User Performance Evaluation (Baseline) - Think Times - Active User Load - Pacing - Valid Test Data and Test Areas - Testing Environment - Scalability/Stability - IT Standards and Constraints - Configuration (GIS and Non-GIS)

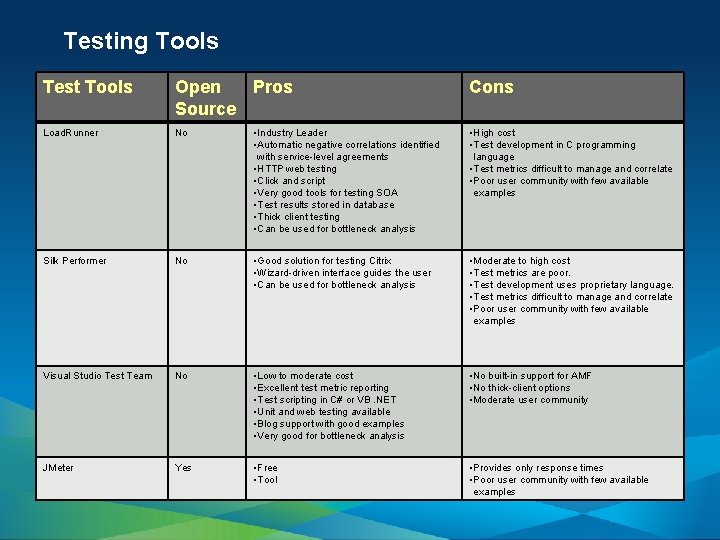
Testing Performance Testing—Test tools • Tool selection depends on objective. - Commercial tools all have system metrics and correlation tools. - Free tools typically provide response times and throughput but leave system metrics to the tester to gather and report on.

Testing Tools Test Tools Open Pros Source Cons Load. Runner No • Industry Leader • Automatic negative correlations identified with service-level agreements • HTTP web testing • Click and script • Very good tools for testing SOA • Test results stored in database • Thick client testing • Can be used for bottleneck analysis • High cost • Test development in C programming language • Test metrics difficult to manage and correlate • Poor user community with few available examples Silk Performer No • Good solution for testing Citrix • Wizard-driven interface guides the user • Can be used for bottleneck analysis • Moderate to high cost • Test metrics are poor. • Test development uses proprietary language. • Test metrics difficult to manage and correlate • Poor user community with few available examples Visual Studio Test Team No • Low to moderate cost • Excellent test metric reporting • Test scripting in C# or VB. NET • Unit and web testing available • Blog support with good examples • Very good for bottleneck analysis • No built-in support for AMF • No thick-client options • Moderate user community JMeter Yes • Free • Tool • Provides only response times • Poor user community with few available examples

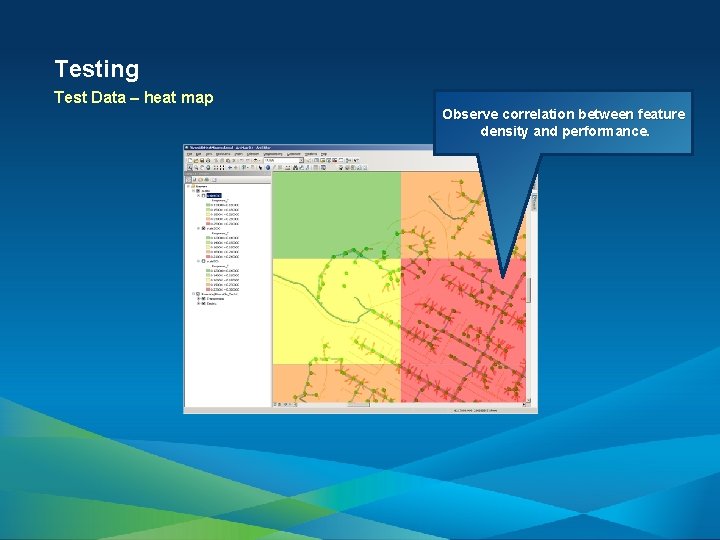
Testing Test Data – heat map Observe correlation between feature density and performance.

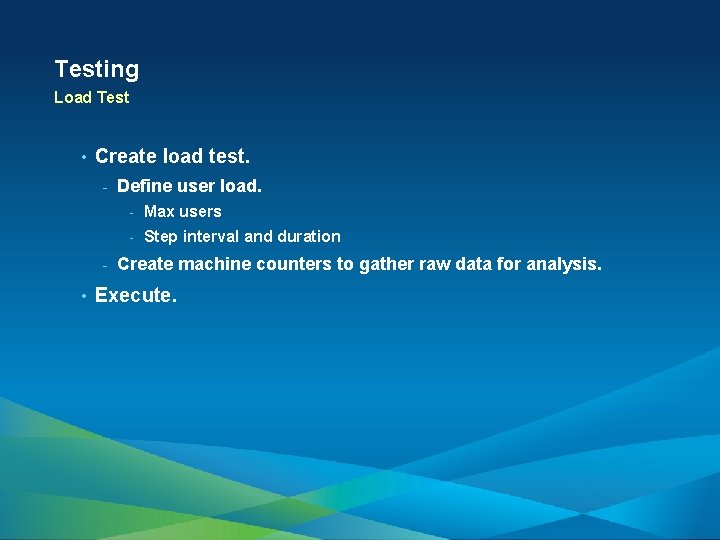
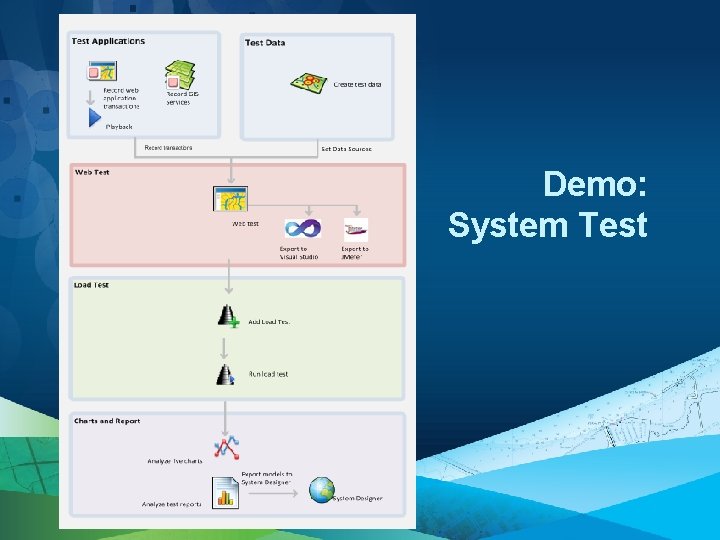
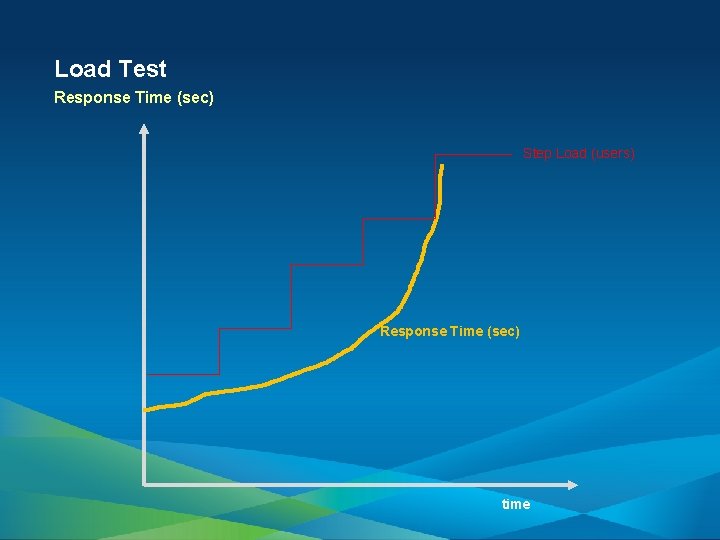
Testing Load Test • Create load test. - - • Define user load. - Max users - Step interval and duration Create machine counters to gather raw data for analysis. Execute.

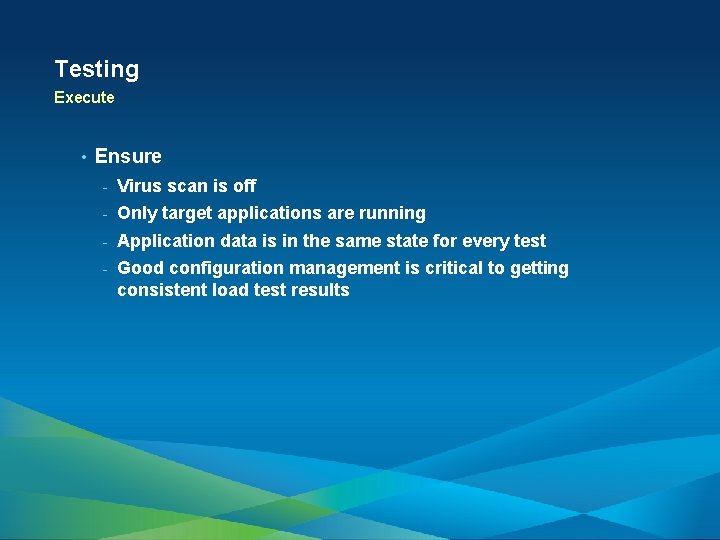
Testing Execute • Ensure - Virus scan is off - Only target applications are running - Application data is in the same state for every test - Good configuration management is critical to getting consistent load test results

Demo: System Test

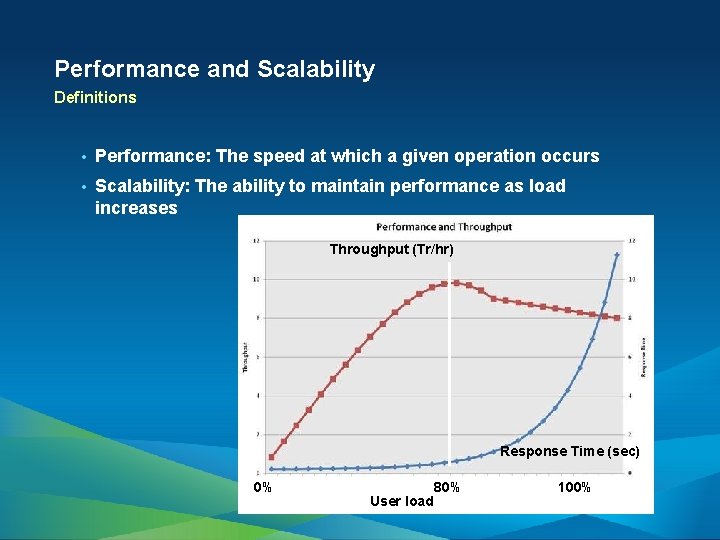
Performance and Scalability Definitions • Performance: The speed at which a given operation occurs • Scalability: The ability to maintain performance as load increases Throughput (Tr/hr) Response Time (sec) 0% User load 80% 100%

Load Test Response Time (sec) Step Load (users) Response Time (sec) time

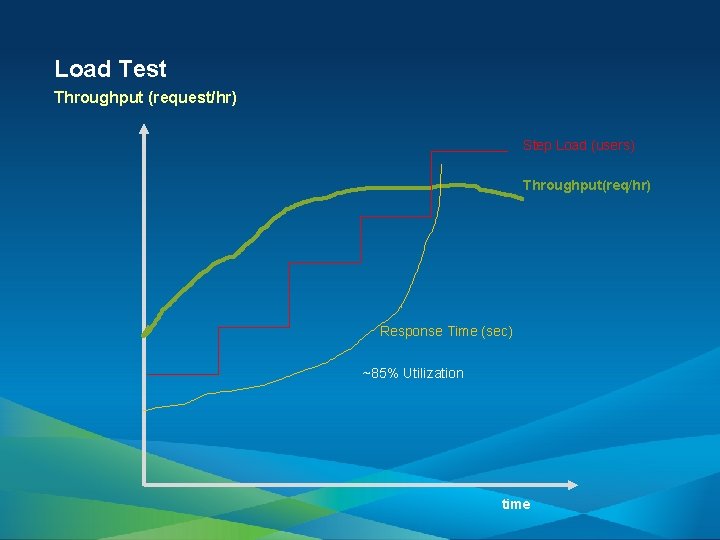
Load Test Throughput (request/hr) Step Load (users) Throughput(req/hr) Response Time (sec) ~85% Utilization time

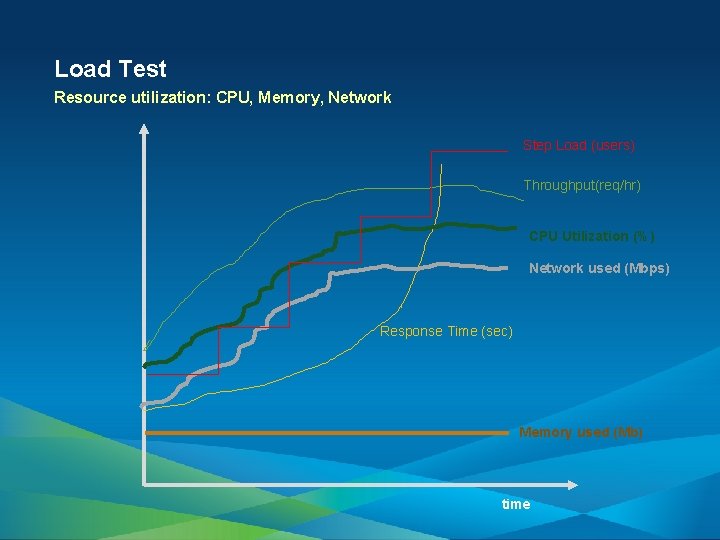
Load Test Resource utilization: CPU, Memory, Network Step Load (users) Throughput(req/hr) CPU Utilization (%) Network used (Mbps) Response Time (sec) Memory used (Mb) time

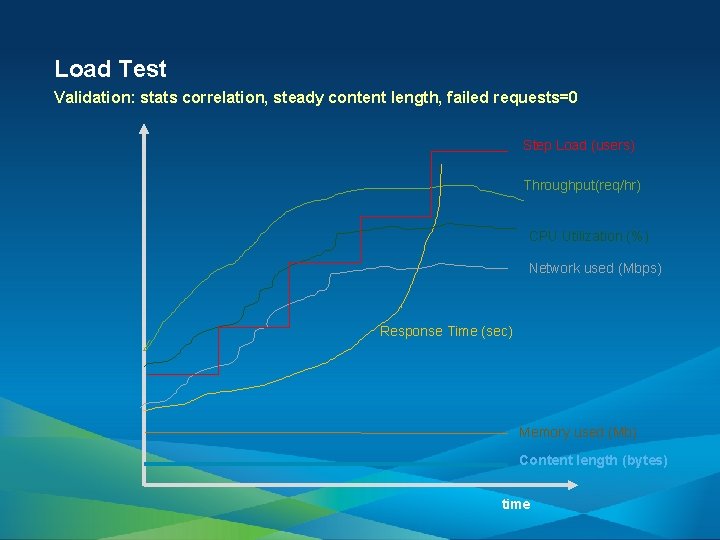
Load Test Validation: stats correlation, steady content length, failed requests=0 Step Load (users) Throughput(req/hr) CPU Utilization (%) Network used (Mbps) Response Time (sec) Memory used (Mb) Content length (bytes) time

Testing • Analysis—Compare and correlate key measurements • Most counters and utilization should be increasing with increased load: - Throughput - Response time - Metrics - - CPU - Network - Disk - Memory Errors

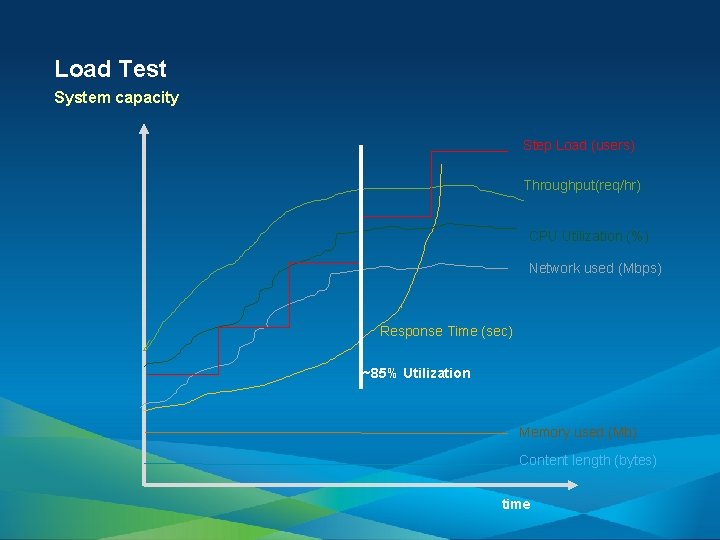
Load Test System capacity Step Load (users) Throughput(req/hr) CPU Utilization (%) Network used (Mbps) Response Time (sec) ~85% Utilization Memory used (Mb) Content length (bytes) time

Load Test System capacity • System capacity can be defined as a user load corresponding to - Maximum throughput - Threshold utilization (e. g. , 80) - SLA response time

Testing Analysis—Valid range • Exclude failure range (e. g. , failure rate > 5%) from the analysis. • Exclude excessive resource utilization range.

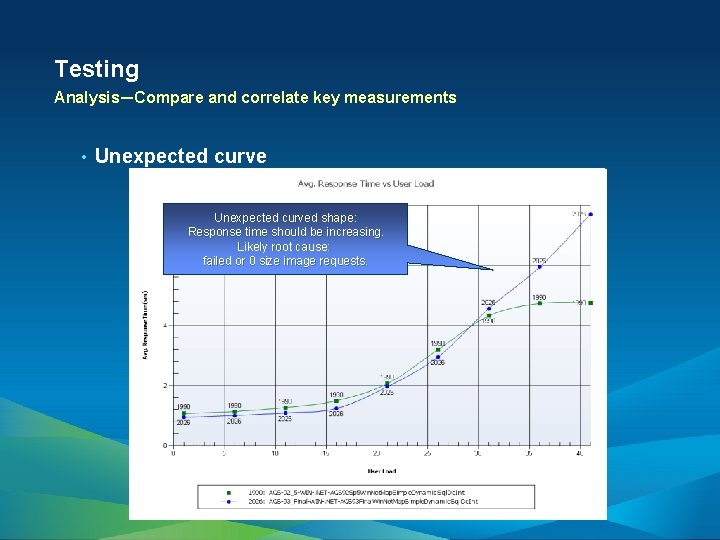
Testing Analysis—Compare and correlate key measurements • Unexpected curved shape: Response time should be increasing. Likely root cause: failed or 0 size image requests.

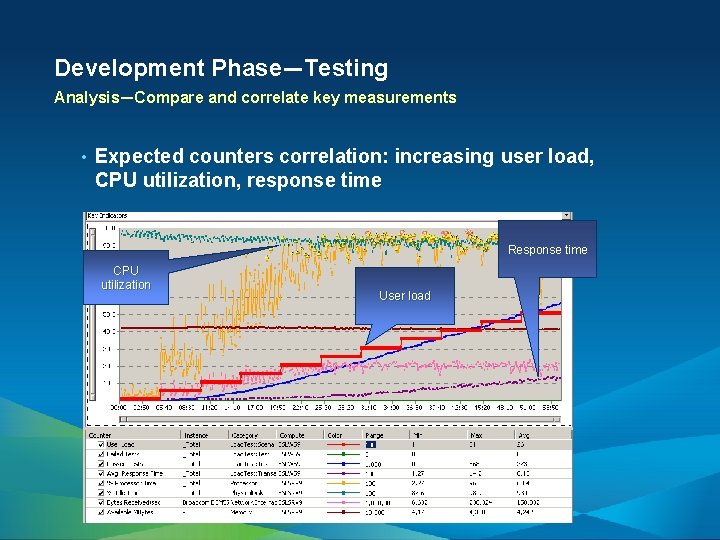
Development Phase—Testing Analysis—Compare and correlate key measurements • Expected counters correlation: increasing user load, CPU utilization, response time Response time CPU utilization User load

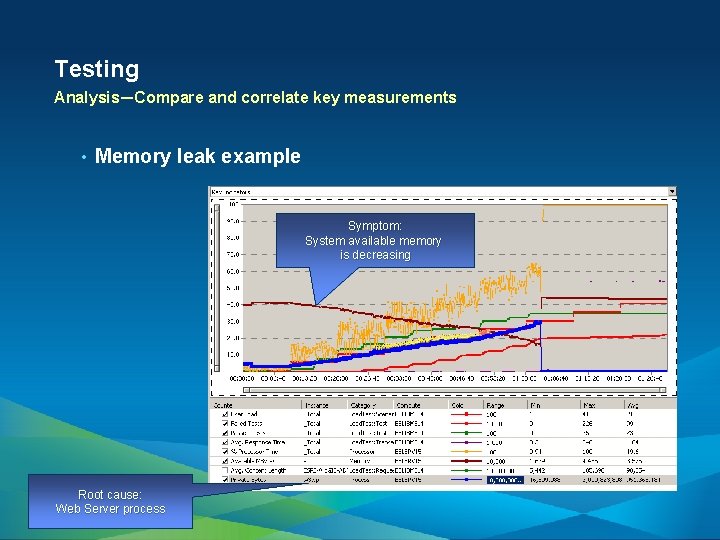
Testing Analysis—Compare and correlate key measurements • Memory leak example Symptom: System available memory is decreasing Root cause: Web Server process

Test Results as Input into Capacity Planning Load Test Results—Riverside Electric • Baseline Test with Single Thread - Note* Service Time Is Load Independent • Think Time=0 • Evaluate Key Metrics • - Throughput - Response Time - QA Check Evaluate System Under Test. - CPU, Network, Memory, and Disk

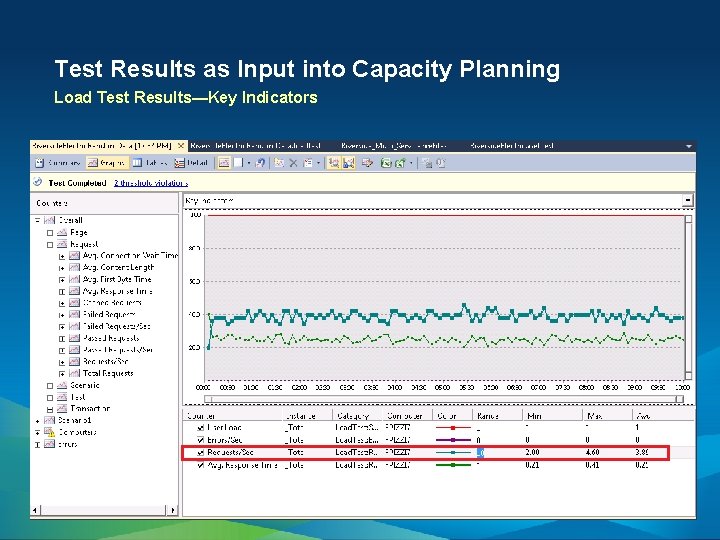
Test Results as Input into Capacity Planning Load Test Results—Key Indicators

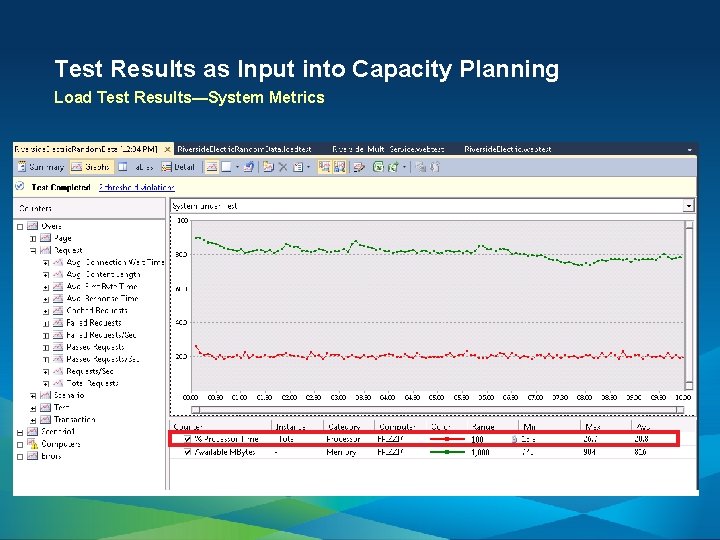
Test Results as Input into Capacity Planning Load Test Results—System Metrics

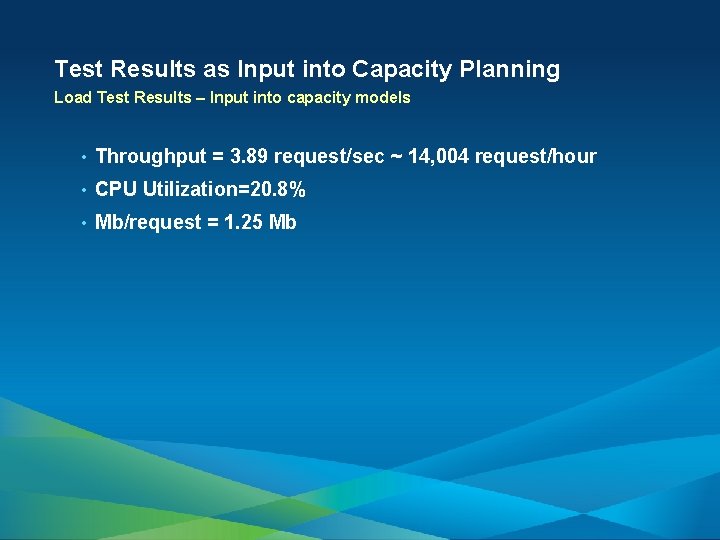
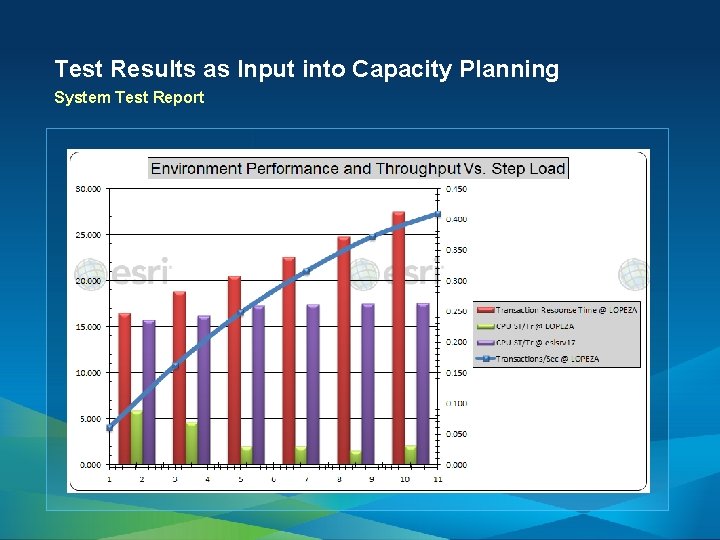
Test Results as Input into Capacity Planning Load Test Results – Input into capacity models • Throughput = 3. 89 request/sec ~ 14, 004 request/hour • CPU Utilization=20. 8% • Mb/request = 1. 25 Mb

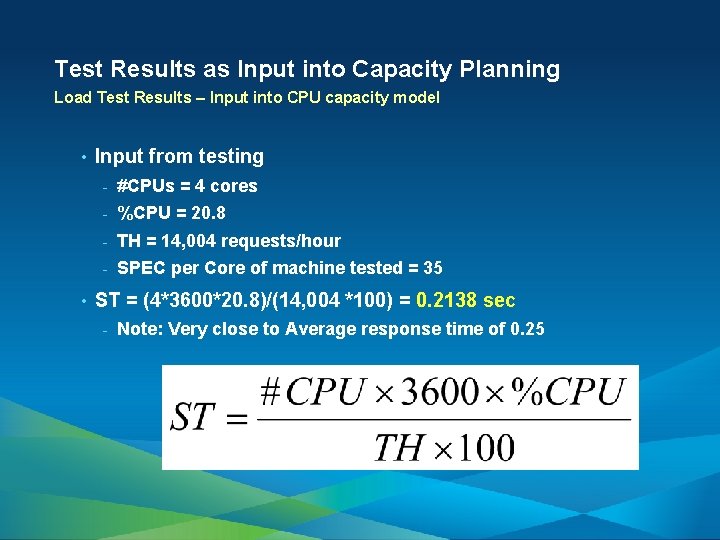
Test Results as Input into Capacity Planning Load Test Results – Input into CPU capacity model • • Input from testing - #CPUs = 4 cores - %CPU = 20. 8 - TH = 14, 004 requests/hour - SPEC per Core of machine tested = 35 ST = (4*3600*20. 8)/(14, 004 *100) = 0. 2138 sec - Note: Very close to Average response time of 0. 25

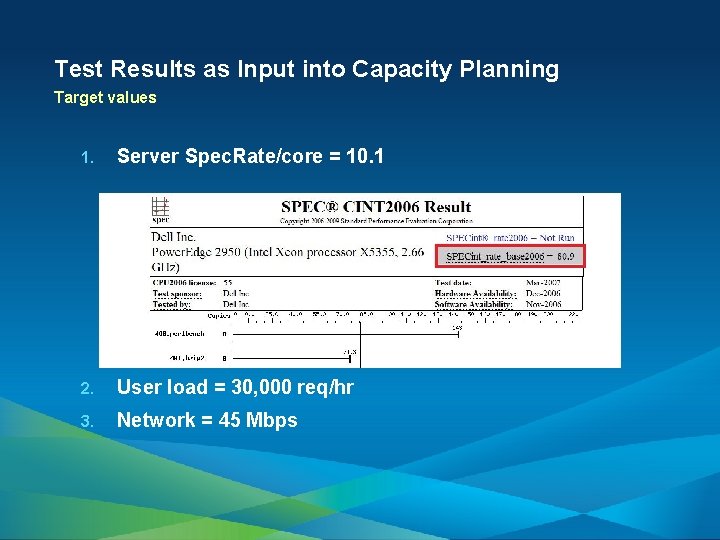
Test Results as Input into Capacity Planning Target values 1. Server Spec. Rate/core = 10. 1 2. User load = 30, 000 req/hr 3. Network = 45 Mbps

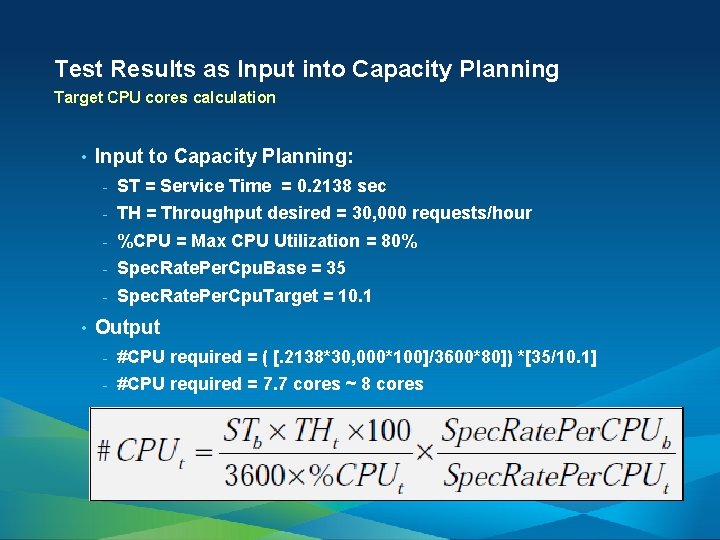
Test Results as Input into Capacity Planning Target CPU cores calculation • • Input to Capacity Planning: - ST = Service Time = 0. 2138 sec - TH = Throughput desired = 30, 000 requests/hour - %CPU = Max CPU Utilization = 80% - Spec. Rate. Per. Cpu. Base = 35 - Spec. Rate. Per. Cpu. Target = 10. 1 Output - #CPU required = ( [. 2138*30, 000*100]/3600*80]) *[35/10. 1] - #CPU required = 7. 7 cores ~ 8 cores

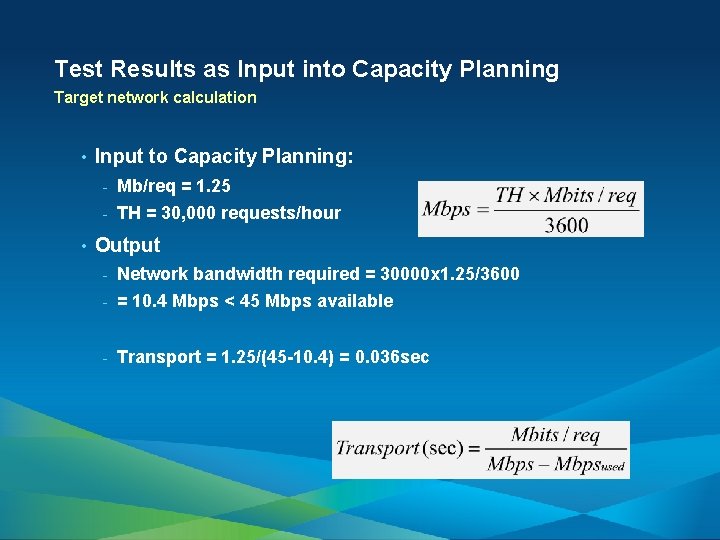
Test Results as Input into Capacity Planning Target network calculation • • Input to Capacity Planning: - Mb/req = 1. 25 - TH = 30, 000 requests/hour Output - Network bandwidth required = 30000 x 1. 25/3600 - = 10. 4 Mbps < 45 Mbps available - Transport = 1. 25/(45 -10. 4) = 0. 036 sec

Test Results as Input into Capacity Planning System Test Report

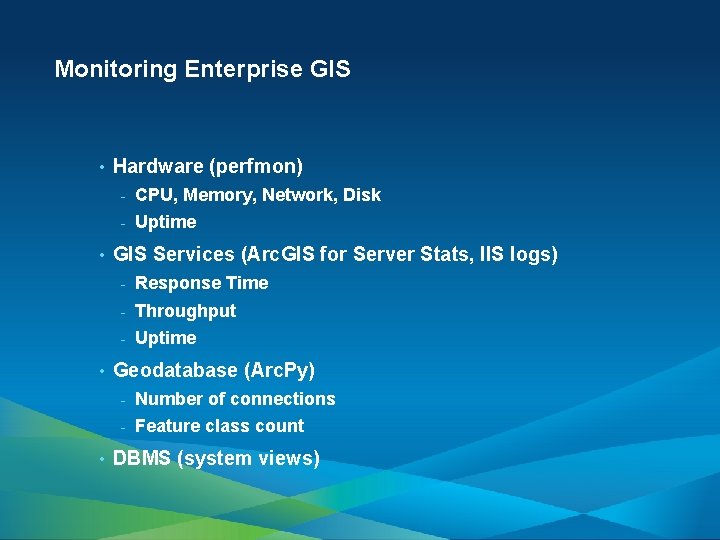
Monitoring Enterprise GIS • • Hardware (perfmon) - CPU, Memory, Network, Disk - Uptime GIS Services (Arc. GIS for Server Stats, IIS logs) - Response Time - Throughput - Uptime Geodatabase (Arc. Py) - Number of connections - Feature class count DBMS (system views)

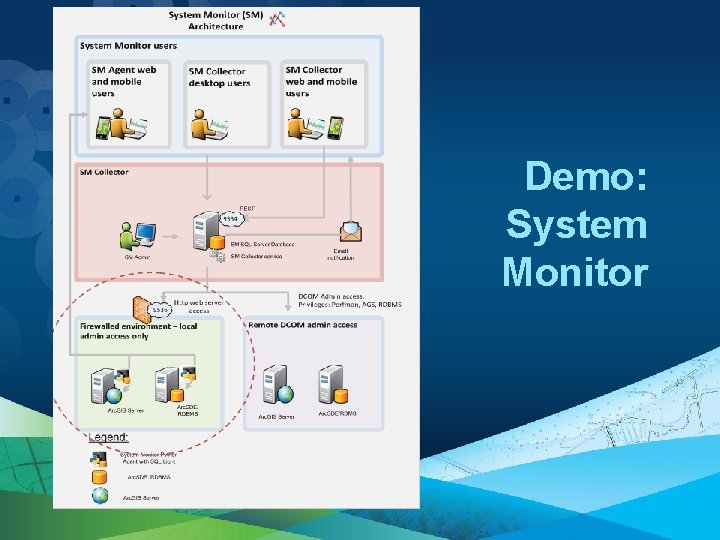
Demo: System Monitor

Contact Us • Frank Pizzi - • James Livingston - • jlivingston@esri. com Aaron Lopez - • fpizzi@esri. com alopez@esri. com Andrew Sakowicz - asakowicz@esri. com

Performance Engineering throughout Project • Tools

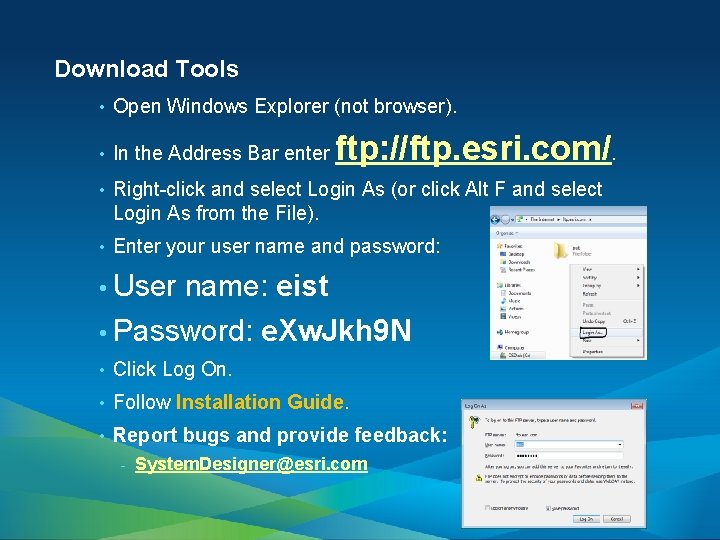
Download Tools • Open Windows Explorer (not browser). • In the Address Bar enter • Right-click and select Login As (or click Alt F and select Login As from the File). • Enter your user name and password: ftp: //ftp. esri. com/. • User name: eist • Password: e. Xw. Jkh 9 N • Click Log On. • Follow Installation Guide. • Report bugs and provide feedback: - System. Designer@esri. com

• Thank you for attending • Open for Questions Frank Pizzi, fpizzi@esri. com Andrew Sakowicz, asakowicz@esri. com • Please fill out the evaluation: www. esri. com/ucsessionsurveys Offering ID: 983