ESETT Investigators meeting Flow Diagram 400 patients were


![LEV Success Rate [95% credible intervals] Probability treatment is the best/ worst 47% [39%,](https://slidetodoc.com/presentation_image_h2/8646a4365d8eb98c78254be116d00b10/image-7.jpg "LEV Success Rate [95% credible intervals] Probability treatment is the best/ worst 47% [39%,")


- Slides: 11
ESETT Investigators meeting
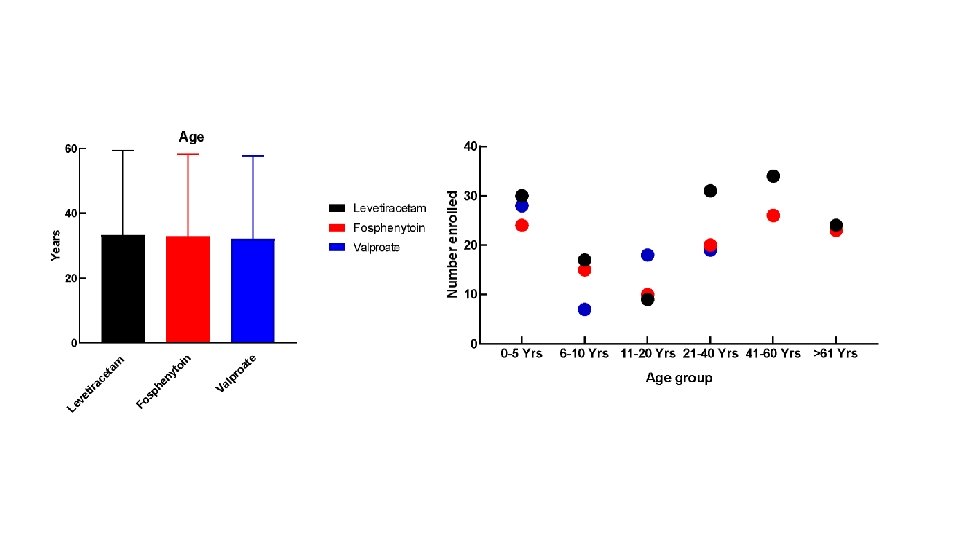
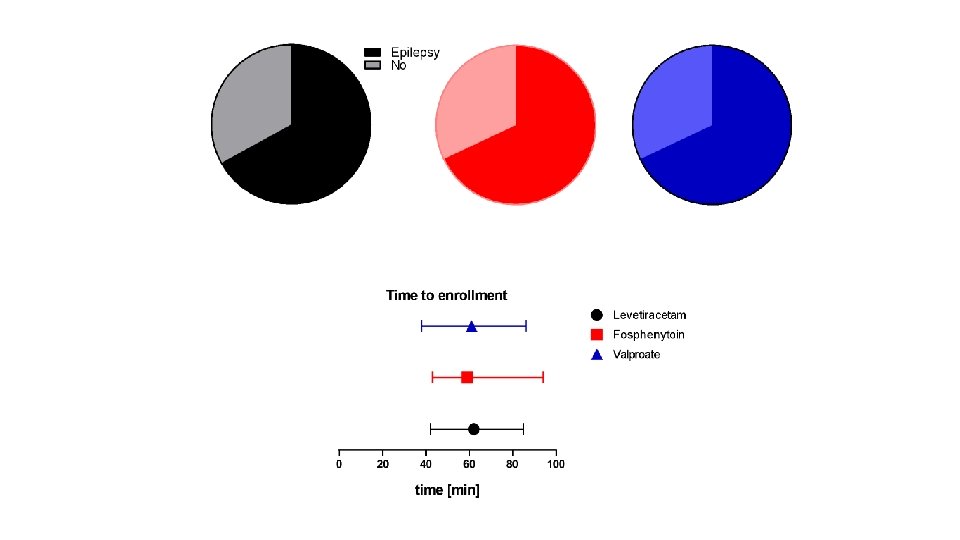
Flow Diagram 400 patients were randomized 16 excluded from the intention-to-treat population for repeat enrollment 5 received levetiracetam 7 received fosphenytoin 4 received valproate 384 unique subjects 145 levetiracetam 118 fosphenytoin 121 valproate 36 excluded from the per protocol analysis 34 had eligibility violations 2 received <80% of infusion 39 excluded from the per protocol analysis 39 had eligibility violations 2 received <80% of infusion (and had eligibility violations) 30 excluded from the per protocol analysis 29 had eligibility violations 2 received <80% of infusion (1 had eligibility violations) 145 included in ITT analysis 109 included in the per protocol analysis 150 included in safety analysis 118 included in ITT analysis 79 included in the per protocol analysis 125 included in safety analysis 121 included in ITT analysis 91 included in the per protocol analysis 125 included in safety analysis
Levetiracetam Fosphenytoin Valproate
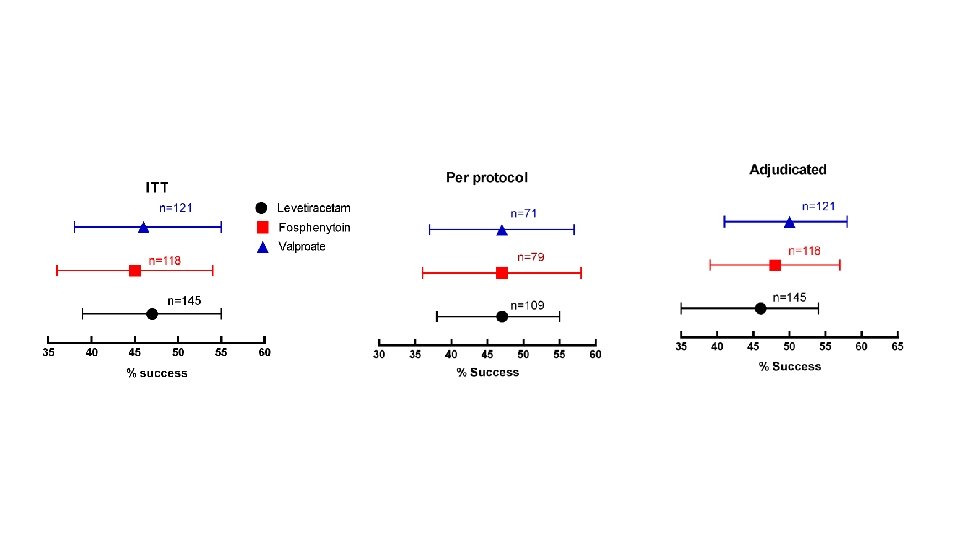
Primary Objective: Which treatment is best? Or, if there is no single best treatment, is there a worst treatment? A Bayesian approach was used to estimate the probability that each treatment is the best or worst. Prior to observing study data all three treatments were considered to be equally likely to be the most effective or least effective treatment.
LEV Success Rate [95% credible intervals] Probability treatment is the best/ worst 47% [39%, 55%] 0. 41 / 0. 24 FOS VPA 45% 46% [36%, 54%] [38%, 55%] 0. 24 / 0. 45 0. 35 / 0. 31
Decision Rule was that the probability 0. 975 to make a claim that one drug was the best or worst. All treatments had probabilities less than 0. 975, and so the conclusion was that neither a best, nor a worst, treatment could be identified. The rates of cessation of seizures at one hour was not different between levetiracetam, fosphenytoin, and valproate, each of which stopped seizures in approximately half of patients.
No statistically significant differences detected for secondary efficacy outcomes Levetiracetam Fosphenytoin N=145 N=118 Admission to intensive care unit Length of ICU stay, days, Valproate N=121 60% 59% 1 (0 - 3) 3 (1 - 7) 3 (1 - 6) 3 (2 - 6) N=68 N=53 N=55 11 (6 - 16) 12 (8 - 21) 7 (5 - 15) n = 14 n = 15 n = 10 78% 81% 78% median (IQR) Length of hospital stay, days, median (IQR) Time to seizure cessation Patients with success on primary outcome Minutes, median (IQR) n = number with audio recording Seizure cessation within 20 minutes
No statistically significant differences detected for safety Safety Levetiracetam Fosphenytoin N=150 N=125 Valproate N=125 Life-threatening hypotension within 60 min of start of study drug infusion <1% 3% 2% Life-threatening cardiac arrhythmia within 60 min <1% 0% 0% Endotracheal intubation within 60 min 20% 26% 17% Acute seizure recurrence 1 - 12 hrs 11% 11% Acute anaphylaxis 0% 0% 0% Acute respiratory depression 8% 13% 8% Hepatic transaminase or ammonia elevations <1% 0% <1% Purple glove syndrome 0% 0% 0% Death 5% 2% 2%