Erosion and Sediment Concepts Streams as Geological Agents


 Ephemeral gully Permanent, incised gully Stream channel")


 diagram showing relationship between sediment load, water discharge, sediment")
 Sediment yield is a function of: 1. Rock type and structure.")
 In drier regions: reduced precip limits veg land vulnerable to erosion.")
 Southern Alaska & southern Andes: large active glaciers contribute to high")

 Most")


 measure")
")
 High organic matter content Non-expansive")


")


- Slides: 41
Erosion and Sediment Concepts
Streams as Geological Agents Streams are vital geologic agents. They: Convey most water moving from land to sea part of the hydrologic cycle). Transport billions of tons of sediment to the oceans each year. The load is the sediment and dissolved matter the stream transports (essential Load expressed in kilograms per cubic meter. Dissolved matter generally does not affect stream behavior.
EROSION “Erosion is a process of detachment and transport of soil particles by erosive agents. ” Ellison, 1944 Erosive Agents Raindrop impact Overland flow surface runoff from rainfall Bed and bank turbulence in streams
TYPES OF EROSION Interrill and rill (sheet-rill) Ephemeral gully Permanent, incised gully Stream channel Mass movement Geologic action of the wind, water, ice and gravity in wearing away rock to form soil and shape the ground
EROSION IS A CONCERN Degrades soil resource - Reduces Soil: Productivity Organic matter Plant nutrients Causes downstream sedimentation Produces sediment that carries pollutants Produces sediment which can be a pollutant
5 Physical factors leading to high soil erosion Intense storms May occur anywhere Likelihood may increase with climate change Sparse vegetation and ground cover Particularly in association with intense storms Post-fire soils highly vulnerable Silt-rich soils Tendency to crusting, giving high runoff when bare Mechanically weak and so highly erodible
5 Physical factors leading to high soil erosion Steep slope gradients (steepest slopes may be on resistant soil or rock) Combination of steep slopes and weak soils most common on marginal lands Large collecting area for runoff Often related to flow convergence rather than slope length
Erosion by Running Water Erosion by water before a distinct channel has formed occurs in two ways: 1. By impact as raindrops hit the ground. 2. By overland flow during heavy rains – AKA sheet erosion. The effectiveness of raindrops and overland flows in eroding the land is greatly diminished by a protective cover of vegetation.
Erosion mechanics Factoid: large raindrops fall at 30 km/hr ! 1. Detachment 2. Transport 3. Deposition Most hillslope erosion is initiated by the impact of raindrops, NOT by the flow of running water
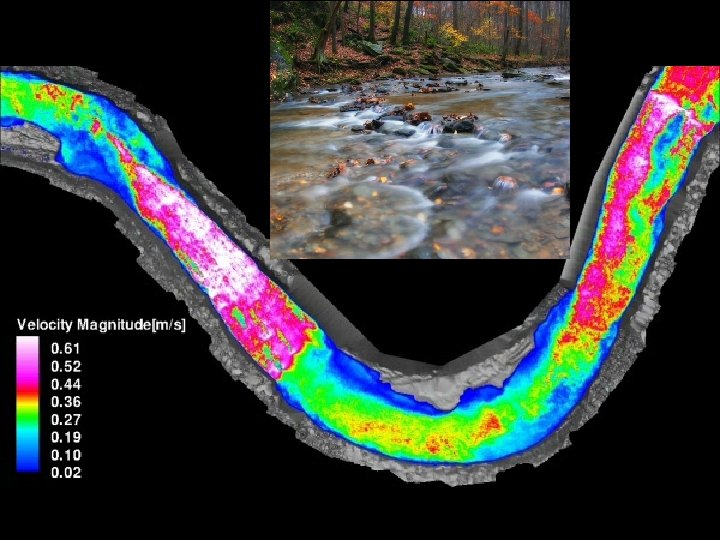
Erosion by Running Water Stream’s erosion potential influenced by how water moves through a stream channel. If velocity very slow water particles travel in parallel layers, a motion called laminar flow. With increasing velocity Seldom occurs in natural streams except in the boundary layer the movement becomes turbulent flow. Ability of stream to pick up & transport sediment particles depends largely on: Turbulence. Velocity of the water.
The Stream’s Load The solid portion of a stream’s load = 2 parts: 1. Bed load: Coarse particles that move along the stream bed. 2. Suspended load: fine particles that are suspended in the water. Wherever they are dropped, these solid particles constitute alluvium. Streams also carry dissolved substances called the dissolved load. These are chiefly a product of chemical weathering.
Hjulströms diagram: Relationship of size and velocity
https: //www. youtube. com/watch? v=AE 771 Ad. F 5 d. M
Stream Load Fluvial propcesses Strahler, A. and Strahler, A. , 2004. Physical Geography. Wiley, NY.
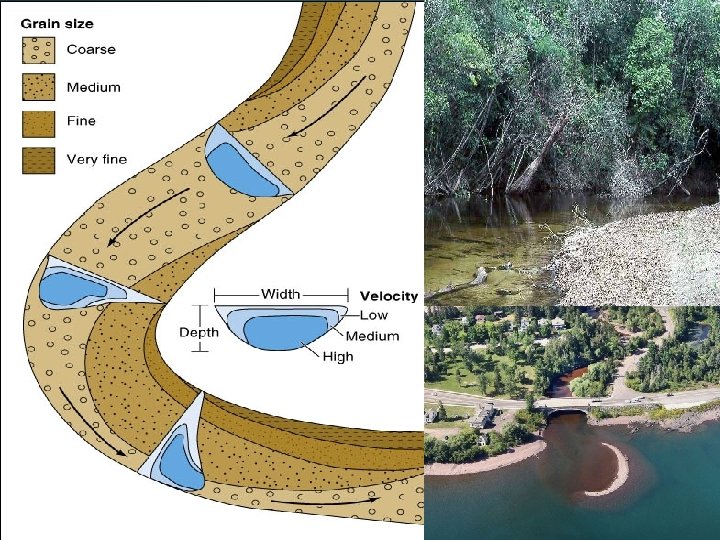
Bed Load Constitutes 5 to 50 % of total stream load. Particles move discontinuously by rolling or sliding at a slower velocity than the stream water. The bed load may move short distances by saltation (series of short intermittent jumps). Coarse-grained sediment is concentrated where velocity high. Finer-grained sediment is found in zones of progressively lower velocity.
https: //www. youtube. com/watch? v=Pk. YDZsm. Mu 5 M
Or stream velocity Lane (1955) diagram showing relationship between sediment load, water discharge, sediment size and channel slope
Sediment Yield (1) Sediment yield is a function of: 1. Rock type and structure. 2. Local climate. 3. Relief and slope. The ↑ the precipitation the ↑ the potential erosion. In moist regions, plant roots tend to anchor the soil, thereby curtailing erosion. In temperate eastern North America and Western Europe, vegetation cover is more or less continuous and erosion rates are low.
Sediment Yield (2) In drier regions: reduced precip limits veg land vulnerable to erosion. Areas with abundant precipitation may actually experience erosion than some relatively dry regions, less Fields measurements suggest that some of the greatest local sediment yields are from desert landscapes. Some of the highest measured sediment yields are from basins that drain steep mountains along plate boundaries. Monsoon regions of southeastern Asia receive abundant precipitation that generates high runoff.
Sediment Yield (3) Southern Alaska & southern Andes: large active glaciers contribute to high sediment yields. Highly jointed or fractured rocks: susceptible to erosion than massive rocks. Human more activities (eg: forest clearing, cultivation, damming, construction of cities…) also affect erosion rates and sediment yields.
Langbein and Schumm Model Slope erosion
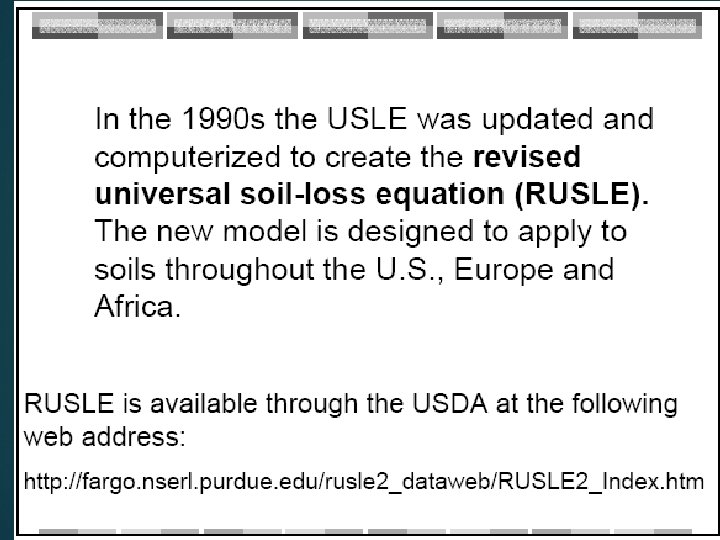
Universal Soil Loss Equation Measures amount of soil lost per unit area (ton/acre) Most widely used model Empirically based Watch your units! USLE still hidden in some more complex models Various more complex models now available WEPP Watershed Erosion Prediction Project
USLE - Universal Soil Loss Equation A = RKLSCP = Annual soil loss rate R= rainfall erosivity K= soil erodibility L = slope length S = slope steepness C = cover and management P = erosion-control practices Hydrologic cycle factor Soil/topographyrelated factors Land management factors Revised (RUSLE) and Modified (MUSLE) versions also exist
Units
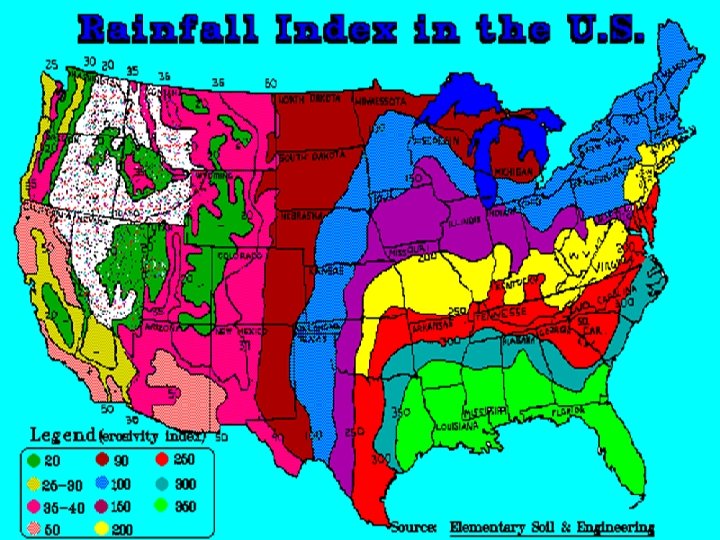
Terms Defined: A = RKLSCP = Annual soil loss rate Rainfall Erosivity (R) measure of total rainfall + intensity + seasonal distribution R = E*I E I for a given storm is the kinetic energy of the storm is the maximum 30 -minute intensity of the storm EI is calculated for each storm and then summed to get the annual erosivity index Figure 9. 6 in your book shows R for the U. S.
Terms Defined: A = RKLSCP = Annual soil loss rate Soil Erodibility factor (K) Soil’s susceptibility to erosion based: 1. Infiltration capacity 2. Structural stability Particle cohesion cementation by organic matter clays and Particle mass (2. 0 g/cm 3 for bauxite, 5. 3 for hematite, 7. 6 for galena)
Soil properties resulting in low K values (less erosion) High organic matter content Non-expansive clays Strong granular structure “stoniness” & macropores Nomograph (figure 9. 8 in text) reports K value Nomograph uses values of: % silt and very fine sand, % organic matter, soil structure, and soil permeablity
Derive K from Nomograph 1: % silt + fine sand: 65% 2: % Sand: 5% 3: % OM: 3% 4: Soil structure Fine granular 5: Permeability Slow to mod 6: find K (0. 31
Soil erodibility factor for various soil textures
Terms Defined: A = RKLSCP = Annual soil loss rate L*S topographic factors that considers the length and steepness of slope More erosion from steep, longer slopes Everything Figure compared to a 9% slope of 72. 6 feet 9. 10, in your book
Combined topographic factor
Terms Defined: A = RKLSCP = Annual soil loss rate Cover and management factor (C) use & land cover including: Vegetation cover Crop sequence Productivity level Length of growing season Tillage practices Residue management Temporal distribution of erosion events land
Ag systems: C based on crop rotation and tillage practices Forest and range systems: C based on vegetation density (% ground cover) and litter/duff condition Tbl 9. 1: C factors for non-ag systems Tbl 9. 2: C factors for Ohio crops
1. Mulch as a means to reduce erosion A = RKLSCP C = cover and management
Terms Defined: A = RKLSCP = Annual soil loss rate Support practice factor (P) physical structures or other measures designed to slow runoff Often this factor = 1, no practice in place Contouring Strip cropping Terracing Table 9. 3 in your book show P factors Read through the example problems in your book
A few practices to reduce soil loss caused by timber production Tree removal: cable not skidder Scheduling: when dry or frozen. snow great. Road design: 99% of soil loss avoided by gravel, planting grasses on road cuts Buffer strips: 1. 5 x height of tallest trees
Last Slide of Class: Notes on USLE