
ERCOT Resmi Surendran Sr Mgr Wholesale Market Ops

- Slides: 9
ERCOT Resmi Surendran Sr. Mgr. Wholesale Market Ops and Analysis May 12, 2017
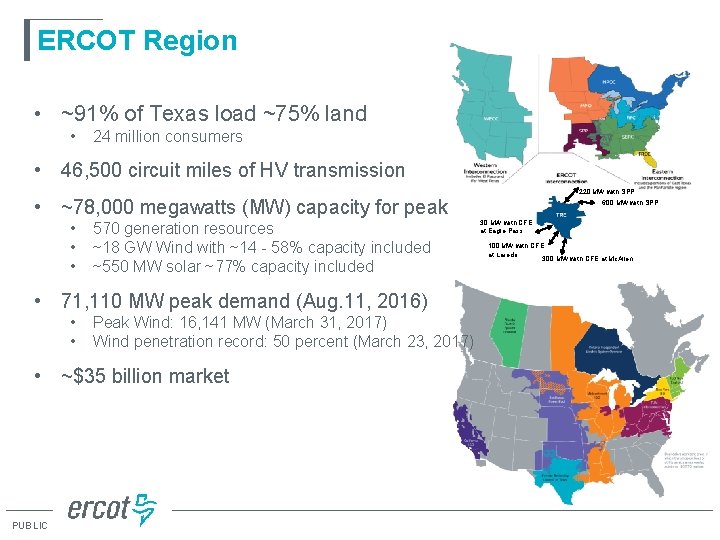
ERCOT Region • ~91% of Texas load ~75% land • 24 million consumers • 46, 500 circuit miles of HV transmission 220 MW with SPP • ~78, 000 megawatts (MW) capacity for peak • • • 570 generation resources ~18 GW Wind with ~14 - 58% capacity included ~550 MW solar ~77% capacity included • 71, 110 MW peak demand (Aug. 11, 2016) • • Peak Wind: 16, 141 MW (March 31, 2017) Wind penetration record: 50 percent (March 23, 2017) • ~$35 billion market PUBLIC 600 MW with SPP 30 MW with CFE at Eagle Pass 100 MW with CFE at Laredo 300 MW with CFE at Mc. Allen
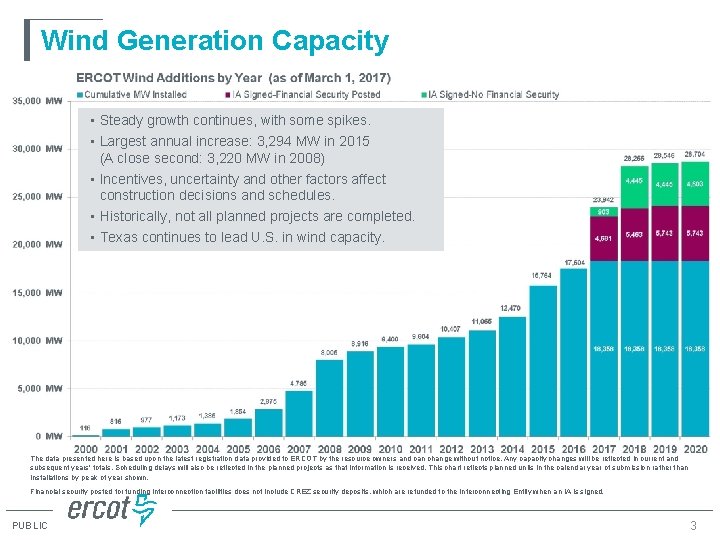
Wind Generation Capacity • Steady growth continues, with some spikes. • Largest annual increase: 3, 294 MW in 2015 (A close second: 3, 220 MW in 2008) • Incentives, uncertainty and other factors affect construction decisions and schedules. • Historically, not all planned projects are completed. • Texas continues to lead U. S. in wind capacity. The data presented here is based upon the latest registration data provided to ERCOT by the resource owners and can change without notice. Any capacity changes will be reflected in current and subsequent years' totals. Scheduling delays will also be reflected in the planned projects as that information is received. This chart reflects planned units in the calendar year of submission rather than installations by peak of year shown. Financial security posted for funding interconnection facilities does not include CREZ security deposits, which are refunded to the Interconnecting Entity when an IA is signed. PUBLIC 3
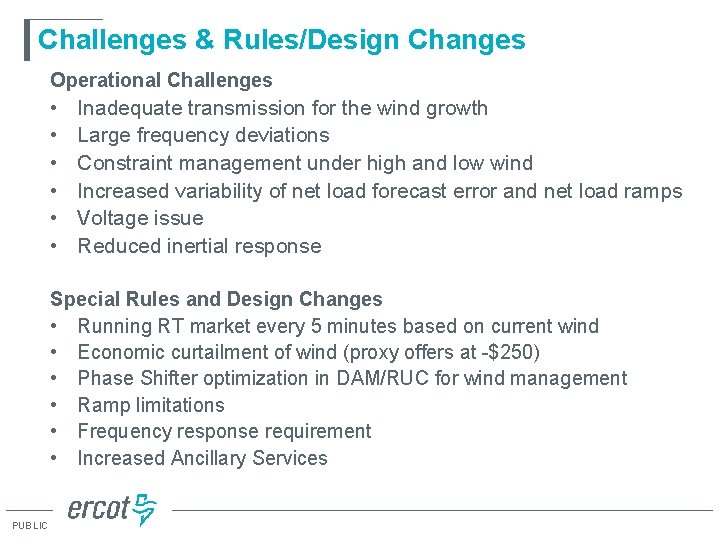
Challenges & Rules/Design Changes Operational Challenges • • • Inadequate transmission for the wind growth Large frequency deviations Constraint management under high and low wind Increased variability of net load forecast error and net load ramps Voltage issue Reduced inertial response Special Rules and Design Changes • Running RT market every 5 minutes based on current wind • Economic curtailment of wind (proxy offers at -$250) • Phase Shifter optimization in DAM/RUC for wind management • Ramp limitations • Frequency response requirement • Increased Ancillary Services PUBLIC
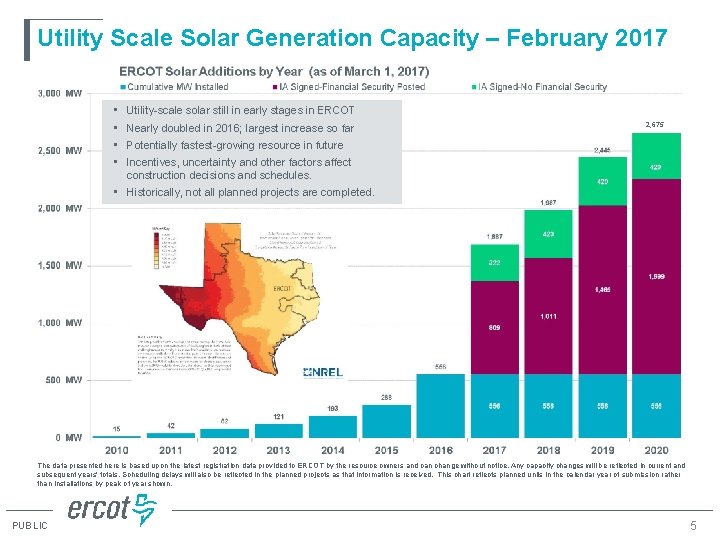
Utility Scale Solar Generation Capacity – February 2017 • • Utility-scale solar still in early stages in ERCOT Nearly doubled in 2016; largest increase so far 2, 675 Potentially fastest-growing resource in future Incentives, uncertainty and other factors affect construction decisions and schedules. • Historically, not all planned projects are completed. The data presented here is based upon the latest registration data provided to ERCOT by the resource owners and can change without notice. Any capacity changes will be reflected in current and subsequent years' totals. Scheduling delays will also be reflected in the planned projects as that information is received. This chart reflects planned units in the calendar year of submission rather than installations by peak of year shown. PUBLIC 5
Questions? resmi_surendran@ercot. com PUBLIC 6
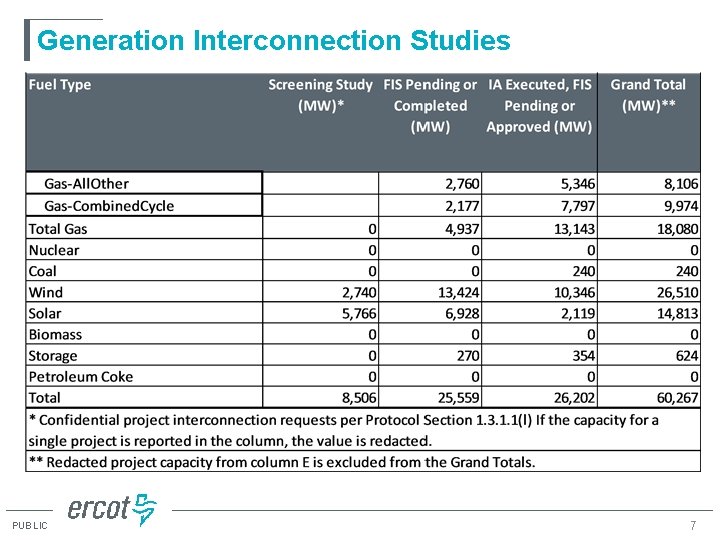
Generation Interconnection Studies PUBLIC 7
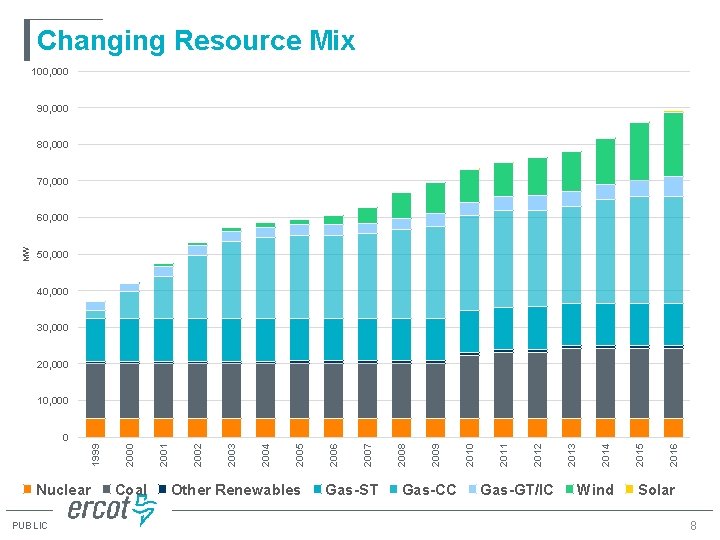
Changing Resource Mix 100, 000 90, 000 80, 000 70, 000 MW 60, 000 50, 000 40, 000 30, 000 20, 000 10, 000 Nuclear PUBLIC Coal Other Renewables Gas-ST Gas-CC Gas-GT/IC Wind 2016 2015 2014 2013 2012 2011 2010 2009 2008 2007 2006 2005 2004 2003 2002 2001 2000 1999 0 Solar 8
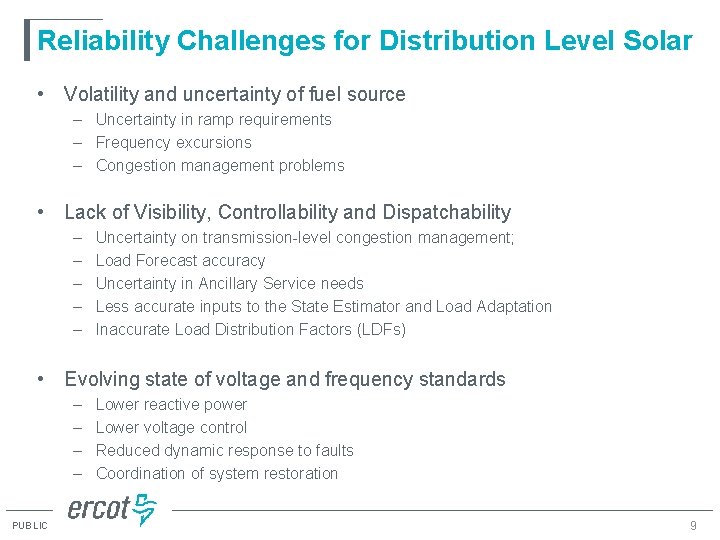
Reliability Challenges for Distribution Level Solar • Volatility and uncertainty of fuel source – Uncertainty in ramp requirements – Frequency excursions – Congestion management problems • Lack of Visibility, Controllability and Dispatchability – – – Uncertainty on transmission-level congestion management; Load Forecast accuracy Uncertainty in Ancillary Service needs Less accurate inputs to the State Estimator and Load Adaptation Inaccurate Load Distribution Factors (LDFs) • Evolving state of voltage and frequency standards – – PUBLIC Lower reactive power Lower voltage control Reduced dynamic response to faults Coordination of system restoration 9