Equitable Lease Arrangements Damona Doye OSU Extension Economist

Equitable Lease Arrangements Damona Doye OSU Extension Economist http: //agecon. okstate. edu/efarmmanagement/

Cash and share lease agreements n What portion of the income do I receive? n What portion of the costs do I contribute? n What portion of the risk do I bear? n What crop and land management practices will be followed? n What will be the condition of the land improvements at the end of the lease? n Single or multiple years?

What is fair? Not fair? Fair does not equal legal. Legal does not equal fair. Everything is negotiable up front. Legal is what you agreed to or if not addressed, what the law substitutes.

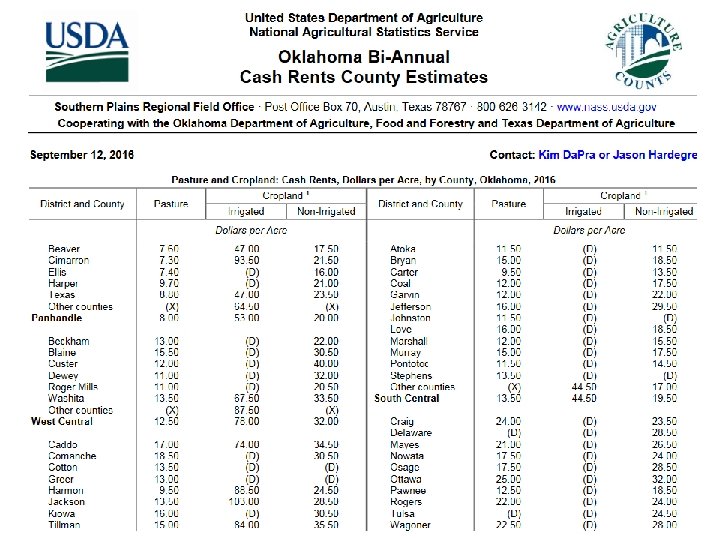
USDA/NASS data

USDA/NASS

Determining an equitable rent n Landlord’s ownership costs plus return to equity n Residual income method n Market approach

Determining an equitable rent n Landlord’s ownership costs plus return to equity q Property taxes on land: q Improvements n n $2 Repairs and maintenance Property taxes Insurance Depreciation q Desired return on equity: $1, 700 @ 3% = $51

Determining an equitable rent n Residual income method q Returns n Grain, government payments, other q Variable costs n Seed, fertilizer, chemicals, fuel, harvest costs, labor, etc. q Fixed costs n n Insurance Taxes Depreciation Interest on investment

Valuing fixed contributions n Machinery and equipment q Custom rates n Management q Percent of average capital invested q Percent of gross farm receipts n Land q q “Safe” rate Divide annual cash rent by per acre land value

Effect of land quality and farm cost on crop-share rental arrangements Annual yield per acre Annual operating cost per acre ($) Costs ½ tenant Most productive land 2/3 tenant Least productive land

agecon. okstate. edu/budgets

www. agecon. okstate. edu/budgets

Average dryland cropland cash rent for state = $30/a Average dryland pasture cash rent for state = $13. 50/a

Northcentral Northwest East Southwest Oklahoma Farmland Leasing Regions
 NW SW NC E State Number")
Average Annual Dryland Crop Cash Rental Rates ($/acre) NW SW NC E State Number of observ. 23 29 31 19 102 Avg acres in lease 510 740 605 163 540 177 Avg years lease held 14 10 15 15 11 7 13 10 31. 22 37. 07 35. 00 39. 21 40. 00 30. 75 36. 01 35. 00 Wheat Alfalfa 46. 69 50. 00 Grain Sorghum 38. 78 Source: OSU CR-230, 2017

Dryland Wheat Cash Rental Rate Response Distribution Percent of Responses 40 34 35 30 25 21 21 20 19 15 10 5 4 0 10 -19. 99 20 -29. 99 30 -39. 99 $/acre 40 -49. 99 50+
 Native Pasture NW SW NC E State 10.")
Average Pasture Cash Rental Rates ($/acre) Native Pasture NW SW NC E State 10. 94 10. 00 12. 78 12. 00 13. 59 13. 00 16. 73 14. 50 13. 95 12. 00 20. 27 24. 55 17. 50 23. 96 20. 00 22. 79 25. 55 20. 00 22. 09 20. 00 Bermuda Other Pasture 17. 83 10. 66 Source: OSU CR-216, 2017 17. 40

Native Pasture Cash Rental Rate Response Distribution Percent of Responses 50 45 40 35 30 25 20 15 10 5 0 43 21 15 17 1 0 -4. 99 5 -9. 99 10 -14. 99 $/acre 15 -19. 99 20+

Bermuda Pasture Cash Rental Rate Response Distribution Percent of Responses 35 30 30 28 25 20 15 18 15 9 10 5 0 0 -11. 99 12 -16. 99 17 -21. 99 $/acre 22 -26. 99 27+

Determining an equitable cash rent n Landlord’s ownership costs plus return to equity = $53 n Residual income method = None n Market approach = $30. 50

Determining an equitable share rent n Share total returns in the same proportion as total expenses are contributed q Variable expenses n to incentivize output-enhancing inputs, share variable expenses in the same percentage as crop is shared q Fixed expenses n determine the percent contribution of total value of fixed items contributed by each party (tenant = machinery and equipment, labor, management; landlord = land) n Adjust share arrangements to reflect the impact of new technologies, improvements, land quality n Compensate tenant at the end of the lease for the unused portion of investments

Typical Oklahoma Cropland Share Lease Agreement Income items shared Landlord’s share Crop 1/3 Gov’t. payments, other income 1/3 Expense items shared Seed None Fertilizer 1/3 Pesticide 1/3 (or none) Chemical applications None (or 1/3) Harvesting Lime application Irrigation Source: OSU CR-230, 2017 None 1/3 (or all or none) None (or 1/3)

Tenant’s Share of Herbicide Expense 60 55 50 40 35 30 20 10 0 6 4 0 1 -35 0 36 -63 64 -71 72 -80 Percent of Responses Source: OSU CR-230, 2017 81 -99 100

Tenant’s Share of Lime Expense 60 49 50 40 30 30 20 17 10 4 0 0 0 1 -35 0 36 -63 64 -80 Percent of Responses Source: OSU CR-230, 2017 81 -99 100

Coming to agreement. . n Both tenants and landlords should estimate their contributions to production n Use of area standards or traditions may not be in the best interest of either party n Worksheets and spreadsheets are available to summarize contributions and analyze alternatives n Equitable agreements are negotiated

Put the agreement in writing! n Encourages understanding by both parties n Serves as a reminder of terms agreed upon n Legal resource and guide for heirs n Review agreements annually in advance of the renewal date n Update, modify agreements when the operating environment changes significantly Consult with a lawyer.

Leasing resources n www. aglease 101. org, publications, downloadable lease forms, worksheets n www. aglease. info, OSU production and management info n www. agecon. okstate. edu/budgets n www. osufacts. okstate. edu q q CR-216, OK Pasture Rental Rates CR-230, OK Cropland Rental Rates AGEC-940 Tax Aspects of Leasing AGEC-198, Negotiation Strategies n http: //www. nass. usda. gov/Statistics_by_State/Oklahoma/ Publications/County_Estimates/index. php q Cash rents
- Slides: 28