EPSU young workers and precarious work Nick Clark


")
")

")

")


")
")
")
")


")
")
")
")
")
")
")
")
 60. 0 50. 0 40. 0")
 60. 0 50. 0 40. 0")
 60. 0 50. 0 40. 0")


- Slides: 44
EPSU – young workers and precarious work Nick Clark Working Live Research Institute
Main themes u 3 Key sectors: u Energy & water u Public administration, defence, social security u Health & social care u 16 -24 year olds u Employment u Precarity u Collective bargaining u Training, progression & careers
EU 27 and selected countries u Bulgaria u Czech Republic u France u Germany u Greece u Italy u Netherlands u Spain u UK
Youth in the European labour market u High level of unemployment (21% compared to 10%, ranging from 8% Austria to 46% Spain) u Low activity rate (50 -60%, compared to 70%+) u Increasing participation in tertiary education u In work, more likely to u. Have temporary contract (4 times more likely) u. Work part-time involuntarily u. Be low paid u Less u. Be u Hit likely to self-employed hard during the crisis
Change in youth unemployment rates 20072010 (EU 27)
Change in youth unemployment rates 20072010 (EU 27)
Part time as % of all workers, 15 -24 yrs 80. 0 70. 0 60. 0 EU (27 countries) 50. 0 40. 0 Bulgaria Czech Repc Germany Greece Spain 30. 0 France Italy 20. 0 Netherlands UK 10. 0 20 0 6 Q 20 3 06 Q 20 4 07 Q 20 1 07 Q 20 2 07 Q 20 3 07 Q 20 4 08 Q 20 1 08 Q 20 2 08 Q 20 3 08 Q 20 4 09 Q 20 1 09 Q 20 2 09 Q 20 3 09 Q 20 4 10 Q 20 1 10 Q 20 2 10 Q 20 3 10 Q 20 4 11 Q 20 1 11 Q 2 0. 0
Proportion 16 -24 year olds with temporary contract (Eurostat Q 2 2010)
Change in temporary employment
Activity status young people EU 27, 2008 (from EMCO report no 5 , 2010)
Policy context in Europe u u Youth on the Move – Commission’s 2010 initiative, primarily aimed at improving educational levels, but also to launch “Youth employment framework” Interventions to support young workers in OECD countries report (World Bank 2007) found direct employment strategies in US and Canada, but not European Employment Observatory Review, Youth employment measures, 2010 (published Feb 2011) – no policy initiatives reported relating to state as employer Eurofound study (2011) finds active labour market strategies common government response (sometimes contested by unions), but again no mention of public sector’s role as employer u “Overall, governments’ policies towards young workers have tended to emphasise the importance of getting young people into work, no matter the quality of the jobs available. ”
YOUNG WORKERS & PUBLIC SERVICES
Youth employment by sector 2005 (EU-25)
Youth employment by sector 2005 (EU-25)
Youth employment by sector 2005 (EU-25)
Youth employment by sector 2005 (EU-25)
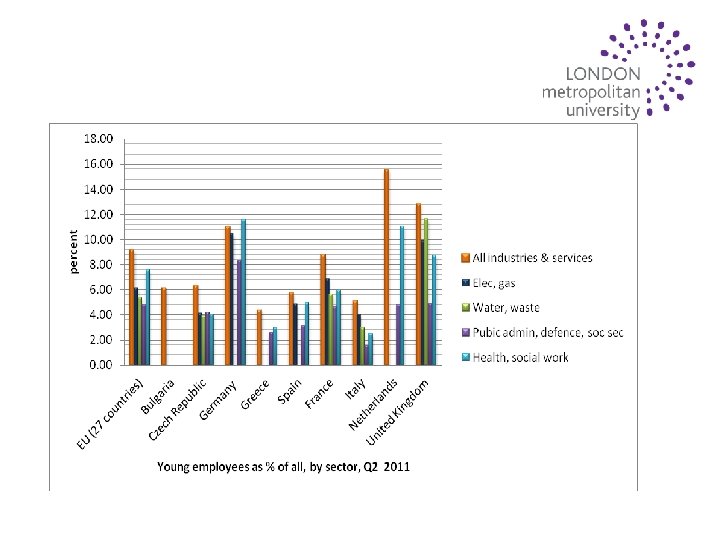
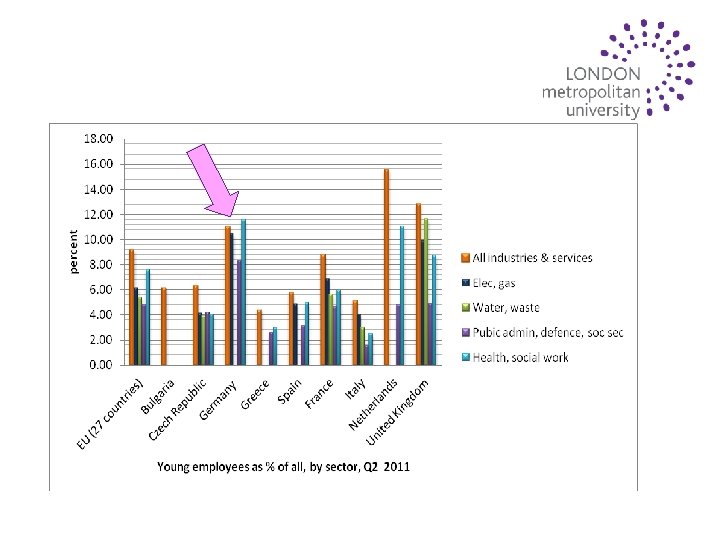
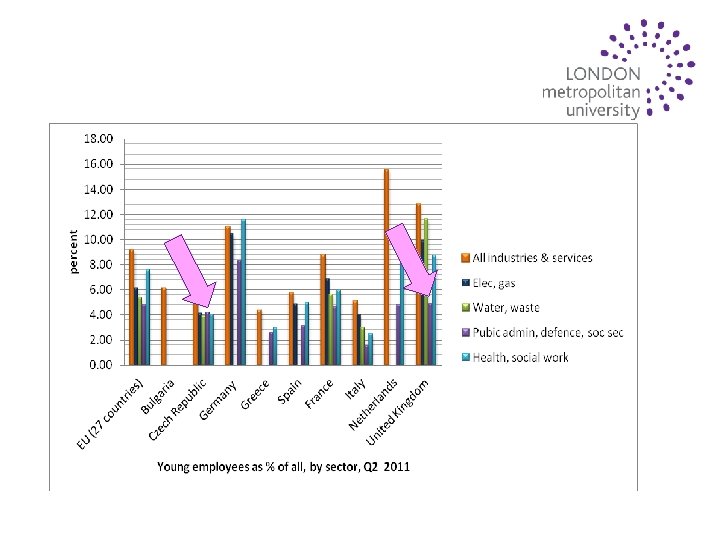
Ranked by proportion of youth in population All industries & services Elec, gas Water, waste Pubic admin, defence, soc sec Health, social work as prop of working age population 25 Youth (15 -24) as proportion of all employees, Q 2 2011 20 15 percent 10 5 0 Greece Spain Italy Germany Czech Rep EU (27) Bulgaria France UK Netherlands
Ranked by proportion of youth in population All industries & services Elec, gas Water, waste Pubic admin, defence, soc sec Health, social work as prop of working age population 25 Youth (15 -24) as proportion of all employees, Q 2 2011 20 15 percent 10 5 0 Greece Spain Italy Germany Czech Rep EU (27) Bulgaria France UK Netherlands
Ranked by proportion of youth in population All industries & services Elec, gas Water, waste Pubic admin, defence, soc sec Health, social work as prop of working age population 25 Youth (15 -24) as proportion of all employees, Q 2 2011 20 15 percent 10 5 0 Greece Spain Italy Germany Czech Rep EU (27) Bulgaria France UK Netherlands
Ranked by proportion of youth in population All industries & services Elec, gas Water, waste Pubic admin, defence, soc sec Health, social work as prop of working age population 25 Youth (15 -24) as proportion of all employees, Q 2 2011 20 15 percent 10 5 0 Greece Spain Italy Germany Czech Rep EU (27) Bulgaria France UK Netherlands
Ranked by proportion of youth in population All industries & services Elec, gas Water, waste Pubic admin, defence, soc sec Health, social work as prop of working age population 25 Youth (15 -24) as proportion of all employees, Q 2 2011 20 15 percent 10 5 0 Greece Spain Italy Germany Czech Rep EU (27) Bulgaria France UK Netherlands
Ranked by proportion of youth in population All industries & services Elec, gas Water, waste Pubic admin, defence, soc sec Health, social work as prop of working age population 25 Youth (15 -24) as proportion of all employees, Q 2 2011 20 15 percent 10 5 0 Greece Spain Italy Germany Czech Rep EU (27) Bulgaria France UK Netherlands
Ranked by proportion of youth in population All industries & services Elec, gas Water, waste Pubic admin, defence, soc sec Health, social work as prop of working age population 25 Youth (15 -24) as proportion of all employees, Q 2 2011 20 15 percent 10 5 0 Greece Spain Italy Germany Czech Rep EU (27) Bulgaria France UK Netherlands
Sectoral change in employment by age 2008 -2010 in France (Schulze-Marmeling, HERA on EIRO)
Sectoral change in employment by age 2008 -2010 in France (Schulze-Marmeling, HERA on EIRO)
Sectoral change in employment by age 2008 -2010 in France (Schulze-Marmeling, HERA on EIRO)
Sectoral change in employment by age 2008 -2010 in France (Schulze-Marmeling, HERA on EIRO)
Use of agency labour (CIETT figures)
Use of agency labour (CIETT figures)
Use of agency labour (CIETT figures)
Use of agency labour (CIETT figures)
Job security and age: French civil service (2008) 60. 0 50. 0 40. 0 30. 0 < 30 ans (en %) Hommes 20. 0 < 30 ans (en %) Femmes < 30 ans (en %) Total 10. 0 re tè ta l To M ilit ai re m in is s, ci nt s ag e ta l To s c et ls vi at d' Ét rs O uv rie tit on N Ti tu ul a la ire s s 0. 0
Job security and age: French civil service (2008) 60. 0 50. 0 40. 0 30. 0 < 30 ans (en %) Hommes 20. 0 < 30 ans (en %) Femmes < 30 ans (en %) Total 10. 0 re tè ta l To M ilit ai re m in is s, ci nt s ag e ta l To s c et ls vi at d' Ét rs O uv rie tit on N Ti tu ul a la ire s s 0. 0
Job security and age: French civil service (2008) 60. 0 50. 0 40. 0 30. 0 < 30 ans (en %) Hommes 20. 0 < 30 ans (en %) Femmes < 30 ans (en %) Total 10. 0 re tè ta l To M ilit ai re m in is s, ci nt s ag e ta l To s c et ls vi at d' Ét rs O uv rie tit on N Ti tu ul a la ire s s 0. 0
Youth as % all temps: health & social work q 1 2008 -q 2 2011, EU 27 29. 5 29. 0 28. 5 28. 0 27. 5 27. 0 26. 5 26. 0 25. 5 25. 0 1 2 3 4 5 6 7 8 Quarter 9 10 11 12 13 14
Youth as % all temps: public admin, defence, social sec. q 1 2008 -q 2 2011, EU 27 27. 0 26. 0 25. 0 24. 0 23. 0 22. 0 21. 0 1 2 3 4 5 6 7 8 9 10 11 12 13 14
Youth as % all temps: water, waste q 1 2008 -q 2 2011, EU 27 30. 0 25. 0 20. 0 15. 0 10. 0 5. 0 0. 0 1 2 3 4 5 6 7 8 9 10 11 12 13 14
Youth as % all temps: electricity, gas, etc. q 1 2008 -q 2 2011, EU 27 60. 0 50. 0 40. 0 30. 0 20. 0 10. 0 1 2 3 4 5 6 7 8 9 10 11 12 13 14
summary from data u u Unemployment becoming more widespread amongst Europe’ young workers As measures (but not definitions) of precarity, temporary contracts and involuntary part time working more prevalent Public services perform worse than economy as a whole in employing young workers – public administration universally the worst Young workers more affected by crisis – particularly in public services
Interviews – key themes u Forms of precarious work amongst young workers in target sectors, u Social dialogue: u Recruitment of young workers u Training for young workers u transition of young workers from precarious to more stable work u Precarious work: u Temporary contracts (including agencies) u Stages, apprenticeships u actions by unions
Preliminary outcome from interviews u absence of recruitment of young workers u precarious forms of work u previous agreements being abandoned or breached u ending of government support programme u amendments to legal protections u development of youth networks