Epidemiology Regional to Local Focus Paul Jepson The

")


Degree-day models: accumulate a daily \"heat unit index\" (DD total)")
")


")


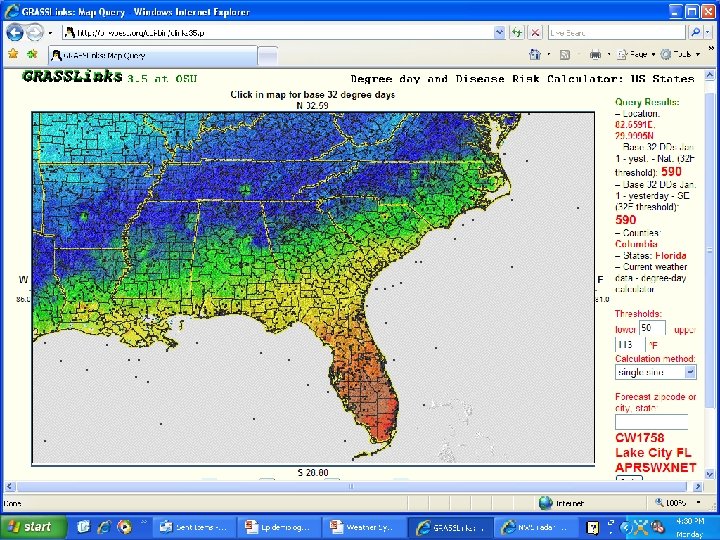
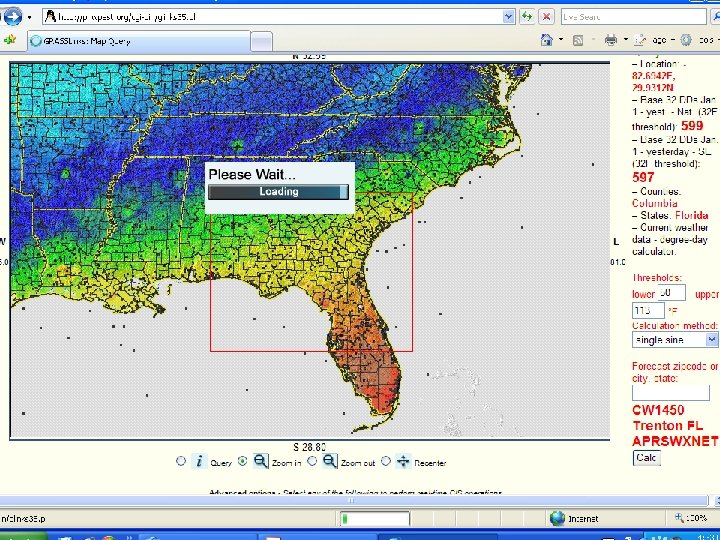
 Thumbnail hyperlinks to daily maps")

Degree-day models: accumulate a daily \"heat unit index\" (DD total)")


- Slides: 23
Epidemiology Regional to Local Focus Paul Jepson
• The concept in my mind is as follows: >> > > 1) explain what we are doing for NPDN in an IPM context (1 -2 slides) > > 2) explain how IPM needs and uses have driven development of our system > > (1 -2 > > slides) > > 3) explain how the system is used in a fully integrated pest management > > setting > > (monitoring, diagnosis, decision support, outeach summaries) > > 4) Outline other collaborators and the composition of the WWG > > 5) outline PRISM, downscaling, quality control and weather data > > validation, > > model adoption and validation, use statistics in a well worked example (a > > well > > chosen example showing the screens accessed by users and the process they > > employ, as briefly as possible): including a slide showing the application > > in > > two parts of the country, one PNW, one relevant to SBR, ideally Florida) > > 6) summarize current activities and goals > > 7) capture the essence of what we offer, the inclusiveness of our approach > > and > > the need to incorporate IPM thinking
IPM and Weather Data Long history of successful IPM programs which base IPM decisions on weather data, models and field observations – – Insect phenology and movement Disease development and spread Weed phenology Cultural practices • • Planting harvesting Irrigation others
IPM is Local • IPM practitioners need a high level of precision at the local level • Economy of scale leads management of infrastructure towards state or regional level • Pests and Pathogens know no borders
IPPC’s Web-based System • Multi-state, Multi-scale • Serve local, state and national needs for IPM and biosecurity for weather-based risk • Open and Collaborative Approach • The system is a fully integrated pest management setting for monitoring, diagnosis, decision support, outreach
Online IPM weather, Degree-Day and Disease Models from OSU/IPPC Len Coop, Assistant Professor (Senior Research) Integrated Plant Protection Center, Botany & Plant Pathology Dept. Oregon State University
Weather and Degree-day Concepts 1)Degree-day models: accumulate a daily "heat unit index" (DD total) until some event is expected (e. g. egg hatch) Eggs start developing: 0 DDs cumulative: daily: 20 20 38 18 70 32 84 14 70 o(avg)50 o(threshold)=20 DD 106 22 126 20 152 26 Eggs hatch: 152 cumulative DDs
Disease risk models: Pear scab (Venturia pirina)
NPDN / IPM Partnership to meet overlapping needs • IPM needs decision support system for daily decisions on pest management at the local scale. • NPDN needs to know what is normal, what is not, at a national down to a local scale. • NPDN has highly sensitive and confidential data. • Industry has proprietary information. • All groups need information on what to expect during an epidemic.
NPDN / IPM Partnership to meet overlapping needs
IPPC / NPDN • Web based delivery tools integrate open information (distributed by IPPC) with secured information (housed at CERIS) • Maps and reports display pest/ disease incidence and estimate or predict crop risk. • Economy of Scale for Infrastructure optomized NPDN and IPM resources. • These decision support tools can be interfaced with other systems to create a distributed set of databases for decision support • Novel technologies for example PRISM interpolation.
Western IPM Weather Workgroup Western IPM Center has funded a workgroup to tackle these challenges in the western US • Huge diversity in crops – Many disciplines represented – Large dependence on proximity to the Pacific Ocean and elevation – Large number of operational IPM weather networks with long history of success stories
Workgroup Membership • • • • Joyce Strand, UC State-wide IPM Doug Gubler, Small Fruit Pathology Extension Specialist Dennis Johnson, WSU Potato Pathologist Fran Pierce, WSU Center for Precision Agricultural Systems & Gary Grove, WSU Fruit Pathologist, PAWS Weather Network Walt Mahaffee, OSU and USDA-ARS, Fruit Pathologist, PNW David Brent, OSU and USDA-ARS Hops Pathologist Bill Phender, OSU and USDA-ARS, Grass Seed Pathologist Paul Jepson, OSU IPPC, Entomologist Len Coop, OSU IPPC, Entomologist Chris Daly, OSU Spatial Climate Analysis Services George Taylor, Oregon State Climatologist Alan Fox, Fox Weather, LLC, Private Weather Forecaster Carla Thomas, National Plant Diagnostic Network, Western Region
IPPC GIS Visualization Detecting geographic, climatological, temporal, distribution and association anomalies – – – high resolution weather and pest/ disease risk maps daily crop and pest phenology maps a degree-day mapping calculator for insect pests a generic disease modeling system Leverages funding • • WIPM Center NRI Biosecurity Grant OSU Integrated Plant Protection Center OSU Spatial Climate Analysis Center – IPM products in public domain
Oregon Annual Demonstration of Climatological Fingerprint Precipitation Climatology used in place of DEM as PRISM predictor grid
Evolution of Map Interpolation for Weather Related Information
Weather data and maps index page (http: //pnwpest. org/US) Thumbnail hyperlinks to daily maps
DD 32 for 2007 DD 32 for 30 year average Difference showing the Eastern US is much Warmer this year.
Weather and Degree-day Concepts 1)Degree-day models: accumulate a daily "heat unit index" (DD total) until some event is expected (e. g. egg hatch) Eggs start developing: 0 DDs cumulative: daily: 20 20 38 18 70 32 152 126 26 106 20 84 22 14 70 o(avg)50 o(threshold)=20 DD Eggs hatch: 152 cumulative DDs
Weather Data Infrastructure • Labor and Equipment intensive • Software/ Hardware Compatibility • Quality Assurance / Control • Interpolation Strategy • Model Output and Interpretation • Delivery platform
PRISM Parameter-elevation Regressions on Independent Slopes Model Developed by Christopher Daly, Ph. D. , Director, Spatial Climate Analysis Service, Oregon State University • a local, moving-window, regression function between a climate variable and elevation that interacts with an encoded knowledge base and inference engine • engine is a series of rules, decisions and calculations that set weights for the station data points entering the regression function. • Rules account for the elevational influence on climate, terrain-induced climate transitions (e. g. , rain shadows), coastal effects, atmospheric layers, inversions, and the orographic effectiveness of terrain • http: //www. ocs. orst. edu/prism/