Epidemiology of HIV in the Indianapolis Transitional Grant


")


![HIV/AIDS Incidence New Diagnoses No. U. S. Rate** Rate [95% CI*] 2018 Rate [95%](https://slidetodoc.com/presentation_image_h/bc43610f6c963675a6926d44fbfe3ad4/image-12.jpg "HIV/AIDS Incidence New Diagnoses No. U. S. Rate** Rate [95% CI*] 2018 Rate [95%")


 <15 15 -19 20 -24 25 -34 35")


![HIV Mortality and All Deaths of PLWH/A Area Mortality No. Rate [95% CI*] 2018](https://slidetodoc.com/presentation_image_h/bc43610f6c963675a6926d44fbfe3ad4/image-25.jpg "HIV Mortality and All Deaths of PLWH/A Area Mortality No. Rate [95% CI*] 2018")
 Deaths of Indianapolis TGA Residents Living with HIV/AIDS, Regardless")
 Residents with HIV as the Underlying Cause")


 <15 15 -19 20 -24 25 -34")
![HIV/AIDS Prevalence by Exposure/Risk % of HIV Rate [95% CI*] per Exposure No. in](https://slidetodoc.com/presentation_image_h/bc43610f6c963675a6926d44fbfe3ad4/image-38.jpg "HIV/AIDS Prevalence by Exposure/Risk % of HIV Rate [95% CI*] per Exposure No. in")


 • For 2017, 48 TGA residents were diagnosed with active TB,")


 diagnoses were reported")


 “Getting and keeping an undetectable viral load* is the best")


. Marion")
. HOPWA performance profile")
. HIV and tuberculosis. Retrieved from")

- Slides: 78
Epidemiology of HIV in the Indianapolis Transitional Grant Area: 2019 May 07, 2020 Sam Parmar, MPH SParmar@Marion. Health. org
Objectives • To identify trends in HIV incidence, prevalence, mortality, and health outcomes within the TGA • To provide the Ryan White Planning Council with information necessary for priority setting and allocation • To provide Planning Council subcommittees with relevant information
Epidemiology
Epidemiology – The study of:
Epidemiology - Terminology • Incidence • New diagnoses– Annual rate of new diagnoses per 100, 000 of those at risk • Prevalence • Existing diagnoses – The number of previously diagnosed and newly diagnosed people per 100, 000 (e. g. , number of TGA residents living with HIV on 12/31/2019 who were still living in the TGA on 12/31/2019) • Mortality • Deaths due to a specific cause – Annual rate of deaths per 100, 000 • Rate Ratio • Comparison of rates between two or more groups
The Indianapolis Transitional Grant Area (TGA)
TGA Location & Population • Ten Central Indiana counties with a 2019 estimated population of 1. 94 million 1 (10% increase since 2010)2, 3
TGA Population Center 84% of the TGA’s population in orange 4 49% reside inside Indianapolis city limits 1
TGA Demographics
TGA Demographics The population of Marion County is more diverse than that of the TGA overall, with 28% African American, 11% Hispanic, and nearly 4% each of Asian/PI and 3% Other
HIV/AIDS Incidence
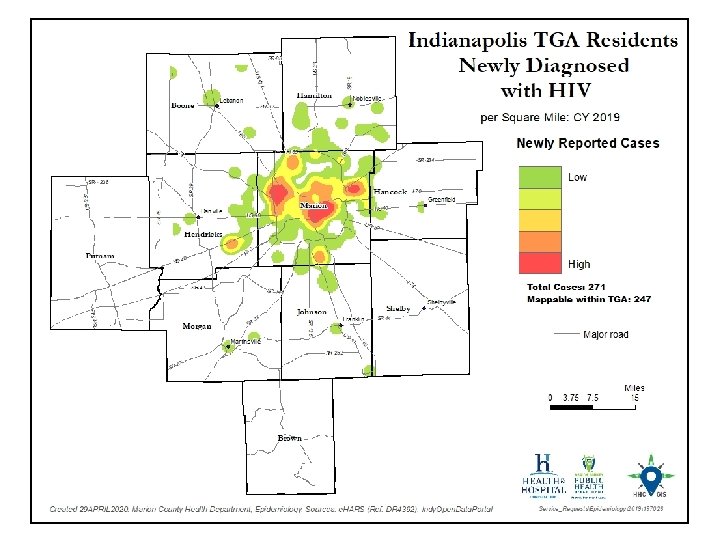
HIV/AIDS Incidence New Diagnoses No. U. S. Rate** Rate [95% CI*] 2018 Rate [95% CI*] (2018)5 HIV† 271 14 [12. 4 -15. 8] 12. 7 [11. 1 -14. 4] 11. 4 AIDS 83 4. 3 [3. 4 -5. 3] 6. 2 [5. 1 -7. 4] 5. 2 *95% confidence interval **Includes the TGA † New HIV dx and HIV at AIDS dx No significant change in AIDS incidence from 2018 to 2019 HIV/AIDS incidence in the TGA are on par with national rates
HIV/AIDS Incidence HIV Diagnoses and Population Estimates in the Indianapolis TGA: 2010 -2019 HIV Diagnoses (N) 300 250 200 150 100 50 0 2011 2012 2013 2014 2015 2016 2017 2018 2019 New HIV (N) TGA Pop. Est. (x 10, 000) 3 -Yr. Moving Avg. (HIV)
HIV/AIDS Incidence HIV Diagnoses by Time to AIDS in the Indianapolis TGA: 2010 -2019* HIV Diagnoses (N) 300 250 200 150 181 224 58 43 100 50 0 2011 2012 2013 2014 2015 2016 2017 2018 2019 Late Diagnosis (AIDS < 91 Days) *Conversion within 91 -365 Days masked due to low case counts HIV non-AIDS for > 1 Year
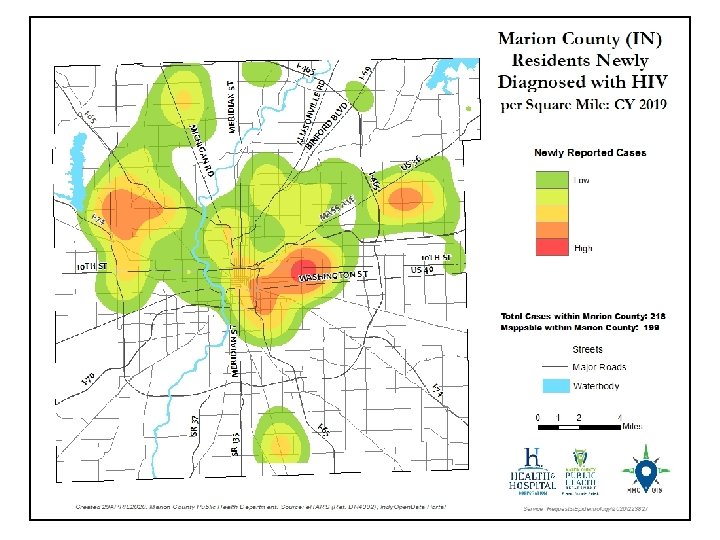
HIV Incidence by County % of HIV No. in TGA County Marion Rate [95% CI*] RR [95% CI*]: to Others 218 80. 4% 22. 7 [19. 8 -25. 9] 5. 4 [3. 8 -7. 8] Hendricks 19 7. 0% 11. 2 [6. 7 -17. 4] 2. 7 [1. 5 -4. 7] Others* 34 12. 6% 4. 2 [2. 9 -5. 9] 1. 0 * 95% confidence interval Marion County HIV incidence was at about 5 times that of TGA counties outside of Marion and Hendricks
HIV Incidence by Gender Female Male Transgender No. 54 211 6 % of HIV in TGA 19. 9% 77. 9% 2. 2% Rate [95% CI*] 5. 4 [4. 1 -7. 1] 22. 3 [19. 4 -25. 5] - RR [95% CI*]: to Female 1. 0 4. 1 [3. 0 -5. 5] - *95% confidence interval No significant change by gender between 2018 to 2019 Men were diagnosed with HIV at a rate of about 4 times that of women
HIV/AIDS Incidence HIV Diagnoses by Sex at Birth in the Indianapolis TGA: 2010 -2019 HIV Diagnoses (N) 300 250 200 185 150 216 100 50 58 55 0 2011 2012 2013 2014 2015 2016 2017 2018 2019 Female Male
HIV Incidence by Race/Ethnicity Race/ Ethnicity Asian/PI Black Hispanic Other White No. <5 146 44 7 71 *95% confidence interval % of HIV in TGA 53. 8% 16. 2% <3. 0% 26. 2% Rate [95% CI*] NS 47. 6 [40. 2 -56] 32. 2 [23. 4 -43. 2] NS 5. 1 [4 -6. 5] RR [95% CI*]: to White NS 9. 3 [7. 0 -12. 3] 6. 3 [4. 3 -9. 1] NS 1. 0 NS = Does not meet MCPHD standards for statistical significance No significant change by race/ethnicity 2018 to 2019 African Americans and residents of Hispanic ethnicity continue to experience increased risk of HIV infection
HIV Incidence by Age (Yrs. ) <15 15 -19 20 -24 25 -34 35 -44 45 -54 55 -64 65+ No. <5 11 44 105 68 27 12 <5 *95% confidence interval % of HIV in TGA 4. 0% 16. 2% 38. 8% 25. 1% 10. 0% 4. 4% - Rate [95% CI*] NS 8. 7 [4. 3 -15. 6] 35. 9 [26. 1 -48. 3] 37. 2 [30. 5 -45. 1] 26. 3 [20. 4 -33. 3] 10. 8 [7. 1 -15. 7] 5 [2. 6 -8. 8] NS NS = Does not meet MCPHD standards for statistical significance No significant change by age between 2018 and 2019 Young adults 20 -34 continue to be at most risk of HIV, with rates at least double those of other age groups
HIV Incidence by Exposure Category Exposure MSM^ IDU^ Heterosex. Perinatal Not Rptd. % of HIV No. Rate [95% CI*] in TGA 129 47. 6% 255. 6 [213. 4 -303. 6] 23 8. 5% 74 [46. 9 -111. 1] 67 24. 7% 3. 5 [2. 7 -4. 5] <5 52 19. 2% 2. 7 [2 -3. 5] RR [95% CI*]: to Heterosexual 72. 1 [53. 7 -96. 9] 20. 9 [13 -33. 6] 1. 0 NA ^MSM=Male-to-male sexual contact (denominator estimated)5, 6 and IDU=Injection drug use(denominator estimated)30 Rows may total more than actual incidence due to report of multiple categories *95% confidence interval The percentage of new HIV without reported risk has increased from 13. 6% (N=33) to 19. 2% (N=52) MSM continue to bear the greatest burden of HIV
HIV Incidence by U. S. Nativity Status % of HIV Nativity Status No. in TGA Rate [95% CI*] RR [95% CI*]: to Native Born Foreign Born** 35 Native Born 126 12. 9% 46. 5% 25. 2 [17. 5 -35] 7. 0 [5. 8 -8. 3] 3. 6 [2. 5 -5. 2] 1. 0 Unk/Miss 40. 6% - - 110 *95% confidence interval, ** TGA foreign born population denominator based on census tract data 1 Foreign-born residents of the TGA account for an estimated 7. 2% of the TGA population and experienced HIV incidence about 4 x that of native-born residents
HIV Mortality and Death
HIV Mortality and All Deaths of PLWH/A Area Mortality No. Rate [95% CI*] 2018 Rate [95% CI*] U. S. Rate**7 (Marion Only) 19 NS NS 1. 7(2017) Deaths (TGA) 55 2. 8 [2. 1 -3. 7] 2. 4 [1. 8 -3. 3] 4. 9(2017) *95% confidence interval; NS = Does not meet MCPHD standards for statistical significance No significant change in mortality or deaths from 2018 to 2019 The mortality rate of PLWH/A is roughly on par with the 2018.
Death of PLWH/A (Any Cause) Deaths of Indianapolis TGA Residents Living with HIV/AIDS, Regardless of Cause of Death, by Year: 2000 -2019 75 60 45 30 15 2019 2018 2017 2016 2015 2014 2013 2012 2011 2010 2009 2008 2007 2006 2005 2004 2003 2002 2001 0 2000 Deaths of PLWH/A (N) 90
HIV Mortality Deaths of Marion County (IN) Residents with HIV as the Underlying Cause of Death, by Year: 2000 -2019 45 30 15 2019 2018 2017 2016 2015 2014 2013 2012 2011 2010 2009 2008 2007 2006 2005 2004 2003 2002 2001 0 2000 HIV Deaths (N) 60
HIV Prevalence
ISDH Lost to Care Program • Funded by Ryan White Part B funds • Work in Health District 5 started in May 2019 • Comprised of lost to care specialists • Looked at individuals without a CD 4 or Viral Load test result in the calendar year (2019) and attempted to reengage people into care • Legacy data was updated utilizing address data and death data • The effect on the Indy TGA has been a noticeably decreased HIV prevalence compared to previous years due to improved data quality
Estimated Number of Undiagnosed PLWH/A HIV/AIDS Prevalence HIV Prevalence AIDS Prevalence Undiagnosed/Unaware Estimated Total PLWH/A 5, 745 3, 009 2, 736 859 6, 604 • Current estimated proportion of PLWH/A while undiagnosed/unaware is 13% of known prevalence 27
Prevalence of Diagnosed HIV/AIDS Status HIV AIDS Total No. 3, 009 2, 736 5, 745 Rate [95% CI*] 155 [149. 5 -160. 6] 140. 9 [135. 7 -146. 3] 295. 9 [288. 4 -303. 7] U. S. Rate (2017)5 147. 3 161. 4 308. 7 *95% confidence interval Significant reduction in HIV and AIDS prevalence 2018 to 2019 (see prior slide)
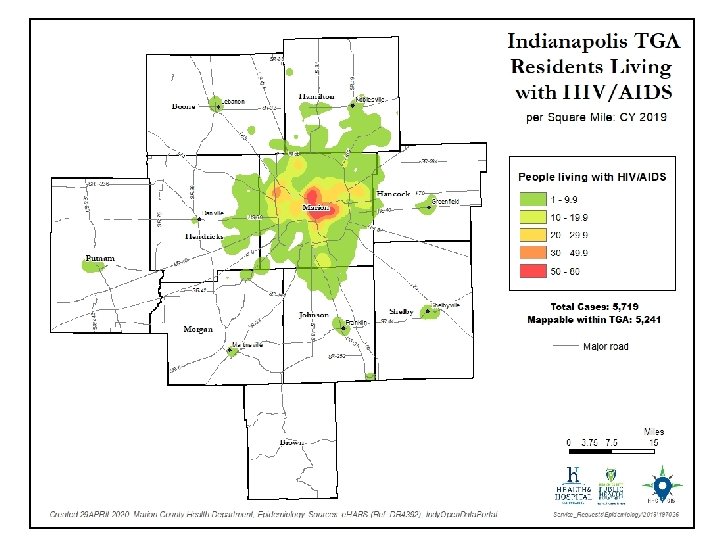
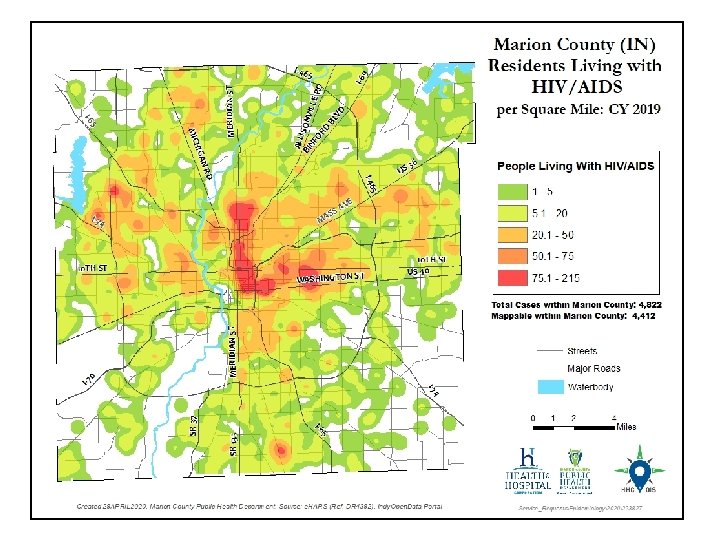
HIV/AIDS Prevalence by County No. Marion 4, 844 Hamilton 265 Hendricks 188 Johnson 166 Putnam 58 Hancock 67 Morgan 53 Boone 57 Shelby 29 Brown 11 *95% confidence interval % of HIV in TGA Rate [95% CI*] 84. 3% 504. 6 [490. 6 -518. 9] 4. 6% 78. 4 [69. 2 -88. 4] 3. 3% 110. 4 [95. 2 -127. 3] 2. 9% 104. 7 [89. 4 -121. 9] 1. 0% 153. 2 [116. 4 -198] 1. 2% 86. 2 [66. 8 -109. 4] 0. 9% 75. 4 [56. 5 -98. 6] 1. 0% 83. 4 [63. 2 -108. 1] 0. 5% 64. 8 [43. 4 -93] 0. 2% 71. 8 [35. 8 -128. 3] RR [95% CI*]: to Shelby 7. 0 [3. 9 -12. 7] NS NS NS 2. 1 [1. 1 -4. 1] NS NS 1. 0
HIV/AIDS Prevalence by Gender Female Mt. F Ft. M No. 1, 216 4, 442 72 15 % of HIV in TGA 21. 2% 77. 3% 1. 2% 0. 3% Rate [95% CI*] 122. 4 [115. 7 -129. 5] 468. 5 [454. 9 -482. 4] UNK RR [95% CI*]: to Female 1. 0 3. 8 [3. 6 -4. 0] UNK *95% confidence interval HIV prevalence among the TGA’s men was about 4 times that found among women
HIV/AIDS Prevalence by Race/Ethnicity Race/ Ethnicity Black Other Hispanic Asian/PI White % of HIV No. in TGA Rate [95% CI*] 2, 655 46. 2% 866. 1 [833. 7 -899. 4] 181 3. 2% Approx. 403 529 9. 2% 386. 6 [354. 4 -420. 9] 157 2. 7% 223. 3 [189. 8 -261] 2, 223 38. 7% 160. 8 [154. 2 -167. 6] RR [95% CI*]: to White 5. 3 [5. 1 -5. 7] Approx. 2. 5 2. 4 [2. 2 -2. 6] 1. 4 [1. 2 -1. 6] 1. 0 *95% confidence interval HIV prevalence continues to be higher among racial/ethnic minorities than among Caucasians in the TGA
HIV/AIDS Prevalence by Current Age (Yrs. ) <15 15 -19 20 -24 25 -34 35 -44 45 -54 55 -64 65+ No. 33 36 178 1, 170 1, 219 1, 449 1, 253 400 % of HIV in TGA 0. 6% 3. 1% 20. 4% 21. 2% 25. 2% 21. 8% 7. 0% *95% confidence interval Adults over 45 Yrs. of age account for more than 55% of the TGA’s PLWH/A Rate [95% CI*] 8. 2 [5. 7 -11. 5] 28. 5 [19. 9 -39. 4] 145. 4 [124. 9 -168. 4] 414. 9 [391. 5 -439. 2] 470. 7 [444. 7 -497. 7] 580. 9 [551. 5 -611. 4] 523. 1 [494. 7 -552. 8] 153. 3 [138. 7 -169. 1]
HIV/AIDS Prevalence by Exposure/Risk % of HIV Rate [95% CI*] per Exposure No. in TGA 100, 000 or per 100(%) MSM^ 3, 137 54. 6% 6. 21% [6. 0%-6. 4%] Heterosex. 1, 332 23. 2% 0. 07%[0. 067%-0. 074%] IDU^ 540 9. 4% 1. 74% [1. 59%-1. 89%] Perinatal 76 1. 2% 0. 28%[0. 23%-0. 36%] Other 11 0. 2% NS Not Rptd. 649 11. 3% 0. 033%[0. 031%-0. 036%] RR [95% CI*]: to Heterosexual 88. 2[82. 7 -94. 1] 1. 0 24. 7 [22. 3 -27. 3] 4. 1 [3. 2 -5. 2] NS 0. 47 [0. 43 -0. 52] ^MSM=Male-to-male sexual contact (denominator estimated)5 6 and IDU=Injection drug use (denominator estimated)30 Rows may total more than actual incidence due to report of multiple categories *95% confidence interval Based on CDC estimates, as many as 34% of HIV-positive MSM are unaware of their status. 8
HIV/AIDS Prevalence by U. S. Nativity Status Nativity % of HIV Status No. in TGA Foreign Born 814 14. 2% Native Born 4, 441 77. 3% Unk/Miss 490 8. 5% RR [95% CI*]: to Rate [95% CI*] Native Born 585. 3 [545. 8 -626. 7] 2. 4 [2. 2 -2. 6] 246. 8 [239. 7 -254. 2] 1. 0 - *95% confidence interval HIV prevalence among foreign-born TGA residents is about two times that of native-born residents
HIV/AIDS Prevalence by Birth Region Northern America Latin America and Caribbean Africa Asia Europe Unknown No. 4, 441 320 298 146 17 490 % of HIV in TGA 77. 3% 5. 6% 5. 2% 2. 5% 0. 3% 8. 5% United States, Latin America and Africa are the top 3 Birth Regions for PLWHA in our TGA
Co-morbidities
Foreign-Born • With a risk of about 4 times that of native-born residents, foreign-born residents of the TGA accounted for over 1 in 10 newly diagnosed with HIV during 2019 • Similarly, over 1 in 10 PLWH/A in the TGA are foreignborn, experiencing a prevalence that is over two times as high as among the native-born • Special considerations • Linguistic services • Health insurance • Social support structure • Cultural stigma/beliefs • Fear
Aging Better therapies Longer lives • Over 55% of PLWH/A in the TGA are 45+ years of age • Special considerations 9 • Weakened immune system • Increased risk of adverse events and drug interactions • Stigma and depression due to illness, or loss of family and friends • Increased risk for cardiovascular disease, bone loss, and certain cancers
Homelessness • Among PLWH/A, between 300 and 400 were homeless or insecurely housed at some point during 201810, 11, 12 • Research suggests that 10%-16% of all PLWH/A in some communities are homeless at any given time 13 • Special considerations • Case finding • Public assistance • Permanent housing • Priority of medical care Photo credit: Jeremy Swain, Ending Homelessness in London
Recent Incarceration • 10% of the TGA’s PLWH/A have a history of incarceration • Special considerations • Employment and housing • Retention in care throughout and after the transition • Substance abuse • Trouble navigating the health care system
Mental Health & Substance Abuse • Approximately 2, 873 PLWH/A suffer from mental health issues according to the 50% estimate found in the National HIV/AIDS Strategy 14 • 40% of PLWH/A are estimated to have substance abuse issues and 13% are thought to experience both substance abuse and mental health issues 14 • Special considerations 14 • Sadness or Depression • Stress, Fear, and Anxiety • HIV-associated neurocognitive disorders (HAND) • To complicate matters… • Marion County, home to 86% of the TGA’s PLWH/A, is an underserved area for mental health services (population-to-provider ratio is only about two-thirds the average mental health staffing capacity in the state)15
Food Insecurity • Nearly 50% of PLWH/A are thought to struggle with food insecurity • Food insecurity is a risk factor for mortality among people on HAART, especially those who are underweight 16 • Food insecurity associated with prevalent HIV, STI, and illicit drug use among men in the US 16
Mycobacterium tuberculosis (TB) • For 2017, 48 TGA residents were diagnosed with active TB, three were HIV-positive. For 2018, 43 TGA residents were diagnosed with active TB, three were HIV-positive. For 2019, 49 TGA residents were diagnosed with active TB, five were HIVpositive. • 6%-10% of active TB diagnoses are among PLWH/A 17 • Conversion from latent to active TB is 10 times more likely in PLWH/A (7%-10% risk each year)18 • Everyone newly HIV diagnosed should be tested for TB right away, and PLWH/A and at risk for TB should be tested annually. 19 • Special considerations • Screening • Diagnostic • HIV-TB synergy • Treatment complications
Viral Hepatitis • Approximately 575 PLWH/A are thought to be co-infected with hepatitis B based on the 10% estimate of the U. S. Department of Health and Human Services 20 • Approximately 1, 437 PLWH/A are thought to be coinfected with hepatitis C based on the 25% estimate of the National Alliance of State and Territorial AIDS Directors 21 • Special considerations • HIV co-infection triples the risk for HCV-related liver disease which is the leading cause of non-AIDS related death among PLWH/A 22 • Current guidelines call for HCV screening in all PLWH/A (annually for those at increased risk)23
Chlamydia • 12, 254 chlamydia diagnoses were reported in the TGA during 2018, at least 326 among PLWH/A 24 • The chlamydia rate among PLWH/A was 5, 301 per 100, 000 [95% CI: 4, 754. 8 -5, 891. 4], a rate 7 -9 times higher than that of HIVnegative residents. • Chlamydia co-infection among PLWH/A is thought to be grossly underestimated – PLEASE screen, diagnose and treat PLWH/A and their partner(s) for chlamydia
Gonorrhea • 4, 367 gonorrhea diagnoses were reported in the TGA during 2018, at least 236 among PLWH/A 24 • The gonorrhea rate among PLWH/A was 3, 838 per 100, 000 [95% CI: 3, 371. 7 -4, 348. 7], a rate 14 -19 times higher than that of HIVnegative residents • Gonorrhea co-infection among PLWH/A is thought to be grossly underestimated – PLEASE screen, diagnose and treat PLWH/A and their partner(s) for gonorrhea.
Early Syphilis • 363 early syphilis (primary, secondary, and early latent) diagnoses were reported in the TGA during 2018, at least 110 among PLWH/A 24 • The rate of early syphilis among PLWH/A was 1, 789 per 100, 000 [95% CI: 1, 472 -2, 152], a rate at about 76 times higher [95% CI: 76. 2 -116. 7] than that of HIV-negative residents. • HIV co-infection among new syphilis cases is very common– PLEASE screen, diagnose and treat PLWH/A and their partner(s) for syphilis.
More on Sexually-Transmitted Infections • HIV and STIs are commonly co-morbid conditions • Special concerns • STDs can increase the likelihood of contracting HIV • As providers to residents with the highest risk, you can: • Include routine screening as a function of HIV primary care • Perform risk analyses – Assess risk behaviors of your patients • Perform risk reduction - Alert your patients to the risks of STDs, especially when comorbid to HIV/AIDS, and offer periodic STD testing for each of your patients • Treat - Diagnose and treat patients and their partner(s) • Report – Provide thorough and accurate case reporting for better modeling of risk factors
Measures of HIV Health Outcomes
HIV Treatment Cascade (AKA: Continuum of Care • Developed by Dr. Edward Gardner and colleagues 25 in March 2011 • Model for use in identifying unmet needs, as well as discovery of where, across the continuum of care, clients are lost to follow-up “Improving control of HIV begins with enhanced detection and linkage to care” – Gardner, et al. , 2011 25 “HIV screening without linkage to care “confers little or no benefit to the patient” – Branson, et al. , 2006 26
Benefits of Improving Linkage Into and Retention in Care • Delayed linkage and poor engagement in care associated with: 25 26 • Delayed/no receipt of anti-retroviral therapy (ART) • Quicker progression to AIDS • Drug resistance • Increased morbidity (hospitalizations, opportunistic infections, emergency department visits, etc. ) • Increased mortality • Increased risk of HIV transmission
National HIV/AIDS Progress Indicators • 90% of HIV-positive residents aware of their status • 85% of those newly diagnosed linked to care within 30 days • 90% retained in care • 80% suppressed viral load
HIV Care Continuum Definitions • Linked to Care: People newly diagnosed with HIV during CY 2019 who received a CD 4/viral load test within 90 days unless otherwise specified • Retained in Care: Residents living with HIV/AIDS with 2+ CD 4/viral load tests performed at least 3 months apart in CY 2019 • Antiretroviral Therapy: Residents living with HIV/AIDS who received a prescription for antiretroviral therapy in CY 2019 • Viral Load Suppression: Residents living with HIV/AIDS with a CY 2019 viral load result <200 RNA copies/m. L
HIV Care Continuum of the TGA Linked to Care * Retained in Care ART Rx Virally Suppressed 64. 6% (N=175/271) 43. 2% (N=2484/5745) 57. 6% - 77. 8% 57. 6% (N=3310/5745) Virally Suppressed Retained in Care ART Rx Linked to Care * *Linkage to care within 90 days shown above Note: There was 48% linkage to care within 30 days
Ryan White Clients v. Non-Client PLWH/A 70. 1% 62. 7% Linked to Care * Retained in Care ART Rx Virally Suppressed 45. 4% 38. 8% Min. 57. 6% (Max. 77. 8%) 58. 3% 56. 0% RWSP Clients Non-Clients *Linkage to care within 90 days shown above. Current HRSA measure is 30 days until linkage to care. When using that benchmark, only 50% of RWSP clients and 48% of non-RWSP clients were linked to care.
Community Viral Load • Geometric means were used for comparisons of viral load • Geometric means are always smaller than arithmetic means because the effect of very large values is diminished • Geometric means are more stable from year to year • All results are based on the last reported viral load test during 2019 for all residents with ≥ 1 viral load test • Results were standardized such that: • Results reported as 0 or <20 were set to half the lower limit of detection possible for the assay used according to CDC recommendations 28
Community Viral Load by Gender • Number and percent with suppressed viral load (<200 copies/m. L) at last CY 2019 test, by gender Gender Male Female Mt. F Transgender Ft. M Transgender % at <200 Geometric Mean 95% Confidence N copies/m. L** Viral Load Interval (GM) 2977 58. 8 50 46 -54 738 53. 3 48 41 -56 44 50 * 36 -229 8 53. 3 * 12 -45 *Point estimate suppressed due to wide confidence interval **Percentage includes unknown/missing viral loads in denominator
Community Viral Load by Race/Ethnicity • Number and percent with suppressed viral load (<200 copies/m. L) at last CY 2019 test, by race/ethnicity Race/Ethnicity White Black Hispanic Asian/PI Other N 1, 689 1, 583 256 111 128 % at <200 Geometric 95% Confidence copies/m. L** Mean Viral Load Interval (GM) 69. 9 37 34 -40 50. 0 64 56 -72 39. 7 * 55 -107 65. 6 35 25 -47 58. 4 * 43 -100 *Point estimate suppressed due to wide confidence interval **Percentage includes unknown/missing viral loads in denominator
Community Viral Load by Age • Number and percent with suppressed viral load (<200 copies/m. L) at last CY 2019 test, by current age (Yrs. ) Current Age (Yrs. ) <15 15 -19 20 -24 25 -34 35 -44 45 -54 55 -64 65+ Unk/Miss N 29 25 99 699 756 961 878 283 37 % at <200 Geometric Mean 95% Confidence copies/m. L** Viral Load Interval (GM) 82 * 22. 4 -159 50 * 42 -939 40. 4 * 67 -213 46. 6 * 87 -135 54. 1 57 48 -67 60. 4 40 36 -45 66. 9 31 28 -34 68 29 24 -34 46. 8 * 35 -227 *Point estimate suppressed due to wide confidence interval **Percentage includes unknown/missing viral loads in denominator
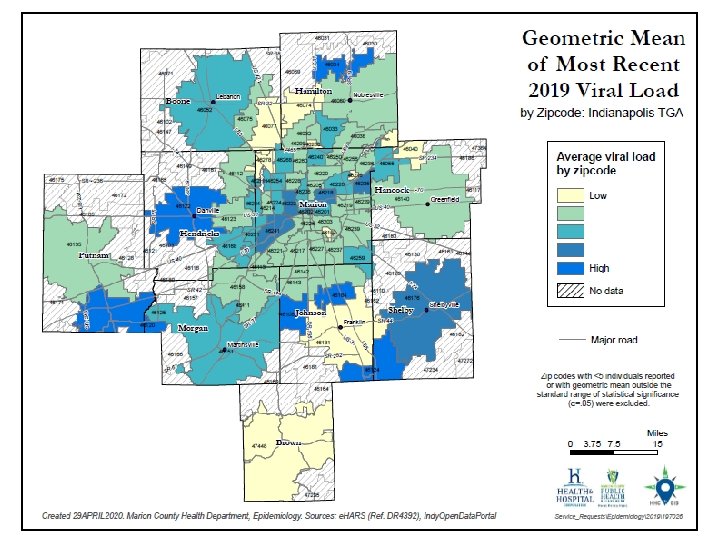
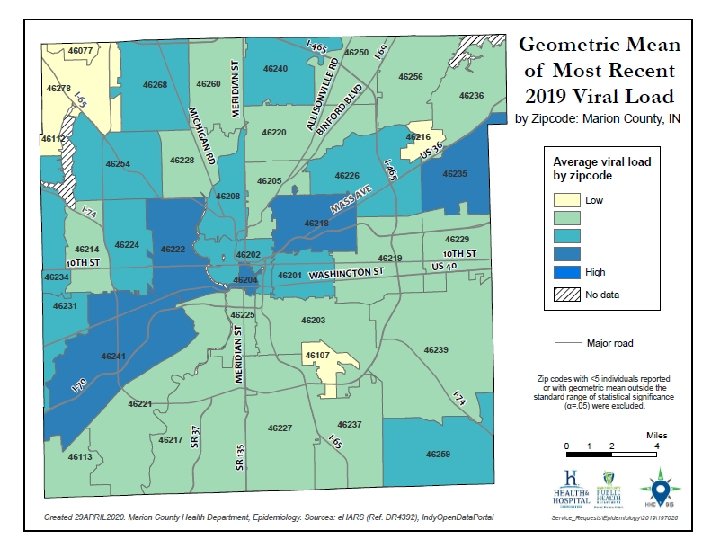
Community Viral Load by County • Number and percent with suppressed viral load (<200 copies/m. L) at last CY 2019 test, by county of residence County of Residence Boone Brown Hamilton Hancock Hendricks Johnson Marion Morgan Putnam Shelby N 40 9 204 59 139 120 3061 35 39 24 % at <200 copies/m. L** 65. 9 81. 8 72. 4 79. 1 64. 3 65. 7 55. 7 62. 3 60. 3 65. 5 Geometric Mean Viral 95% Confidence Load Interval (GM) 24 -67 * 23 19 -28 * 28 -46 * 24 -72 * 39 -91 * 31 -61 51 47 -55 * 19 -77 * 27 -121 * 28 -356 *Point estimate suppressed due to wide confidence interval **Percentage includes unknown/missing viral loads in denominator
Community Viral Load by RWSP Status • Number and percent with suppressed viral load (<200 copies/m. L) at last CY 2019 test, by Ryan White HIV Services Program enrollment status RWSP Enrollment Status: CY 2019 Not Enrolled Part of the Year % at <200 Geometric 95% Confidence N copies/m. L** Mean Viral Load Interval (GM) 1283 56. 0 54 48 -62 1911 56. 6 50 45 -55 Enrolled All Year^ 573 64. 5 41 * Point estimate suppressed due to wide confidence interval **Percentage includes unknown/missing viral loads in denominator ^ Experienced <30 day enrollment lapse during the year of interest 35 -48
Improving Retention in Care • Guidelines for Improving Entry Into and Retention in Care and Antiretroviral Adherence for Persons With HIV: Evidence-Based Recommendations From an International Association of Physicians in AIDS Care Panel 29 • CLOSE MONITORING AND INDIVIDUALIZED CARE • Systematic monitoring of retention in care for all PLWH/A • Intensive outreach for PLWH/A who are not engaged in care within six months • Use of peer or paraprofessional patient navigators Summary of recommendations included. See appendix. Full published article at: http: //annals. org/article. aspx? articleid=1170890
Vision for the National HIV/AIDS Strategy “The United States will become a place where new HIV infections are rare and when they do occur, every person, regardless of age, gender, race/ethnicity, sexual orientation, gender identity or socio-economic circumstance, will have unfettered access to high quality, life-extending care, free from stigma and discrimination. ” 14
Undetectable = Untransmittable (U=U) “Getting and keeping an undetectable viral load* is the best thing people with HIV can do to stay healthy” 32 -33 CDC: Risk of HIV Transmission With Undetectable Viral Load by Transmission Category 32 Transmission Category Risk for People Who Keep an Undetectable Viral Load Sex (oral, anal, or vaginal) Effectively no risk Pregnancy, labor, and delivery 1% or less† Sharing syringes or other drug injection equipment Unknown, but likely reduced risk Breastfeeding Substantially reduces, but does not eliminate risk. Current recommendation in the United States is that mothers with HIV should not breastfeed their infants.
Sam Parmar, MPH Epidemiologist Health & Hospital Corporation Marion County Public Health Department 3901 Meadows Drive, H 116 Indianapolis, IN 46205 Office: 317 -221 -3556 Fax: 317 -221 -4404 SParmar@Marion. Health. org
References 1 U. S. Census Bureau and Marion County Public Health Department. (2017). Marion County Public Health Department estimates based on ARIMA projections calculated using U. S. Census Bureau data. 2 U. S. Census Bureau. (2002). Time series of Indiana intercensal population estimates by county: April 1, 1990 to April 1, 2000. Table CO-EST 2001 -12 -18. Release date April 17, 2002. 3 U. S. Census Bureau. (2011). Intercensal estimates of the resident population for counties of Indiana: April 1, 2000 to July 1, 2010. Table CO-EST 00 INT-01 -18. 4 Glenn, R. (2011). Demographics & trends: Indianapolis, Marion County & the Indianapolis region. Department of Metropolitan Development: City of Indianapolis. 5 Centers for Disease Control and Prevention. (2019). HIV surveillance report, 2018 Vol. 30. Retrieved from https: //www. cdc. gov/hiv/pdf/library/reports/surveillance/cdc-hiv-surveillance-report-2018 -vol-30. pdf 6 Purcell et al. (2012). Estimating the population size of MSM in the U. S. to obtain HIV and syphilis rates. Open AIDS Journal; 6(S 1: M 6) 98 -107. 7 Centers for Disease Control and Prevention. (2018). Deaths: Final data for 2017. National Vital Statistics Report, 66(6). Retrieved from https: //www. cdc. gov/nchs/data/nvsr 68/nvsr 68_09 -508. pdf and https: //www. cdc. gov/hiv/pdf/library/reports/surveillance/cdc-hiv-surveillance-report-2018 -vol-30. pdf 8 Centers for Disease Control and Prevention. (2016). HIV Testing in the United States: Fact sheet. Retrieved from https: //www. cdc. gov/nchhstp/newsroom/docs/factsheets/hiv-testing-us-508. pdf 9 Centers for Disease Control and Prevention. (2013). HIV Among People Aged 50 and Older. Retrieved from https: //www. cdc. gov/hiv/group/age/olderamericans/index. html 10 Indiana University Public Policy Institute. (2015). 2015 Point-in-time count: Many families in Indianapolis not able to find shelter. Retrieved from http: //www. chipindy. org/wp-content/uploads/2013/07/Homeless. Count_2015_ Web. pdf
References 11 U. S. Department of Housing and Urban Development. (2018). HOPWA performance profile - Formula grantee: City of Indianapolis. Retrieved from https: //files. hudexchange. info/reports/published/HOPWA_Perf_Grantee. Form_00_INDI-IN_IN_2018. pdf 12 Health & Hospital Corporation. (2017). Ryan White information services enterprise (RISE). Indianapolis: Ryan White HIV Services Program, Marion County Public Health Department. 13 Shubert, G. (2012). Mobilizing knowledge: Housing is HIV prevention and care. Available from https: //shnny. org/uploads/Housing_is_HIV_Prevention_and_Health_Care. pdf 14 The White House Office of National AIDS Policy. (2010). National HIV/AIDS strategy for the United States. Retrieved from http: //www. cdc. gov/hiv/strategy/pdf/nhas. pdf and https: //www. hiv. va. gov/patient/daily/mental/singlepage. asp 15 Marion County Public Health Department. (2014). Community health assessment of Marion County: 2014. Retrieved from http: //www. hhcorp. org/hhc/index. php/newsroom/2014 -press-releases/645 -marion-county-releases 2014 -community-health-assessment 16 Weiser, S. D. , Fernandes, K. A. , Brandson, E. K. , Lima, V. D. , Anema, A. , Bangsberg, D. R. , . . . Hogg, R. S. (2009). The association between food insecurity and mortality among HIV-infected individuals on HAART. J Acquir Immune Defic Syndr, 52(3): 342 -349. doi: 10. 1097/QAI. 0 b 013 e 3181 b 627 c 2. Retrieved from http: //www. ncbi. nlm. nih. gov/pmc/articles/PMC 3740738/ and Palar, K. , Laraia, B. , Tsai, A. C. , Johnson, M. , & Weiser, S. D. (2016). Food insecurity is associated with HIV, sexually transmitted infections and drug use among men in the United States. AIDS (London, England), 30(9), 1457– 1465. http: //doi. org/10. 1097/QAD. 0000001095 17 Centers for Disease Control and Prevention. (2013). Staying healthy with HIV/AIDS: Potential related health problems: Tuberculosis. Retrieved from https: //www. aids. gov/hiv-aids-basics/staying-healthy-with-hivaids/potential-related-health-problems/tuberculosis/ 18 Centers for Disease Control and Prevention. (2013). Latent tuberculosis infection: A guide for primary health care providers. Retrieved from https: //www. cdc. gov/tb/publications/ltbi/pdf/targetedltbi. pdf
References 19 Centers for Disease Control and Prevention. (2016). HIV and tuberculosis. Retrieved from http: //www. cdc. gov/hiv/pdf/library/factsheets/hiv-tb. pdf 20 U. S. Department of Health and Human Services. (2014). Staying healthy with HIV/AIDS: Potential related health problems: Hepatitis. Retrieved from http: //www. aids. gov/hiv-aids-basics/staying-healthy-with-hiv-aids/potential-related-health -problems/hepatitis/ 21 National Alliance of State and Territorial AIDS Directors. (2011). HIV and viral hepatitis co-infection. Retrieved from http: //www. nastad. org/Docs/031236_HIV%20 VH%20 Co. Infection%20 Final. pdf 22 Centers for Disease Control and Prevention. (2014). HIV and viral hepatitis. Retrieved from http: //www. cdc. gov/hiv/pdf/library_factsheets_hiv_and_viral_hepatitis. pdf 23 U. S. Department of Health & Human Services. (2015). Guidelines for the use of antiretroviral agents in HIV-1 -infected adults and adolescents: Considerations for antiretroviral use in patients with coinfections. Retrieved from https: //aidsinfo. nih. gov/guidelines/html/1/adult-and-adolescent-arv-guidelines/26/hiv-hcv 24 Indiana State Department of Health. (2015). Statewide investigation, monitoring and surveillance system (SWIMSS). 25 Gardner, E. M. , Mc. Lees, M. P. , Steiner, J. F. , del Rio, C. , and Burman, W. J. (2011). The spectrum of engagement in HIV care and its relevance to test-and-treat strategies for prevention of HIV infection. Clin Infect Dis. 2011; 52(6): 793 -800. doi: 10. 1093/cid/ciq 243 26 Branson, B. M. , Handsfield, H. H. , Lampe, M. A. , Janssen, R. S. , Taylor, A. W. , Lyss, S. B. , and Clark, J. E. (2006). Revised recommendations for HIV testing of adults, adolescents, and pregnant women in health-care settings. Centers for Disease Control and Prevention: Atlanta. MMWR. 2006; 55(RR 14): 1 -17. Retrieved from http: //www. cdc. gov/mmwr/preview/mmwrhtml/rr 5514 a 1. htm Centers for Disease Control and Prevention. (2016). Monitoring selected national HIV prevention and care objectives by using HIV surveillance data - United States and 6 dependent areas - 2014. HIV Surveillance Supplemental Report, 21(4). Retrieved from https: //www. cdc. gov/hiv/pdf/library/reports/surveillance/cdc-hivsurveillance-supplemental-report-vol-21 -4. pdf 27 28 Centers for Disease Control and Prevention. (2011). Guidance on community viral load: A family of measures, definitions, and method for calculation. Retrieved from https: //stacks. cdc. gov/view/cdc/28147
References 29 Thompson, M. A. , Mugavero, M. J. , Amico, K. R. , Cargill, V. A. , Chang, L. W. , Gross, R. , . . . Nachega, J. B. (2012). Guidelines for improving entry into and retention in care and antiretroviral adherence for persons with HIV: Evidence-based recommendations from an international association of physicians in AIDS care panel. Ann Intern Med. 2012; 156(11): 817 -833. doi: 10. 7326/0003 -4819 -156 -11 -201206050 -00419 30 Kooreman& Greene. (2016). Injection drug us in Indiana: A major risk factor for HIV transmission. https: //www. healthpolicy. iupui. edu/Pubs. PDFs/Injection%20 Drug%20 Use%20 in%20 Indiana. pdf 31 CDC. (2018). HIV treatment Can Prevent Sexual Transmission. https: //www. cdc. gov/hiv/pdf/risk/art/cdc-hiv-tasp -101. pdf 32 CDC. (2018). HIV Treatment as Prevention. https: //www. cdc. gov/hiv/risk/art/index. html