EPIDEMIOLOGY AND PREVENTION OF INFLUENZA Introduction Unique epidemiology


- Slides: 16

EPIDEMIOLOGY AND PREVENTION OF INFLUENZA

Introduction • Unique epidemiology: – Seasonal attack rates of 10% to 30% – Global epidemics • Influenza viruses are epizootic in – avian – animal • The influenza continue to cause widespread epidemics

Clinical Features of Influenza • • • Fever with respiratory symptoms Myalgia and headache GI symptoms Primary influenza viral pneumonia Secondary bacterial pneumonia

Transmission • Aerosols secretions (coughing, sneezing, and talking) • Direct or indirect • IP 1 - 4 days • Infectivity: shortly before the appearance of the symptoms up to the 4 th or 5 th day of the symptoms

Diagnosis • • Viral culture Serology Rapid test PCR

The Virus • First isolated 1933 • Technique of culture in hens’ eggs first described in 1936 • Influenza virus B first isolated in 1940 • Influenza virus C first isolated in 1947

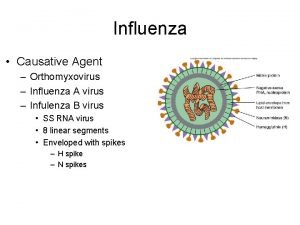
The virus • 3 types (A, B, and C) • A and B contain 8 segments of single-straded RNA – That code for 10 proteins – The most important 2 glycoproteins are HA and NA. Their importance are in the pathogenesis and immune protection.

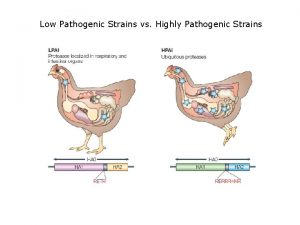
The Virus • HA function – It serves as an attachment protein – It also serves as a virulence determinant • NA function – NA cleaves sialic acid residues to allow virus release from the host epithelial cell • The subtypes of influenza A viruts are determined by these two surface antigens

Epidemics and Pandemics • Annual epidemics • Global Pandemics

Characteristic pattern of an influenza pandemic • • • Starts from a single geographic focus Rapidly spread along routes of travel High attack rate of all age groups Case fatality isn’t increased substanically Multiple waves

Pandemics and Epidemics • The 1918 Spanish influenza pandemic – AR = 20% - 30% – CF 15% - 50% (mostly in young adult) • Annual local epidemics characteristics: – – – Follow predictable pattern Usually occur between November and March in the northern hemisphere High attack rates among schoolchildren Increased pneumonia and influenza hospital admission Increased number of deaths from pneumonic and influenza Usually starts abruptly and reaches the peak within 3 wks and ends by the 8 th wk 2 strains may coexist Usually occur between May and September in the southern hemisphere Virus survives better in environments of lower temperature and humidity Rates of infection in infants and children are higher than those of adults Rates of hospitalization are highest in infants followed by elderly

Factors affecting the size and impact of an influenza epidemics • Degree of the antigenic variation of the new virus • Virus virulence • Existing protective immunity

Epidemics in North America AR 10%-20% AR in certain population group ranges between 40%-50% Influenza associated deaths range between 20, 000 and 40, 000 annually Persons aged more than 65 years account for 90% of influenza associated deaths • The cumulative deaths during successive annual epidemics of an interpandemic period often exceed the death in the pandemic period • • – Example: In the 1968 -69 H 3 N 2 pandemic, total deaths estimated to be 34, 000, but the virus caused more than 300, 000 deaths in the annual epidemics in the subsequent 21 years • Annual influenza has been associated with an average of 226, 000 hospitalizations per year in the United States • Most epidemic and all 20 th-century pandemic infections by influenza virus are type A

Surveillance of Influanza • Necessary to track epidemic • To detect pandemics • To determine virus serotypes for vaccine policy

Mechanisms of Antigenic Variation • Antigenic drift – Minor antigenic changes • Antigenic shift – Major antigenic changes • Mixing vessel • Pandemic may occur when: – If a shift variant: • Retains the ability to replicate well in humans • Is efficiently transmissible between humans • And has new surface HA or NA determinants that evade existing influenza antibody profiles in the human population • 3 antigenic shifts occurred during the 20 th century

 Primary prevention secondary prevention tertiary prevention
 Piano di divisione delle staffe
 The causative agent of influenza
 The great influenza rhetorical analysis essay
 Influenza
 Influenza
 Stomach flu vs influenza
 Is influenza a airborne disease
 Virus de la influenza
 Influenza vaccine dosage chart 2019-2020
 Influenza ww1
 Influenza virus replication
 Low pathogenic avian influenza
 Student portfolio introduction sample
 Thesourceagents
 Define nutritional epidemiology
 Difference between descriptive and analytical epidemiology


