Epidemiology 503 Confounding Confounding Situation in which a


- Slides: 20
Epidemiology 503 Confounding
Confounding • Situation in which a non-causal association between a given exposure and an outcome is observed as a result of the influence of a third variable (confounder).
Example of Confounded Association
Example of Confounded Association
Example of Confounded Association This means non-causally associated A directed arrow means that one factor causes another
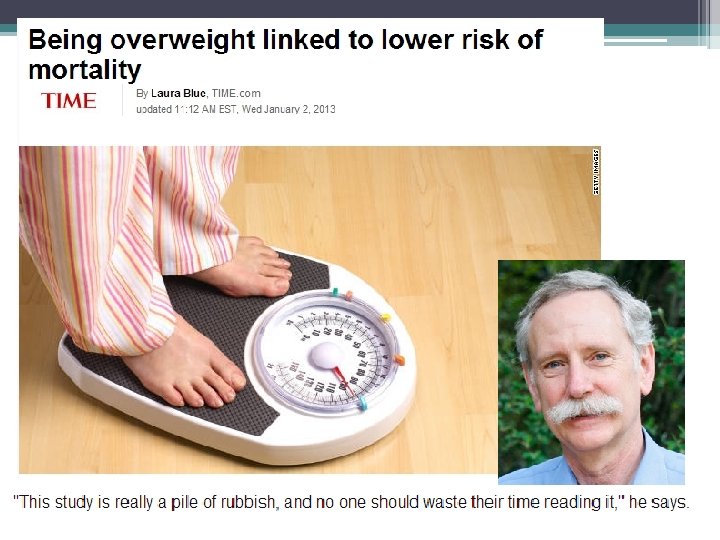
Confounding in a Causal Diagram Health Status Weight Death
Why is Confounding a Problem? Because…. . . • The estimate of association between exposure and disease includes BOTH the contribution of the exposure AND the confounder
Properties of a Confounder • Predictive of disease among the unexposed Drinking Car Crashes • Associated with exposure in source population Drinking Smoking • Not a downstream cause of the exposure (e. g. , in the causal pathway from exposure to disease) Smoking Drinking Car Crashes Can overestimate true association (positive confounding) or underestimates true association (negative confounding)
Positive and Negative Confounding E + + C D + E + D - + C • Conceptually incorporating effect of E and C on disease • Can use multiplication to help you figure out the directionality (+) = positive confounding, overestimate effect, (-) = negative confounding, underestimate effect
Assessing Confounding in Your Data 1. Does it meet the definition of a confounder? A. Assess association between your confounder and your exposure. Is it correlated? ? B. Assess association between your confounder and your outcome among the unexposed. Is it a risk factors for the outcome in the absence of the exposure? ? C. Think scientifically about the factors. Is it an intermediate?
Assessing Confounding in Your Data 1. Do you see evidence of confounding in your data? A. CALCULATE the CRUDE measure of association between exposure and outcome (RR or OR) B. CALCULATE the strata specific RRs or Ors C. COMPARE crude to strata specific RRs or ORs If measure of association is the same in the strata but different than the crude then you have evidence of confounding!
Example: Coffee Drinking and Lung Cancer Smoking Coffee Lung Cancer
Is smoking associated with coffee drinking? ? Cf+ Cf- Total S+ 800 200 1000 S- 100 900 1000 900 1100 2000 PR for Coffee Drinking Among Smokers vs. Non-Smokers: (800/1000)/(100/1000) = 8
Is smoking associated lung cancer among non-coffee drinkers? Ca+ Ca- Total S+ 40 160 200 S- 45 855 900 85 1015 1100 RR for Cancer Among Smokers vs. Non-Smokers who don’t drink coffee: (40/200 )/ (45/900) = 4. 0 ?
Can coffee drinking cause someone to smoke? ?
Calculate crude association between coffee drinking and lung cancer. Coffee None Total Cancer None Total 165 85 250 735 1015 1750 900 1100 2000 Unadjusted RR= (165/900) (85/1100) =2. 37 “Crude RR” ?
Check if coffee associated with lung cancer within smoking strata. Non-Smokers D+ D- Total E+ 160 640 800 E+ 5 95 100 E- 40 160 200 E- 45 855 900 200 800 1000 50 950 1000 RR Smoker Strata= (160/800)/(40/200) = 1. 0 RR Non-Smoker Strata= (5/100)/(45/900) = 1. 0
Compare strata-specific RR to crude RR • Smoking confounds the association between coffee and cancer because: ▫ The strata specific RR are equal (1. 0) – though they don’t have to be as equal as we observed ▫ The strata specific RR of 1. 0 is NOT the same as the crude RR of 2. 37 • The difference between the strata specific and crude is large so we conclude that this is important confounding ▫ Some people use a 10 or 20% rule as a rough metric of “importance”
How to Report Data with Confounders If you have a confounder: • DO NOT report crude OR or RR! • Instead report stratum-specific OR or RR or adjusted OR or RR from regression model • Other methods for summarizing strata-specific OR or RR (e. g. , Mantel-Haenszel – a weighted average)