Epidemic of Obesity Mayo Clinic Health Letter Medical

Epidemic of Obesity Mayo Clinic Health Letter, Medical Essay, 1997

Prevalence of Breathlessness with Exertion in Overweight & Obese Individuals NHANES III, 28% of Overweight Adults, 27 < BMI < 31 (~ 19 Million) 40 Percent (%) 35 NHANES III, 36% of Obese, BMI > 31 (~ 22 Million) 33% of M-to-M Obese, 30 < BMI < 43 30 25 20 15 10 5 0 Sin, etal, Arch. Intern. Med, 1996

Intensity of Breathlessness on Exertion After 6 min of cycling at 60 W RPB (Borg scale 0 -10) 10 8 * 6 4 2 0 Obese without Obese with Breathlessness (n=8, BMI 36+5) (n=8, BMI 37+4)
 3 . Woman 49")
. VO 2 - Work Rate Relationship VO 2 (L/min) 3 . Woman 49 yr 163 cm 154 kg DOE 2 . VO 2 (Observed). VO 2 (Predicted) Extreme Obesity 1 0 0 20 40 60 80 Work Rate (W) 100 120
 120 . Women Men Women 80 40 0")
Cardiovascular Exercise Capacity VO 2 (%Predicted) 120 . Women Men Women 80 40 0 Lean Obese Without & With Breathlessness

Lung Volume Subdivisions Lean Mayo Clinic Health Letter, Medical Essay, 1997 Obese

MRI at Various Lung Volumes Obese TLC Obese FRC Obese RV
")
Flow-Volume Loop in Extreme Obesity 49 yr 163 cm 154 kg DOE Flow (L/sec) 4 0 Flow (L/sec) 8 Absolute Volume (L) Volume below TLC (L) -4 0 1 2 3 4 6 Volume (L) 4 2 0

Theoretical Effects of Chest Wall Obesity Rib cage fat Posterior subcutaneous abdominal fat Anterior subcutaneous abdominal fat Obese D LOA D Lean Visceral fat Inspiratory Force ?
 Work of Breathing 4 * 3 2 1")
O 2 Cost of Breathing (ml/L) Work of Breathing 4 * 3 2 1 0 Obese without Obese with Breathlessness n=8, BMI 36+5 n=8, BMI 37+4
 Relationship between Work of Breathing and Breathlessness Obese")
O 2 Cost of Breathing (ml/L) Relationship between Work of Breathing and Breathlessness Obese without Breathlessness 4 3 2 y = 0. 20 x + 1. 46 R 2 = 0. 57 1 0 0 2 4 6 8 RPB (Borg scale 0 -10) 10
 Work of Breathing and Fat Distribution Obese without")
O 2 Cost of Breathing (ml/L) Work of Breathing and Fat Distribution Obese without Breathlessness 5 Obese with Breathlessness 4 3 2 y = 0. 59 x - 0. 42 R 2 = 0. 62 1 0 0 2 4 6 8 Anterior Subcutaneous Abdominal Fat (kg)

Obesity of the Chest Wall

Abdominal Fat Mayo Clinic Health Letter, Medical Essay, 1997

Altered Respiratory Mechanics Increasing Respiratory Impedance Obesity -Low lung volume breathing -Decreased chest wall compliance -Expiratory flow limitation -Increased pulmonary resistance Without Dyspnea on Exertion -Increased oxygen cost of breathing and increased abdominal fat distribution With Dyspnea on Exertion Potential Mechanisms of Dyspnea during Exercise Chest Tightness Pulmonary receptor feedback Air Hunger Corollary discharge from respiratory motor activity in brainstem respiratory centers + Chemoreceptor feedback Effort/Work Corollary discharge from cortical motor centers + Respiratory Mechanoreceptor feedback


Mahler, etal, AJRCCM, 1996

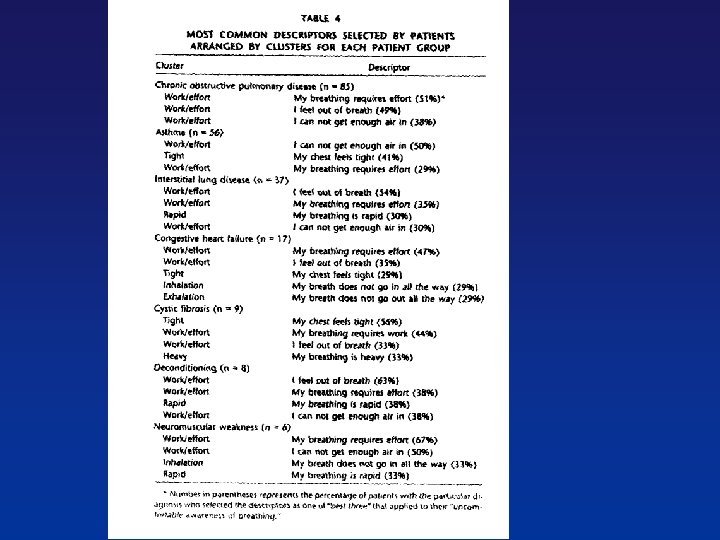
Patient Specific Clusters Mahler, etal, AJRCCM, 1996

Respiratory Sensations in Mild-to. Moderately Obese Women

Summary 1. Dyspnea on exertion is prevalent in mild-to-moderate obesity 2. Shortness of breath on exertion does not appear to be associated with CV deconditioning 3. There are significant obesity-related changes in respiratory mechanics at rest and during exercise in mild-to-moderate obesity 4. Shortness of breath on exertion appears to be associated with an increased work of breathing and abdominal fat distribution 5. Obesity-related changes in respiratory mechanics, O 2 cost of breathing, and abdominal fat distribution appear to change respiratory muscle efferent and afferent signals and these changes give rise to the primary sensation of work or effort to breathe

Thank You

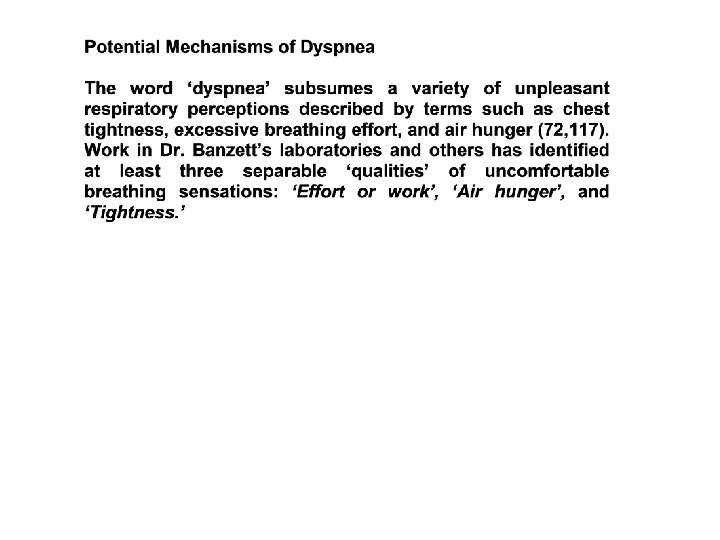
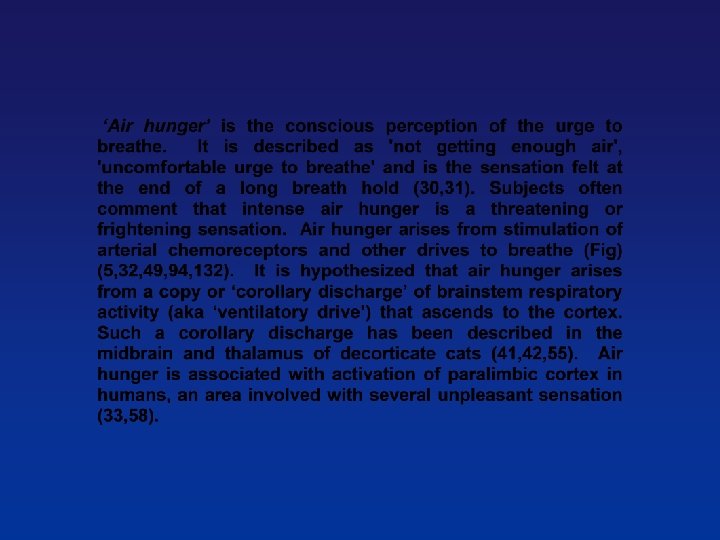
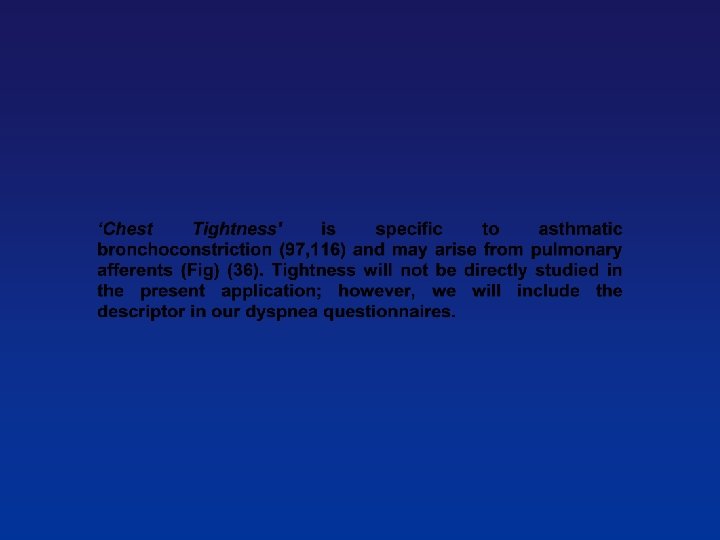
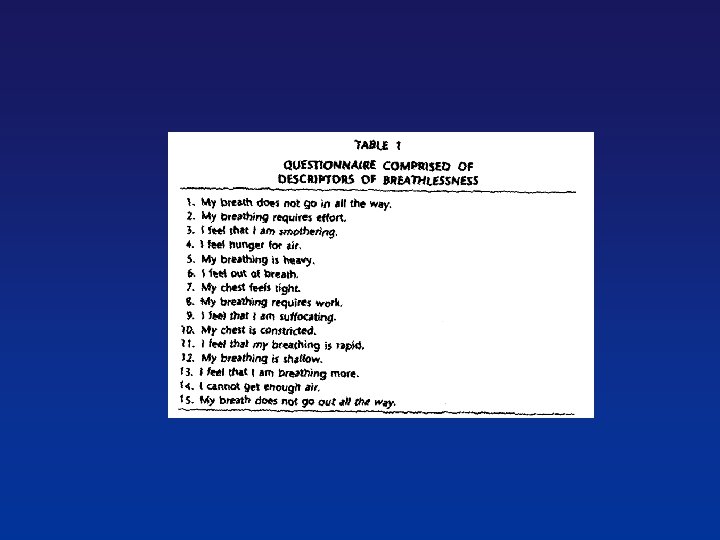
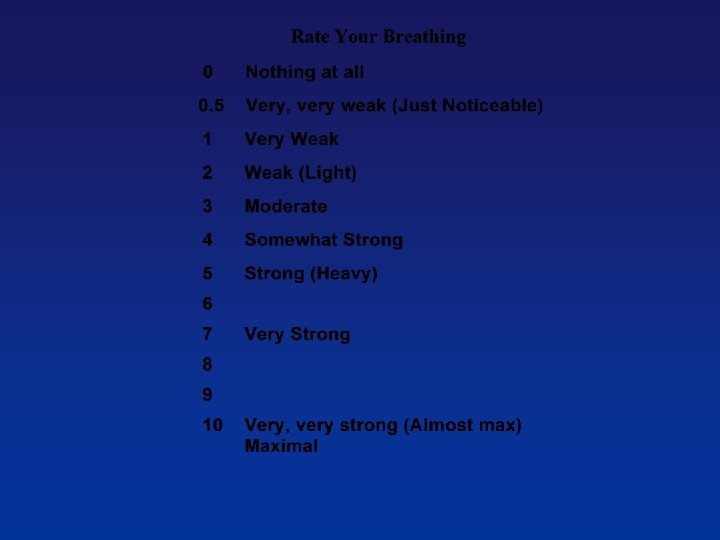
Potential Mechanisms of Dyspnea The word ‘dyspnea’ subsumes a variety of unpleasant respiratory perceptions described by terms such as chest tightness, excessive breathing effort, and air hunger. At least three separable ‘qualities’ of uncomfortable breathing sensations have been identified in the laboratory termed ‘Effort or work, ’ ‘Air hunger, ’ and ‘Tightness. ’ ‘Effort or work’ of breathing is perceived when the work of breathing is increased by high minute ventilation (rate or tidal volume) or in the lab by external impedance to inspiration. ‘Air hunger’ is the conscious perception of the urge to breathe. It is described as ‘not getting enough air, ’ ‘uncomfortable urge to breathe, ’ and is the sensation felt at the end of a long breath hold. Subjects often comment that intense air hunger is a threatening or frightening sensation. ‘Chest tightness’ is specific to asthmatic bronchoconstriction.
 in obesity, we")
Study Details To examine the basic mechanism of breathing discomfort (dyspnea) in obesity, we will use a debriefing session and a modified dyspnea questionnaire of qualitative respiratory sensation descriptors to investigate the qualities of respiratory sensations and the mechanisms of breathing discomfort in obese subjects during exertion. We propose that the mechanism of this breathing discomfort is related to changes in respiratory muscle efferent and afferent signals associated with the increased oxygen cost of breathing, which is in turn associated with altered respiratory mechanics and fat distribution, and that these changes give rise to the primary sensation of work or effort to breathe rather than the sensations of air hunger or chest tightness. These techniques have not been attempted in obese subjects.

Potential Applications for Identifying Types of Respiratory Sensation • Establish a specific diagnosis (e. g. , a pts selection of descriptors may direct diagnostic testing) • To determine quality of discomfort ask the pt to note two to three statements that best describe dyspnea (similar to asking for characteristics and qualities of chest) • In pt with two concurrent diseases, selected descriptors may help identify which condition is the cause of dyspnea (e. g. , ‘tightness of asthma from ‘work’ of COPD) • Distinguish progression of underlying disease from CV deconditioning secondary to disease process • Descriptor questionnaire may also be used to evaluate mechanisms whereby a specific intervention relieves dyspnea (e. g. , asthma tightness from airways as well as work effort of Raw) Mahler etal AJRCCM, 1996

Theoretical Effects of Chest Wall Obesity Obese Inspiratory Force D LOA D Lean ?
 120 Women Men 80 40 . 0 Lean Obese")
VO 2 (%Predicted) 120 Women Men 80 40 . 0 Lean Obese
 400 y =")
Obese with breathlessness 500 Obese without breathlessness VO 2 (m. L/min) 400 y = 3. 5 x + 0. 21 . 300 R 2 = 0. 99 y = 2. 0 x + 0. 19 R 2 = 0. 99 200 Eucapnic Voluntary Hyperpnea 100 Rest 0 0 20 40 . VE (L/min) 60 80
 8 4 0 IC ERV")
Implications of Lung Volume on Airflow 12 Flow (L/sec) 8 4 0 IC ERV FRC -4 -8 TLC 0 RV 2 4 6 Volume (L) 8
 20 60 15 40 10 20 VO 2 (ml/kg/min)")
80 25 VO 2 (%Pred) 20 60 15 40 10 20 VO 2 (ml/kg/min) 0 Rest Maximal Exercise Workload 5 0 . VO 2 (ml/kg/min) 30 . . 100 . VO 2 (%Pred) Addition to Figure 1: Functional Capacity vs Fitness Level

Lung Volume and Gas Distribution


 with Chronic Airflow Limitation")
Ventilatory Patients. Limitations with Chronic in Airflow Patients Limitation (CAL) with Chronic Airflow Limitation (CAL) Flow (L/s) 8 4 0 -4 2 4 Volume (L) Babb Rodarte etal. JAP&MSSE 1991, 1992, and 1993 V e n t i l LO M t Med, Resp. Physiol. Neurobiology, Int J Obes 2002, 2003, 2004, 2005 a eb y o C l i n i c H e a l t h L e ae ns e
")
Flow-Volume Loop in Extreme Obesity 49 yr 163 cm 154 kg DOE Flow (L/sec) 4 0 Flow (L/sec) 8 Absolute Volume (L) Volume below TLC (L) -4 0 1 2 3 4 6 Volume (L) 4 2 0
 5 Rest 0 -5 Inspiration")
Exercise Flow-Volume Loops 10 Expiration FVC Exercise Flow (L/sec) 5 Rest 0 -5 Inspiration -10 4 3 2 1 0 4 Volume (L) 3 2 1 0
 8 49 yr 163 cm 154 kg DOE 4 0 Absolute Volume")
Flow (L/sec) 8 49 yr 163 cm 154 kg DOE 4 0 Absolute Volume (L) -4 0 6 4 2 Volume (L) 0
 120 80 . 8 . 40")
Exercise and Breathing Pattern 160 12 VE (L/min) 120 80 . 8 . 40 0 40 80 120 160 200 LOAD (W) 4 60 3 40 2 20 1 0 40 80 . VE (L/min) 120 0 Flow (L/s) 4 Frequency (bpm) Tidal Volume (L) 0 0 -4 TLC -8 0 RV 2 4 6 VOLUME (L) 8
 3 2")
. Figure 1: VO 2 - Work Rate Relationship VO 2 (L/min) 3 2 Linear relationship, independent of age, sex, or Ht. Predicted maximal work rate and VO 2 displayed Considerably more information is learned from CPET about CV fxn and Gx when the external work is known - cycle is better for this reason Plot response side-by-side to predicted normal response Observed 1 Predicted Response . 0 0 20 40 60 80 Work Rate (W) 100 120
 20 60 15 40 10 20 VO 2 (ml/kg/min)")
80 25 VO 2 (%Pred) 20 60 15 40 10 20 VO 2 (ml/kg/min) 0 Rest Maximal Exercise Workload 5 0 . VO 2 (ml/kg/min) 30 . . 100 . VO 2 (%Pred) Addition to Figure 1: Functional Capacity vs Fitness Level

Altered Respiratory Mechanics Increasing Respiratory Impedance Obesity -Low lung volume breathing -Decreased chest wall compliance -Expiratory flow limitation -Increased pulmonary resistance Without Dyspnea on Exertion -Increased oxygen cost of breathing and increased abdominal fat distribution With Dyspnea on Exertion Potential Mechanisms of Dyspnea during Exercise Chest Tightness Pulmonary receptor feedback Air Hunger Corollary discharge from respiratory motor activity in brainstem respiratory centers + Chemoreceptor feedback Effort/Work Corollary discharge from cortical motor centers + Respiratory Mechanoreceptor feedback
- Slides: 51