
EPDM 566 Epid of CVD Regression of Atherosclerosis

- Slides: 52
EPDM 566 – Epid of CVD Regression of Atherosclerosis Raymond Knutsen MD, MPH
The golden egg: A Drug § That has to be taken from young age § That has effect on risk late in life
Regression of Atherosclerosis By Lifestyle changes: § Is that possible, when lesions are formed? § Is it possible to reverse the atherosclerotic process, not only stop it?
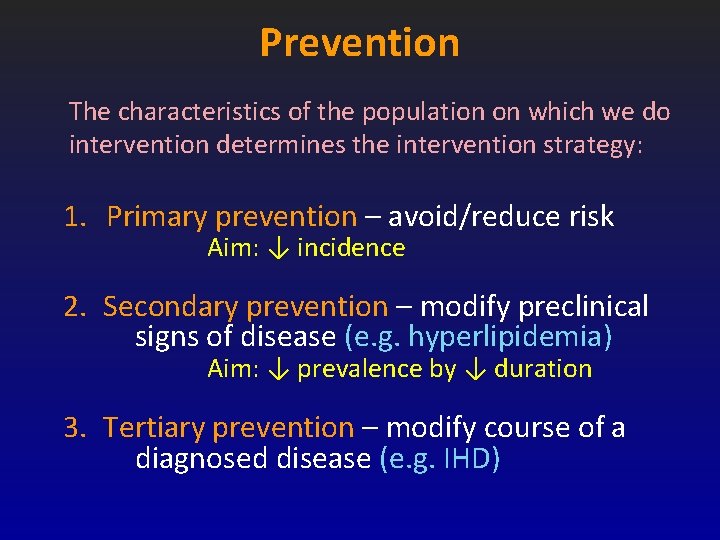
Prevention The characteristics of the population on which we do intervention determines the intervention strategy: 1. Primary prevention – avoid/reduce risk Aim: ↓ incidence 2. Secondary prevention – modify preclinical signs of disease (e. g. hyperlipidemia) Aim: ↓ prevalence by ↓ duration 3. Tertiary prevention – modify course of a diagnosed disease (e. g. IHD)
Prevention Regression studies - outcomes § Regression § Stabilization § Progression
How to assess regression of atherosclerosis Pathologists’ assessment § Shrinkage of intimal plaque through a reduction in its major components – Smooth muscle – Macrophages – Connective tissue – Lipid deposits
How to assess regression of atherosclerosis Clinicians’ assessment § Enlargement in the caliber of the lumen of a narrowed artery. Could be due to: – Plaque shrinkage – Lysis of fully occlusive thrombi or mural thrombi – Healing of an acutely disrupted plaque – Adaptive enlargement of underlying arterial architecture – Relaxation of arterial vasomotor tone
Atherosclerosis a normal aging process? § A few decades ago atherosclerosis was not considered accessible for intervention § Elevated serum cholesterol seems to be a necessary factor for atherosclerosis to occur § BUT, normalization of blood lipids does not necessarily stop progression or normalize the blood vessels
Atherosclerosis is a multifactorial disease and also influenced by other factors: § Whether LDL is in its native or oxidized form: • Through endothelia 10 x faster • Taken up by macrophages foam cells § Amount of antioxidants in the diet § The function of the thromboembolic system § The activity of the fibrinolytic system § Level of stress hormones § More?
Early observations indicating possibility of regression of atherosclerosis § Vartiainen and Kanerva (Ann Med Intern Fenn 1947; 36: 748 -58) – Observed less atheromas at autopsy of starved persons compared to well fed persons § Wilens (Am J Pathol 1947; 23: 793 -804) – Atherosclerosis was not present in persons with diseases causing weight loss (e. g. cancer)
Early observations indicating possibility of regression of atherosclerosis § Observations in Norway by Strom et al over morbidity during WW II • Incidence of IHD and diabetes was dramatically • Diet changes during WW II: less sugar, white flour, dairy fat, meat. More potatoes, fish and whole grains. § These observations suggest possible regression of atherosclerosis, but the observations by Strom et al could also be due to • thromboembolism • tobacco use during WWII
Assessment of regression § The early studies doing actual measurements were done as experimental studies in animals assessing effect through autopsies. § Objective assessment of degree of atherosclerosis first became available for human studies as a result of: – refined angiographic techniques – ultrasound assessment of intima-media thickness – Magnetic Resonance Imaging (MRI)
Animal studies § Animal model for atherosclerosis development – Rabbits, birds, monkeys and pigs – More difficult in rodents to develop atherosclerosis through diet
Animal studies § Studies in rabbits: – 1957 Friedman et al reported the first interventional study on cholesterol-fed rabbits: • Total plasma cholesterol about 26 mmol/l (1, 000 mg/dl) • Induced widespread lesions involving around 90% of the aorta • Bolus injections of phosphateidylcholine (PC) to mobilize tissue stores of cholesterol • After <1. 5 week of treatment, the remaining plaques were scattered and far smaller, and ¾ of arterial cholesterol stores had been removed. Friedman M et al. Proc Soc Exp Biol Med 1957; 95. 586 -588.
Animal studies § Studies on monkeys: – 1970 Armstrong et al studied 12 rhesus monkeys: • cholesterol rich diet for 17 months • 50% killed after 17 months and showed significant atherosclerosis • Other half had normal diet for another 13 months and were then killed. Showed significantly less atherosclerosis than first group. • CONCLUSION: Regression had occurred
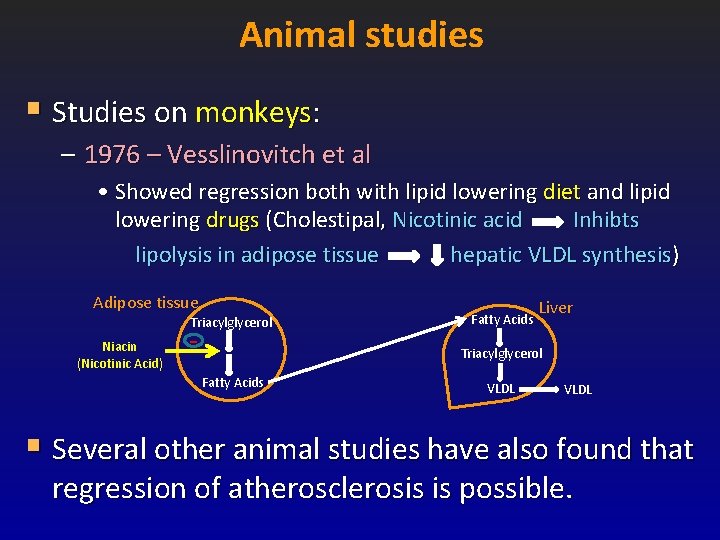
Animal studies § Studies on monkeys: – 1976 – Vesslinovitch et al • Showed regression both with lipid lowering diet and lipid lowering drugs (Cholestipal, Nicotinic acid Inhibts lipolysis in adipose tissue hepatic VLDL synthesis) Adipose tissue Triacylglycerol Niacin (Nicotinic Acid) - Fatty Acids Liver Triacylglycerol Fatty Acids VLDL § Several other animal studies have also found that regression of atherosclerosis is possible.
Studies in humans § Early, uncontrolled studies § Controlled clinical trials – Drugs and diet, combined – Drugs only – Diet only
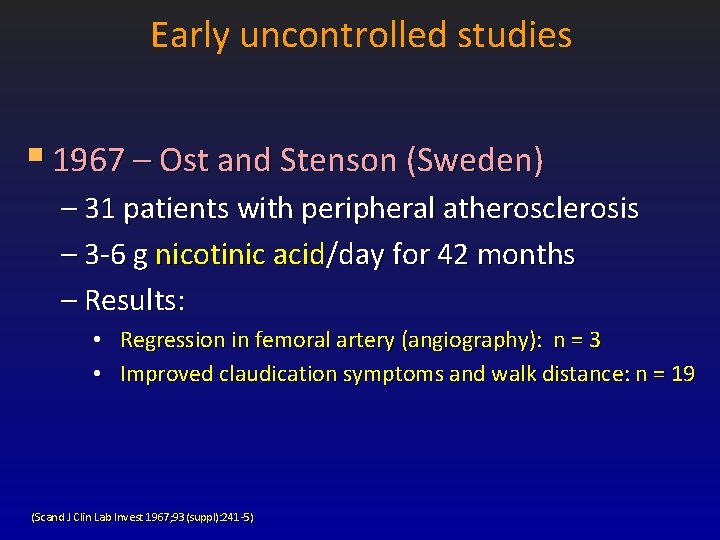
Early uncontrolled studies § 1967 – Ost and Stenson (Sweden) – 31 patients with peripheral atherosclerosis – 3 -6 g nicotinic acid/day for 42 months – Results: • Regression in femoral artery (angiography): n = 3 • Improved claudication symptoms and walk distance: n = 19 (Scand J Clin Lab Invest 1967; 93(suppl): 241 -5)
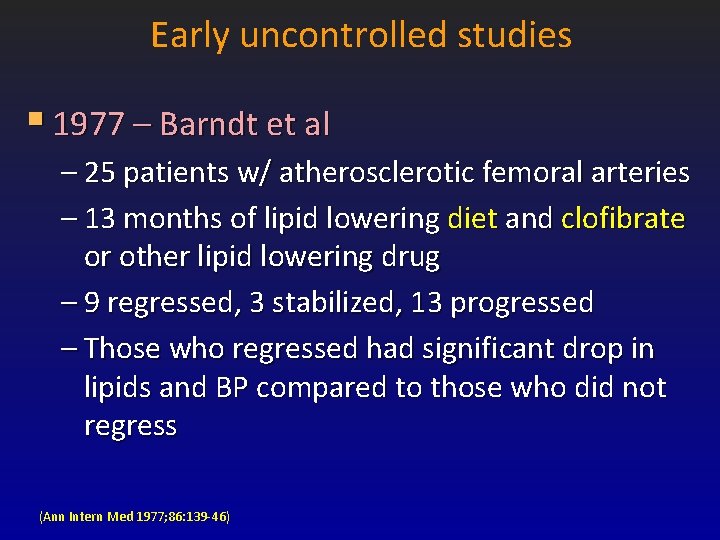
Early uncontrolled studies § 1977 – Barndt et al – 25 patients w/ atherosclerotic femoral arteries – 13 months of lipid lowering diet and clofibrate or other lipid lowering drug – 9 regressed, 3 stabilized, 13 progressed – Those who regressed had significant drop in lipids and BP compared to those who did not regress (Ann Intern Med 1977; 86: 139 -46)
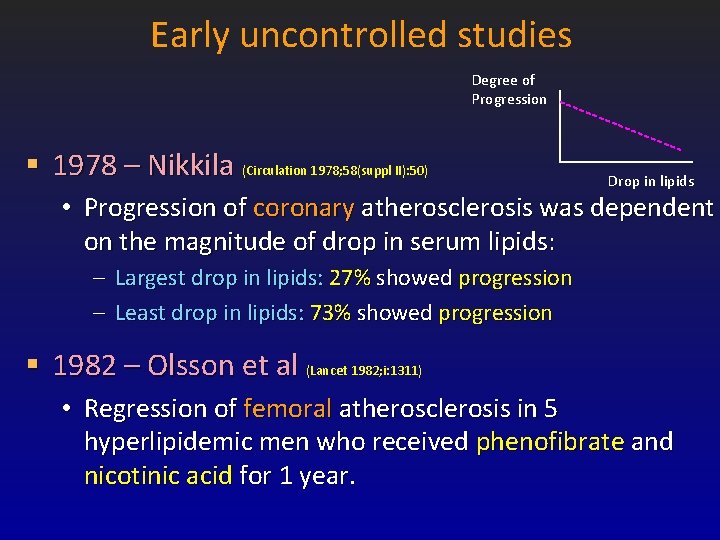
Early uncontrolled studies Degree of Progression § 1978 – Nikkila (Circulation 1978; 58(suppl II): 50) Drop in lipids • Progression of coronary atherosclerosis was dependent on the magnitude of drop in serum lipids: – Largest drop in lipids: 27% showed progression – Least drop in lipids: 73% showed progression § 1982 – Olsson et al (Lancet 1982; i: 1311) • Regression of femoral atherosclerosis in 5 hyperlipidemic men who received phenofibrate and nicotinic acid for 1 year.
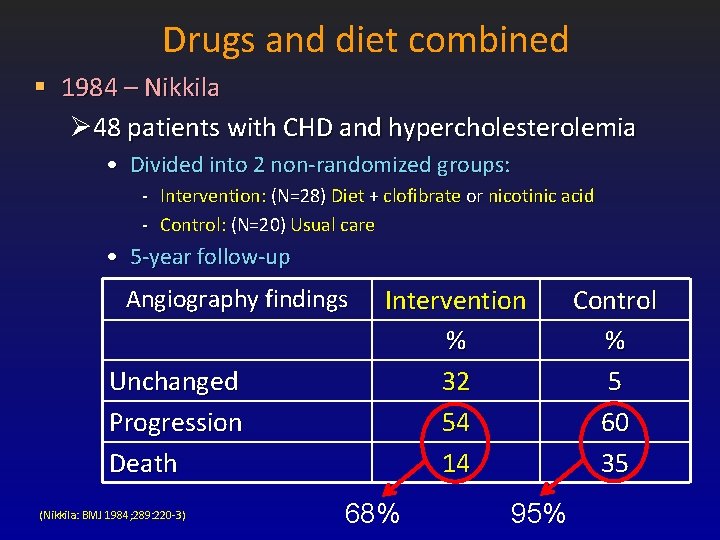
Drugs and diet combined § 1984 – Nikkila Ø 48 patients with CHD and hypercholesterolemia • Divided into 2 non-randomized groups: - Intervention: (N=28) Diet + clofibrate or nicotinic acid - Control: (N=20) Usual care • 5 -year follow-up Angiography findings Unchanged Progression Death (Nikkila: BMJ 1984; 289: 220 -3) Intervention % 32 54 14 68% 95% Control % 5 60 35
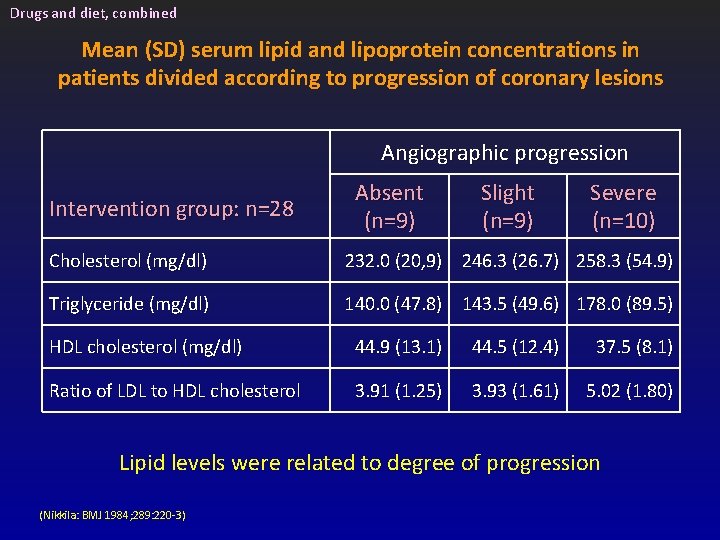
Drugs and diet, combined Mean (SD) serum lipid and lipoprotein concentrations in patients divided according to progression of coronary lesions Angiographic progression Intervention group: n=28 Absent (n=9) Slight (n=9) Severe (n=10) Cholesterol (mg/dl) 232. 0 (20, 9) 246. 3 (26. 7) 258. 3 (54. 9) Triglyceride (mg/dl) 140. 0 (47. 8) 143. 5 (49. 6) 178. 0 (89. 5) HDL cholesterol (mg/dl) 44. 9 (13. 1) 44. 5 (12. 4) 37. 5 (8. 1) Ratio of LDL to HDL cholesterol 3. 91 (1. 25) 3. 93 (1. 61) 5. 02 (1. 80) Lipid levels were related to degree of progression (Nikkila: BMJ 1984; 289: 220 -3)
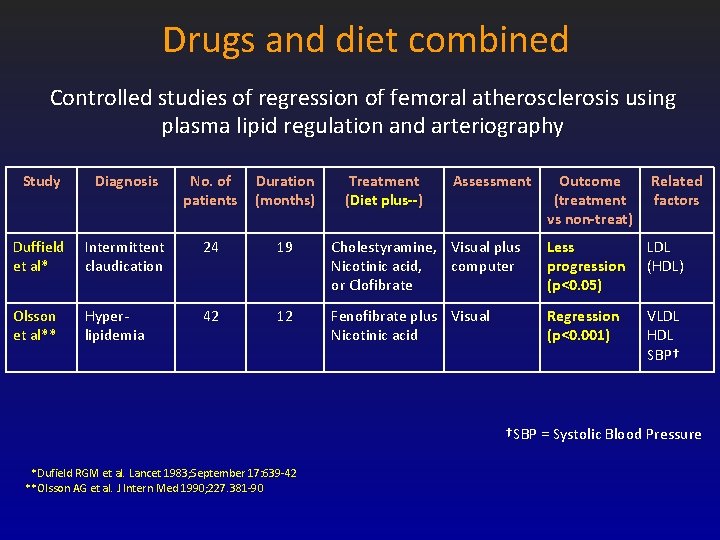
Drugs and diet combined Controlled studies of regression of femoral atherosclerosis using plasma lipid regulation and arteriography Study Diagnosis No. of patients Duration (months) Duffield et al* Intermittent claudication 24 19 Olsson et al** Hyperlipidemia 42 12 Treatment (Diet plus--) Assessment Outcome (treatment vs non-treat) Related factors Cholestyramine, Visual plus Nicotinic acid, computer or Clofibrate Less progression (p<0. 05) LDL (HDL) Fenofibrate plus Visual Nicotinic acid Regression (p<0. 001) VLDL HDL SBP† †SBP = Systolic Blood Pressure *Dufield RGM et al. Lancet 1983; September 17: 639 -42 **Olsson AG et al. J Intern Med 1990; 227. 381 -90
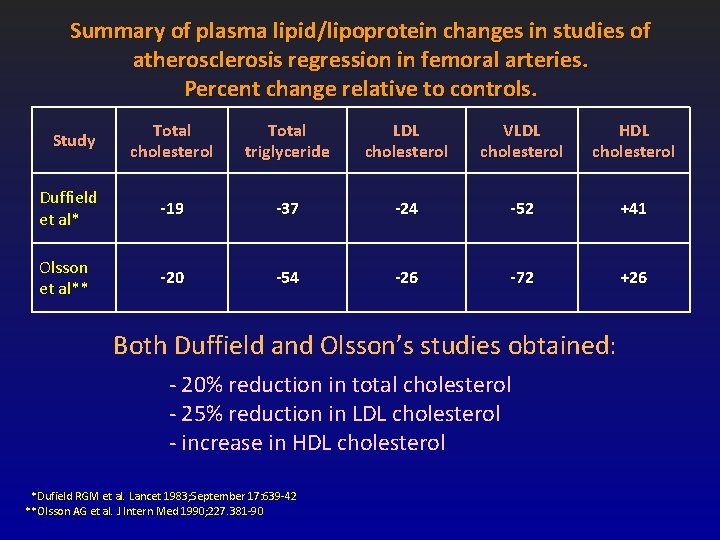
Summary of plasma lipid/lipoprotein changes in studies of atherosclerosis regression in femoral arteries. Percent change relative to controls. Total cholesterol Total triglyceride LDL cholesterol VLDL cholesterol HDL cholesterol Duffield et al* -19 -37 -24 -52 +41 Olsson et al** -20 -54 -26 -72 +26 Study Both Duffield and Olsson’s studies obtained: - 20% reduction in total cholesterol - 25% reduction in LDL cholesterol - increase in HDL cholesterol *Dufield RGM et al. Lancet 1983; September 17: 639 -42 **Olsson AG et al. J Intern Med 1990; 227. 381 -90
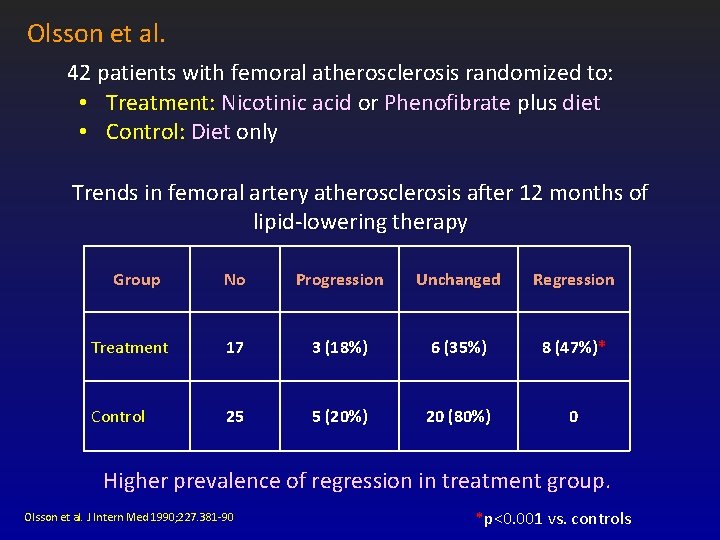
Olsson et al. 42 patients with femoral atherosclerosis randomized to: • Treatment: Nicotinic acid or Phenofibrate plus diet • Control: Diet only Trends in femoral artery atherosclerosis after 12 months of lipid-lowering therapy Group No Progression Unchanged Regression Treatment 17 3 (18%) 6 (35%) 8 (47%)* Control 25 5 (20%) 20 (80%) 0 Higher prevalence of regression in treatment group. Olsson et al. J Intern Med 1990; 227. 381 -90 *p<0. 001 vs. controls
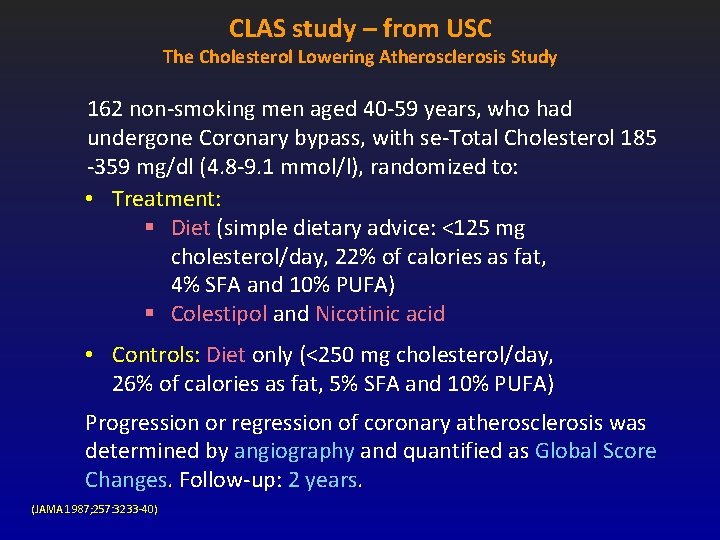
CLAS study – from USC The Cholesterol Lowering Atherosclerosis Study 162 non-smoking men aged 40 -59 years, who had undergone Coronary bypass, with se-Total Cholesterol 185 -359 mg/dl (4. 8 -9. 1 mmol/l), randomized to: • Treatment: § Diet (simple dietary advice: <125 mg cholesterol/day, 22% of calories as fat, 4% SFA and 10% PUFA) § Colestipol and Nicotinic acid • Controls: Diet only (<250 mg cholesterol/day, 26% of calories as fat, 5% SFA and 10% PUFA) Progression or regression of coronary atherosclerosis was determined by angiography and quantified as Global Score Changes. Follow-up: 2 years. (JAMA 1987; 257: 3233 -40)
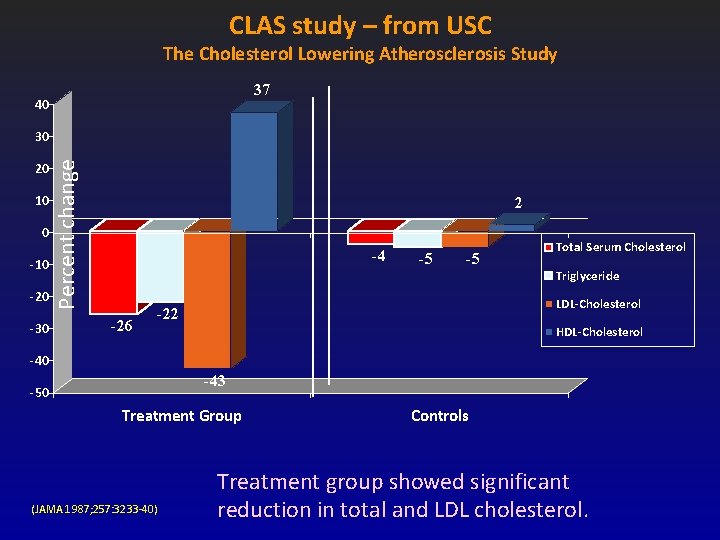
CLAS study – from USC The Cholesterol Lowering Atherosclerosis Study 37 40 20 10 0 -10 -20 -30 Percent change 30 2 -4 -26 -5 -5 Total Serum Cholesterol Triglyceride LDL-Cholesterol -22 HDL-Cholesterol -40 -43 -50 Treatment Group (JAMA 1987; 257: 3233 -40) Controls Treatment group showed significant reduction in total and LDL cholesterol.
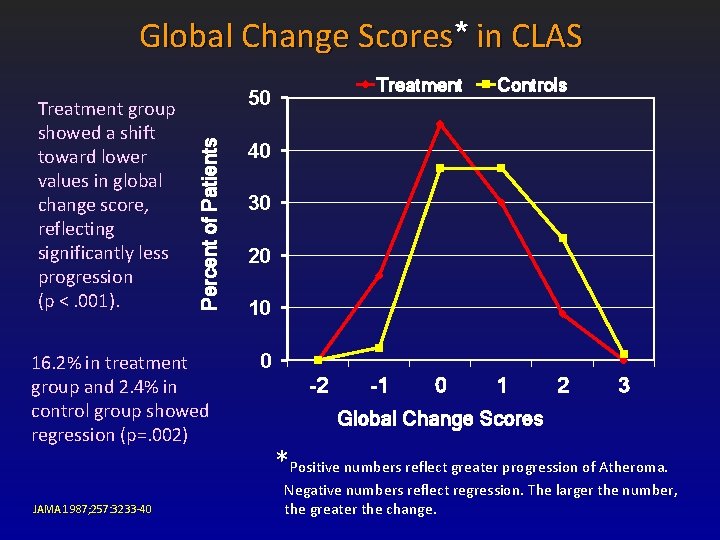
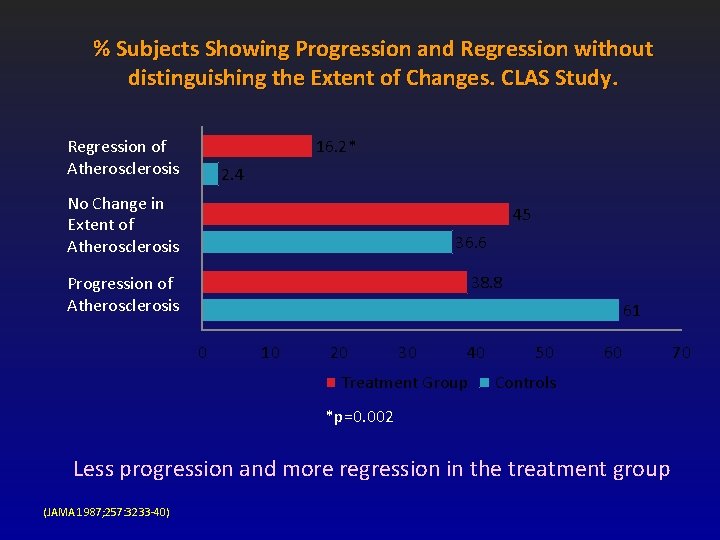
Global Change Scores* in CLAS 50 Percent of Patients Treatment group showed a shift toward lower values in global change score, reflecting significantly less progression (p <. 001). 16. 2% in treatment group and 2. 4% in control group showed regression (p=. 002) JAMA 1987; 257: 3233 -40 Treatment Controls 40 30 20 10 0 -2 -1 0 1 2 3 Global Change Scores *Positive numbers reflect greater progression of Atheroma. Negative numbers reflect regression. The larger the number, the greater the change.
% Subjects Showing Progression and Regression without distinguishing the Extent of Changes. CLAS Study. 16. 2* Regression of Atherosclerosis 2. 4 No Change in Extent of Atherosclerosis 45 36. 6 38. 8 Progression of Atherosclerosis 61 0 10 20 30 40 Treatment Group 50 60 Controls *p=0. 002 Less progression and more regression in the treatment group (JAMA 1987; 257: 3233 -40) 70
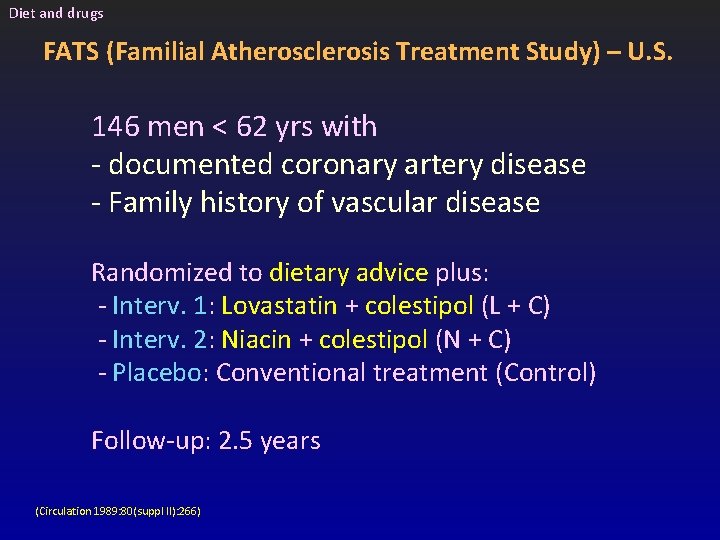
Diet and drugs FATS (Familial Atherosclerosis Treatment Study) – U. S. 146 men < 62 yrs with - documented coronary artery disease - Family history of vascular disease Randomized to dietary advice plus: - Interv. 1: Lovastatin + colestipol (L + C) - Interv. 2: Niacin + colestipol (N + C) - Placebo: Conventional treatment (Control) Follow-up: 2. 5 years (Circulation 1989: 80(suppl II): 266)
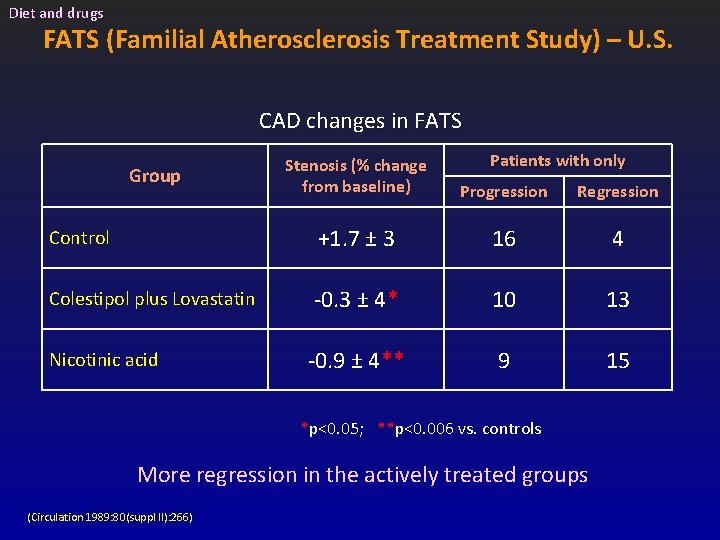
Diet and drugs FATS (Familial Atherosclerosis Treatment Study) – U. S. CAD changes in FATS Patients with only Stenosis (% change from baseline) Progression Regression Control +1. 7 ± 3 16 4 Colestipol plus Lovastatin -0. 3 ± 4* 10 13 Nicotinic acid -0. 9 ± 4** 9 15 Group *p<0. 05; **p<0. 006 vs. controls More regression in the actively treated groups (Circulation 1989: 80(suppl II): 266)
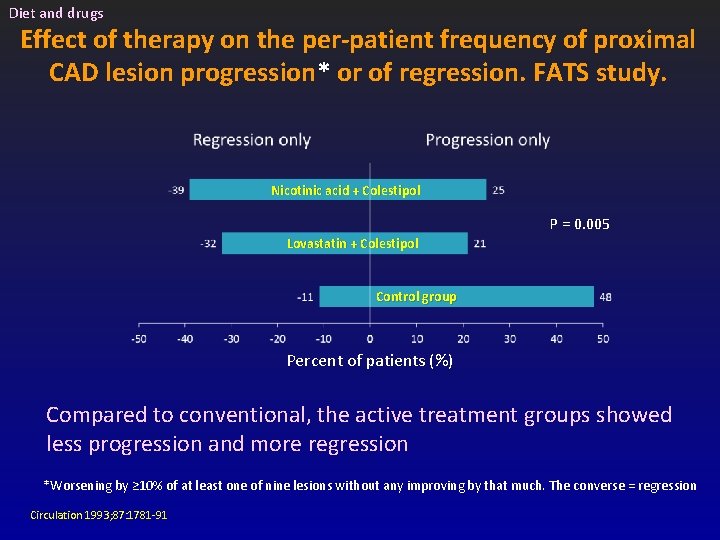
Diet and drugs Effect of therapy on the per-patient frequency of proximal CAD lesion progression* or of regression. FATS study. Nicotinic acid + Colestipol P = 0. 005 Lovastatin + Colestipol Control group Percent of patients (%) Compared to conventional, the active treatment groups showed less progression and more regression *Worsening by ≥ 10% of at least one of nine lesions without any improving by that much. The converse = regression Circulation 1993; 87: 1781 -91
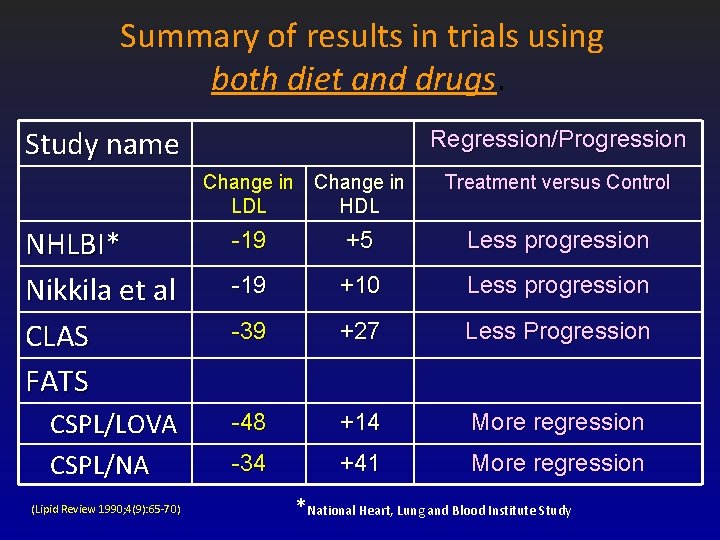
Summary of results in trials using both diet and drugs. Study name Regression/Progression Change in LDL HDL Treatment versus Control NHLBI* Nikkila et al CLAS FATS -19 +5 Less progression -19 +10 Less progression -39 +27 Less Progression CSPL/LOVA CSPL/NA -48 +14 More regression -34 +41 More regression (Lipid Review 1990; 4(9): 65 -70) *National Heart, Lung and Blood Institute Study
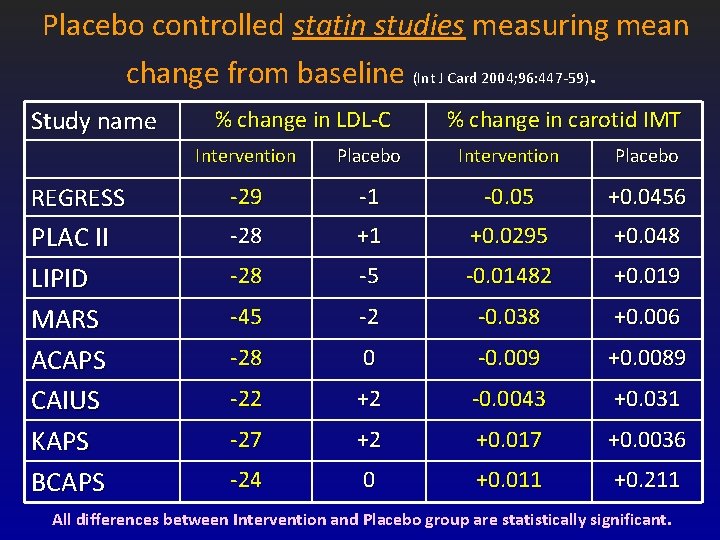
Placebo controlled statin studies measuring mean change from baseline (Int J Card 2004; 96: 447 -59). Study name % change in LDL-C % change in carotid IMT Intervention Placebo REGRESS -29 -1 -0. 05 +0. 0456 PLAC II LIPID MARS ACAPS CAIUS KAPS BCAPS -28 +1 +0. 0295 +0. 048 -28 -5 -0. 01482 +0. 019 -45 -2 -0. 038 +0. 006 -28 0 -0. 009 +0. 0089 -22 +2 -0. 0043 +0. 031 -27 +2 +0. 017 +0. 0036 -24 0 +0. 011 +0. 211 All differences between Intervention and Placebo group are statistically significant.
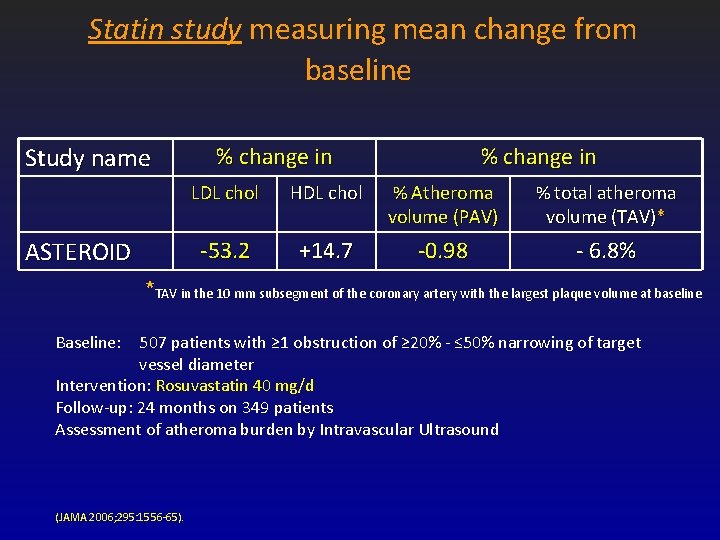
Statin study measuring mean change from baseline Study name ASTEROID % change in LDL chol HDL chol % Atheroma volume (PAV) % total atheroma volume (TAV)* -53. 2 +14. 7 -0. 98 - 6. 8% *TAV in the 10 mm subsegment of the coronary artery with the largest plaque volume at baseline Baseline: 507 patients with ≥ 1 obstruction of ≥ 20% - ≤ 50% narrowing of target vessel diameter Intervention: Rosuvastatin 40 mg/d Follow-up: 24 months on 349 patients Assessment of atheroma burden by Intravascular Ultrasound (JAMA 2006; 295: 1556 -65).
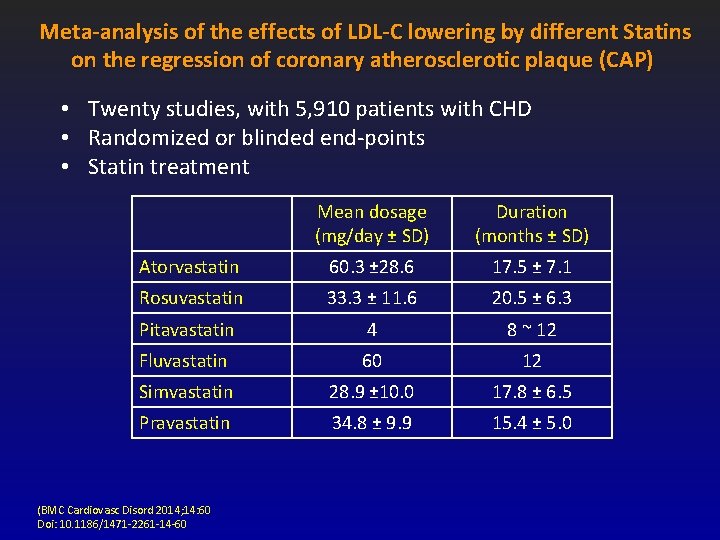
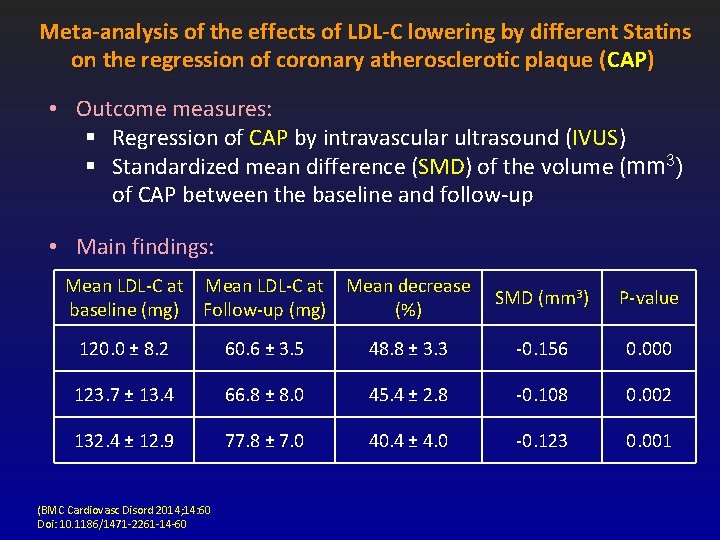
Meta-analysis of the effects of LDL-C lowering by different Statins on the regression of coronary atherosclerotic plaque (CAP) • Twenty studies, with 5, 910 patients with CHD • Randomized or blinded end-points • Statin treatment Mean dosage (mg/day ± SD) Duration (months ± SD) Atorvastatin 60. 3 ± 28. 6 17. 5 ± 7. 1 Rosuvastatin 33. 3 ± 11. 6 20. 5 ± 6. 3 Pitavastatin 4 8 ~ 12 Fluvastatin 60 12 Simvastatin 28. 9 ± 10. 0 17. 8 ± 6. 5 Pravastatin 34. 8 ± 9. 9 15. 4 ± 5. 0 (BMC Cardiovasc Disord 2014; 14: 60 Doi: 10. 1186/1471 -2261 -14 -60
Meta-analysis of the effects of LDL-C lowering by different Statins on the regression of coronary atherosclerotic plaque (CAP) • Outcome measures: § Regression of CAP by intravascular ultrasound (IVUS) § Standardized mean difference (SMD) of the volume (mm 3) of CAP between the baseline and follow-up • Main findings: Mean LDL-C at Mean decrease baseline (mg) Follow-up (mg) (%) SMD (mm 3) P-value 120. 0 ± 8. 2 60. 6 ± 3. 5 48. 8 ± 3. 3 -0. 156 0. 000 123. 7 ± 13. 4 66. 8 ± 8. 0 45. 4 ± 2. 8 -0. 108 0. 002 132. 4 ± 12. 9 77. 8 ± 7. 0 40. 4 ± 4. 0 -0. 123 0. 001 (BMC Cardiovasc Disord 2014; 14: 60 Doi: 10. 1186/1471 -2261 -14 -60
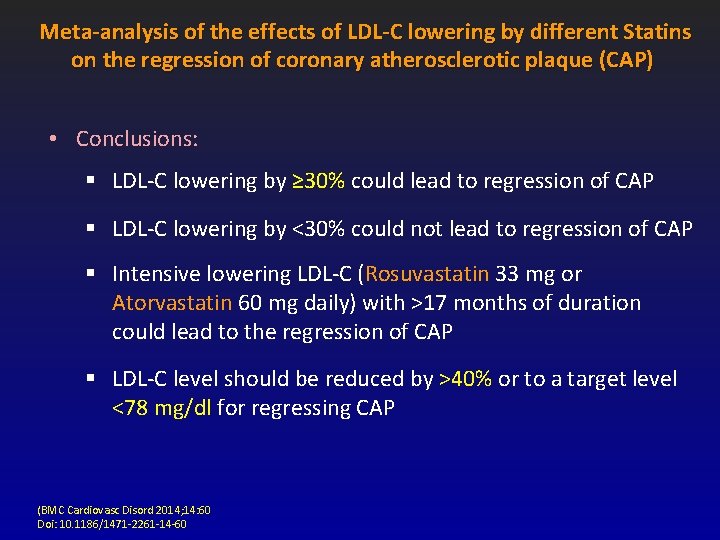
Meta-analysis of the effects of LDL-C lowering by different Statins on the regression of coronary atherosclerotic plaque (CAP) • Conclusions: § LDL-C lowering by ≥ 30% could lead to regression of CAP § LDL-C lowering by <30% could not lead to regression of CAP § Intensive lowering LDL-C (Rosuvastatin 33 mg or Atorvastatin 60 mg daily) with >17 months of duration could lead to the regression of CAP § LDL-C level should be reduced by >40% or to a target level <78 mg/dl for regressing CAP (BMC Cardiovasc Disord 2014; 14: 60 Doi: 10. 1186/1471 -2261 -14 -60
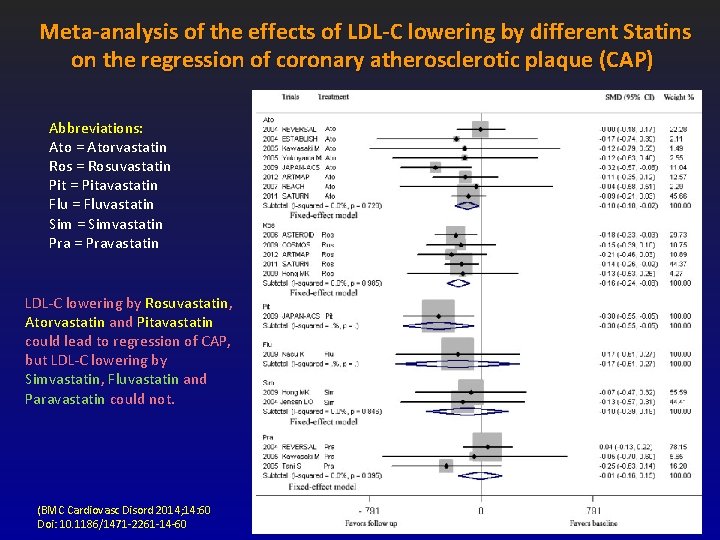
Meta-analysis of the effects of LDL-C lowering by different Statins on the regression of coronary atherosclerotic plaque (CAP) Abbreviations: Ato = Atorvastatin Ros = Rosuvastatin Ros Pit = Pitavastatin Pit Flu = Fluvastatin Flu Sim = Simvastatin Sim Pra = Pravastatin Pra LDL-C lowering by Rosuvastatin, Atorvastatin and Pitavastatin could lead to regression of CAP, but LDL-C lowering by Simvastatin, Fluvastatin and Paravastatin could not. (BMC Cardiovasc Disord 2014; 14: 60 Doi: 10. 1186/1471 -2261 -14 -60
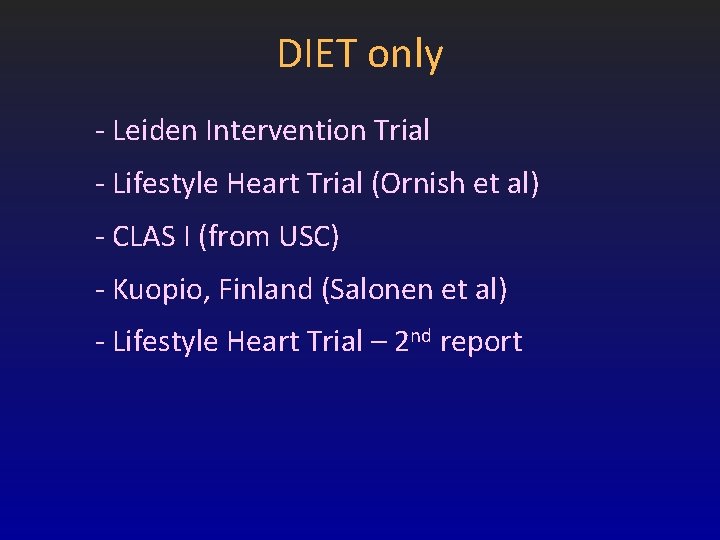
DIET only - Leiden Intervention Trial - Lifestyle Heart Trial (Ornish et al) - CLAS I (from USC) - Kuopio, Finland (Salonen et al) - Lifestyle Heart Trial – 2 nd report
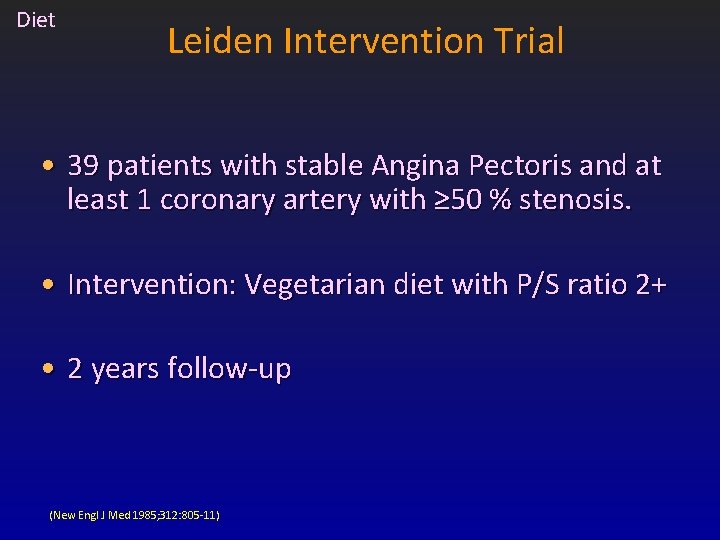
Diet Leiden Intervention Trial • 39 patients with stable Angina Pectoris and at least 1 coronary artery with ≥ 50 % stenosis. • Intervention: Vegetarian diet with P/S ratio 2+ • 2 years follow-up (New Engl J Med 1985; 312: 805 -11)
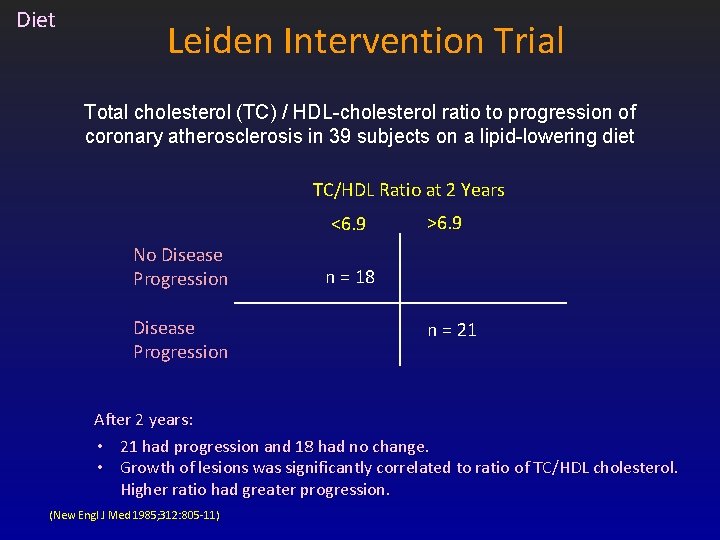
Diet Leiden Intervention Trial Total cholesterol (TC) / HDL-cholesterol ratio to progression of coronary atherosclerosis in 39 subjects on a lipid-lowering diet TC/HDL Ratio at 2 Years <6. 9 No Disease Progression >6. 9 n = 18 n = 21 After 2 years: • 21 had progression and 18 had no change. • Growth of lesions was significantly correlated to ratio of TC/HDL cholesterol. Higher ratio had greater progression. (New Engl J Med 1985; 312: 805 -11)
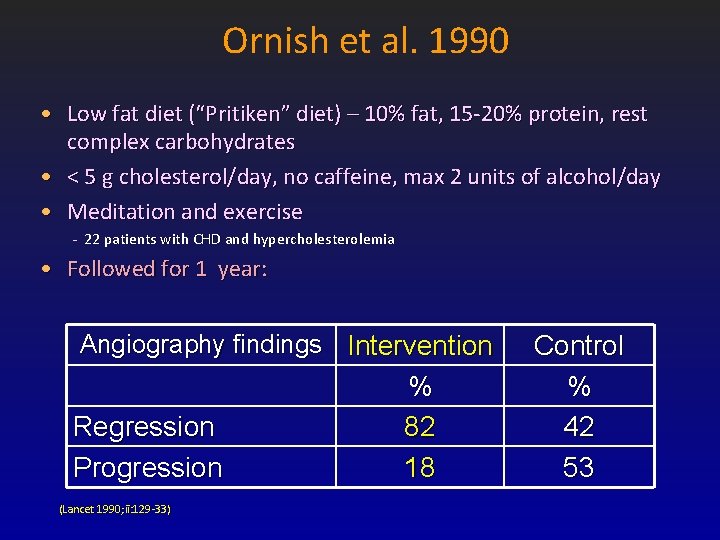
Ornish et al. 1990 • Low fat diet (“Pritiken” diet) – 10% fat, 15 -20% protein, rest complex carbohydrates • < 5 g cholesterol/day, no caffeine, max 2 units of alcohol/day • Meditation and exercise - 22 patients with CHD and hypercholesterolemia • Followed for 1 year: Angiography findings Intervention Regression Progression (Lancet 1990; ii: 129 -33) % 82 18 Control % 42 53
Ornish et al. 1990 Weaknesses of study: – Not randomized – Self selection and thus highly motivated for diet change.
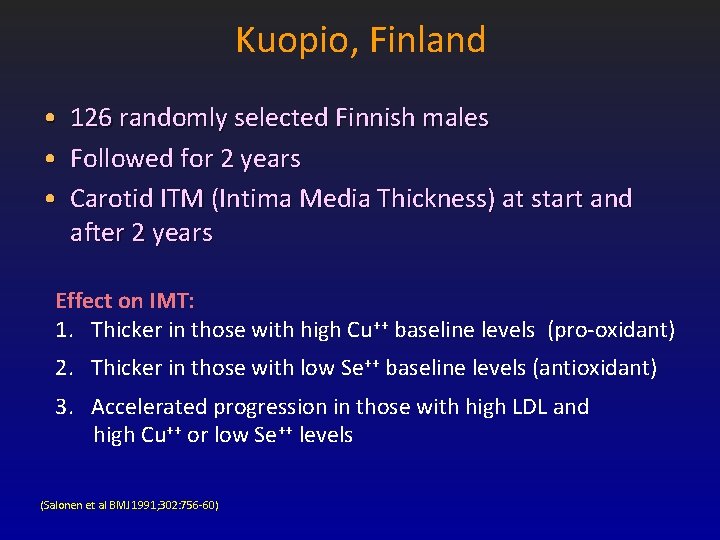
Kuopio, Finland • • • 126 randomly selected Finnish males Followed for 2 years Carotid ITM (Intima Media Thickness) at start and after 2 years Effect on IMT: 1. Thicker in those with high Cu++ baseline levels (pro-oxidant) 2. Thicker in those with low Se++ baseline levels (antioxidant) 3. Accelerated progression in those with high LDL and high Cu++ or low Se++ levels (Salonen et al BMJ 1991; 302: 756 -60)
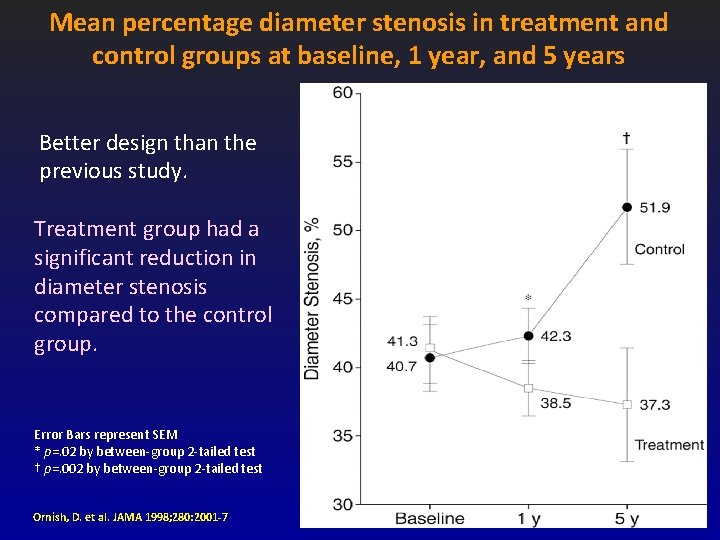
Mean percentage diameter stenosis in treatment and control groups at baseline, 1 year, and 5 years Better design than the previous study. Treatment group had a significant reduction in diameter stenosis compared to the control group. Error Bars represent SEM * p=. 02 by between-group 2 -tailed test † p=. 002 by between-group 2 -tailed test Ornish, D. et al. JAMA 1998; 280: 2001 -7
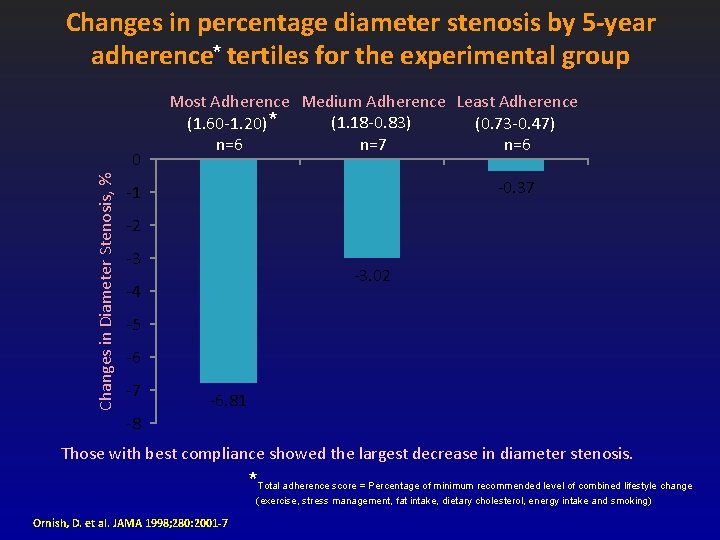
Changes in percentage diameter stenosis by 5 -year adherence* tertiles for the experimental group Changes in Diameter Stenosis, % 0 Most Adherence Medium Adherence Least Adherence (1. 18 -0. 83) (1. 60 -1. 20) * (0. 73 -0. 47) n=7 n=6 -0. 37 -1 -2 -3 -3. 02 -4 -5 -6 -7 -6. 81 -8 Those with best compliance showed the largest decrease in diameter stenosis. *Total adherence score = Percentage of minimum recommended level of combined lifestyle change (exercise, stress management, fat intake, dietary cholesterol, energy intake and smoking) Ornish, D. et al. JAMA 1998; 280: 2001 -7
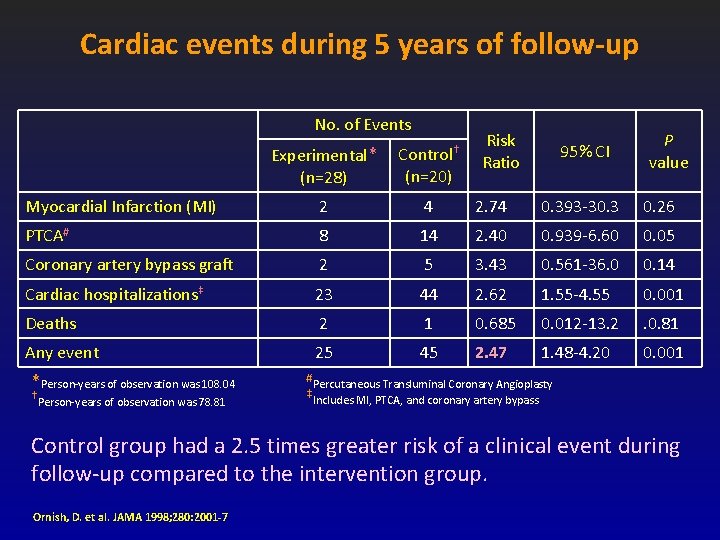
Cardiac events during 5 years of follow-up No. of Events Risk Ratio 95% CI P value Experimental* (n=28) Control† Myocardial Infarction (MI) 2 4 2. 74 0. 393 -30. 3 0. 26 PTCA# 8 14 2. 40 0. 939 -6. 60 0. 05 Coronary artery bypass graft 2 5 3. 43 0. 561 -36. 0 0. 14 Cardiac hospitalizations‡ 23 44 2. 62 1. 55 -4. 55 0. 001 Deaths 2 1 0. 685 0. 012 -13. 2 . 0. 81 Any event 25 45 2. 47 1. 48 -4. 20 0. 001 *Person-years of observation was 108. 04 †Person-years of observation was 78. 81 (n=20) #Percutaneous Transluminal Coronary Angioplasty ‡Includes MI, PTCA, and coronary artery bypass Control group had a 2. 5 times greater risk of a clinical event during follow-up compared to the intervention group. Ornish, D. et al. JAMA 1998; 280: 2001 -7
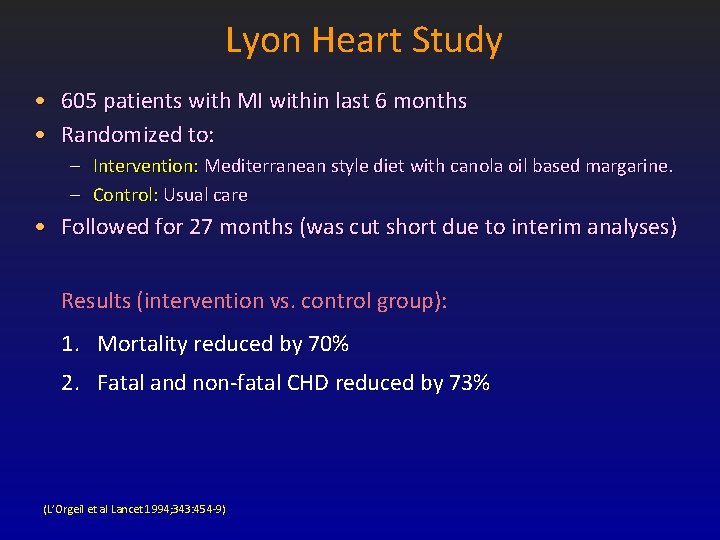
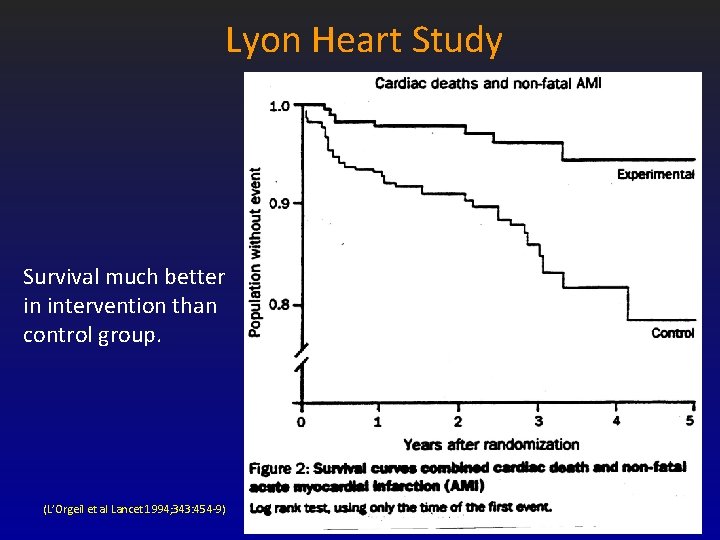
Lyon Heart Study • 605 patients with MI within last 6 months • Randomized to: – Intervention: Mediterranean style diet with canola oil based margarine. – Control: Usual care • Followed for 27 months (was cut short due to interim analyses) Results (intervention vs. control group): 1. Mortality reduced by 70% 2. Fatal and non-fatal CHD reduced by 73% (L’Orgeil et al Lancet 1994; 343: 454 -9)
Lyon Heart Study Survival much better in intervention than control group. (L’Orgeil et al Lancet 1994; 343: 454 -9)
Lyon Heart Study Potential problems/weaknesses: – Hawthorne effect (Intervention had more close and frequent follow-up than control group) (L’Orgeil et al Lancet 1994; 343: 454 -9)
Conclusion • Regression of atherosclerosis is possible • Both dietary changes and drugs can bring about regression