EPDM 509 Case Report Case Series Ecologic Studies


 and pulmonary embolism § UK 1961: A case report")
 • A sequence of case reports with common elements such as")
 • • Are not planned studies Do not involve any research")


 Aim: To measure the")


 (Aggregate risk study) u Study using data from POPULATIONS •")
 (Aggregate risk study) u Unit of analysis: Populations or groups")

 Known: u # of exposed persons u # of cases")


 § Unit of analysis: Individuals § Measurements: • Prevalence of")


 • Time-sequence not clear •")


- Slides: 47
EPDM 509 Case Report / Case Series Ecologic Studies Cross-sectional Studies Observational Studies Lecture 6 A R Knutsen
Objectives You will be able to: • Describe the key characteristics of the different types of studies: case reports, case-series, cross-sectional and ecologic studies • List the advantages and disadvantages of each type of study • Describe the “ecological fallacy”
Why do Epidemiologic Study? To deal with a health problem we must: 1. Describe its distribution in the population 2. Get precise and valid information about its causes, prevention and treatment 3. Understand its cause-and-effect relationship with a specific risk factor
Types of Studies • Experimental Studies Intervention studies where the investigators have control over the intervention or exposure status of the subjects • Observational Studies where the investigators collect, record an analyze data on subjects as they naturally divide themselves by certain variables
Types of Observational Design Depends on hypothesis & present knowledge: 1. Descriptive designs - Describes what exists 2. Hypothesis generating designs - Simple observational designs 2. Designs to tests causal relationships - More complicated observational designs
Types of Studies Observational – 2 types: • Descriptive - No specific a priori* hypothesis to test - Describes what exists • Analytic - Designed to test a priori* hypothesis about associations between specified exposures and outcomes. * Before examination or analysis
Study Designs Observational Descriptive Studies Case Report Analytic Studies Ecologic/ * Correlation Case Series Prevalence Surveys Cross* Sectional Case-Control Migrant Studies Experimental Non-Controlled, Non-Randomized Trials Randomized Controlled Trials Clinical Trials (RCT) Field Trials Community Trials Case. Crossover Cohort * May test preliminary hypothesis as a basis for future studies
Case Reports § Clinical detailed description of a single patient. § Usually describes an unusual feature or unusual association between the disease and some exposure factor. § No control group. § NEVER use case reports to make treatment decisions. - E. g. 23 -years-old man with treatment-resistant TB.
Case Reports Oral contraceptives (OC) and pulmonary embolism § UK 1961: A case report described development of § pulmonary embolism in a pre-menopausal, 40 -year old woman five weeks after she was started on OC because of endometriosis. OC was an novel exposure at that time, and pulmonary embolism is rare in 40 -year old women. Jordan WM. Lancet 1961; 2: 1146
Case Series (Descriptive) • A sequence of case reports with common elements such as similar clinical features and suspected common exposures • Cases are usually seen over a relatively short period of time • Can help identify potential health problems - valuable early indicators of new clinical syndromes or epidemics (e. g. , AIDS) • Can be valuable early evidence for associations between exposures and diseases (e. g. , 5 cases of mesothelioma in asbestos production workers) • Important descriptive role as a precursor to other studies
Case Series (Descriptive) • • Are not planned studies Do not involve any research hypothesis Cannot disclose patterns of disease occurrence Have no control group, but may occasionally include control subjects (e. g. people who declined treatment) • Provide little or no evidence of causality • NEVER use case series to make treatment decisions – E. g. patients at a local hospital with treatment-resistant TB • Frequently leads to generation of hypothesis
Case Series Rubella and congenital cataracts § Australia 1941: A series of infants born with § congenital cataracts Some in addition had cardiac abnormalities. A severe epidemic of rubella (German measles) had occurred 6 -9 months earlier. A causal link was postulated between rubella in the mother and congenital cataracts. Gregg N. N. Australian and New Zealand Journal of Ophtalmology 1991 (Reprint); 19: 267 -276.
Case Series AIDS example § Between October 1980 and May 1981, 5 cases of Pneumocystis Carinii pneumonia were reported in young, young apparently healthy, healthy homosexual men in Los Angeles. § This series was unusual because this disease is usually seen among elderly with poor immune systems due to chemotherapy. Gottlieb MS et al. N Engl J Med 1981; 305: 1425
Case Series AIDS example • In 1981, an unusual number of young homosexual men were diagnosed with Kaposi’s sarcoma The CDC initiated a surveillance program. • Subsequent analyses of case reports identified homosexual men, IV drug users, users and recipients of blood transfusions as being high risk---suggesting a bloodborne acquired immune deficiency disease.
Case Series Advantages • Inexpensive • High learning value; can generate hypotheses • Can serve as early indicators of new diseases and epidemics • Can easily be converted to a case-control design (by adding controls) Disadvantages • No cause-effect interpretation possible • Without a control group the case series can result in false leads, wasted energy and resources.
Prevalence Surveys Descriptive part of a Prevalence Study (Cross-Sectional Study) Aim: To measure the prevalence of diseases and other health aspects such as: - Fibromyalgia / chronic pain - Obesity - Smoking - Diet - Sun-exposure - Use of certain health services
Prevalence Surveys § Purely descriptive. § Often used to aid Health Planning § May collect large amount of information - Make possible more in-depth analysis (crosssectional study) of the relationships between: • Health behaviors (risk factors) factors and • Certain conditions (outcomes) outcomes
Migrant Studies § Prevalence surveys / studies in more than one population, population but with same ethnicity Look at prevalence of diseases, risk factors, etc. § § Separate the effects of: - Genetic factors (nature), and - Environmental factors (lifestyle, diet) REMEMBER!!
Migrant Studies Native populations Low-risk High-risk Migrant populations Genetically determined disease: MIGRATION Rate After Before Environmentally determined disease: MIG Rate RAT IO N Before After
Migrant Studies § “Natural experiments” involving: - Large number of people - Same ethnicity - Different environmental exposures • Migrating from a low-risk country, or vice • versa To a high-risk country, or vie versa
Migrant Studies Example – Ni-Hon-San Study Japanese migrated from Japan to Hawaii and California. CHD have changed dramatically in 1 -2 generations: - Low in japanese in Japan - Higher in japanese in Hawaii - Highest in japanese in California • Migrated from a low-risk country • To a high-risk country Strongly indicates the importance of environmental factors
Migrant Studies Example – Ni-Hon-San Study Japanese migrated from Japan to Hawaii and California. Stroke and stomach cancer have changed rapidly: - High in japanese in Japan - Lower in japanese in Hawaii - Lowest in japanese in California • Migrated from a high-risk country • To a low-risk country Strongly indicates the importance of environmental factors
Migrant Studies Example – Other Studies Chinese, Japanese and Filipino women migrating to Hawaii and California. Breast cancer have changed dramatically within one or two generations: - Low in Asians in Asia - Higher in Asians in Hawaii - Highest in Asians in California • Migrated from low-risk countries • To a high-risk country Strongly indicates the importance of environmental factors J Natl Cancer Inst 1993; 85: 1819 -1827
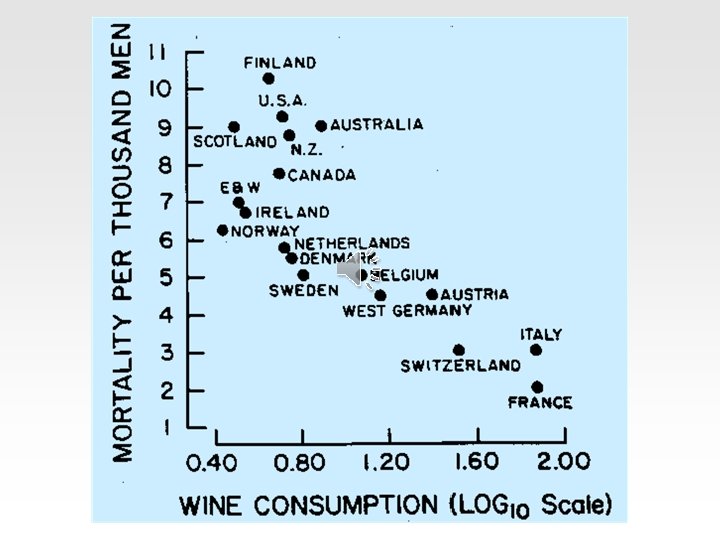
Ecologic Study (Correlation Study) (Aggregate risk study) u Study using data from POPULATIONS • The prevalence of a suspected risk factor is measured in different populations and compared with the population incidence under study (correlation study) • Already existing (collected) data from different sources: - Census - Mortality statistics - GDP (gross domestic product) - Per Capita Consumption, etc.
Ecologic Study (Correlation Study) (Aggregate risk study) u Unit of analysis: Populations or groups of people (Countries / states, counties, religious groups, different races, etc. ) u Measurements: Population measures ( e. g. Prevalence and mortality rates) u Measure of effect: - Correlation (r) = +/- 0 to 1 - Regression (y=a+bx) = “line of best fit”
Correlation between per capita meat intake and incidence of colon cancer in women in 23 countries.
Ecologic Study (Correlation Study) Known: u # of exposed persons u # of cases Not known: u # of exposed cases individuals are characterized by the average exposure for that population
Relation of national per capita fat intake with risk of breast cancer mortality. (Carroll, 1975, reproduced with permission. )
Dietary fat intake of five ethnic groups in Hawaii in relation to age-adjusted cancer incidence among men and women 45 yrs. of age or older. (From Kolonel et al. , 1981; reproduced with permission). INCIDENCE PER 100, 000 MALES COLON Chinese 100 FEMALES Caucasian Japaneses Chinese Caucasian Japaneses COLON 60 75 50 50 Filipino 40 Hawaiian 25 Filipino 30 INCIDENCE PER 100, 000 PROSTATE BREAST Caucasian 100 50 300 Caucasian Hawaiian 150 Hawaiian Filipino Japaneses Chinese 55 60 65 70 75 80 TOTAL FAT (GM/DAY) 200 Chinese Japaneses 100 Filipino 45 50 55 60 65 TOTAL FAT (GM/DAY)
Ecologic Studies • Often geographical areas are used as the basis for clustering (thus term ecological) • In Ecological Studies a summary measure of disease is associated with a summary measure of exposure. • Data on summary measures are usually collected at different times for different purposes • Only used to generate hypothesis based on findings of association • These studies are liable to “ecologic fallacy”. An error of reasoning: when a risk factor and disease are associated at the population level, but not at the individual subject level.
Ecological Studies Advantages: 1. 2. 3. 4. Easy to conduct Inexpencive – data are available from other sources Hypothesis generating Can examine broad trends across diseases and exposures 5. Rare causes 6. Time relationship: cause-to-effect Only in some instances: Before – after - Smoking ban - Seat belt enforcement
Ecological Studies Disadvantages: 1. Cannot test hypothesis no cause-and-effect interpretation possible 2. Time sequence not clear of exposure (risk factor) and effect (disease). What was first: the hen or the egg? 3. Possibility of “ecological fallacy” Risk factor and disease associated at population level, but not at the individual level.
Firearms and Suicide in the United States Markush & Bartolucci, AJPH, 1984 Average Pistol Prevalence (%) Firearm Suicide Rate (4 year mean) per 100, 000 Person-Years New England 5. 6 3. 8 Mid-Atlantic 10. 9 3. 3 East North Central 18. 2 5. 9 West North Central 18. 0 6. 6 South Atlantic 28. 9 9. 0 East South Central 35. 6 9. 0 West South Central 29. 8 8. 8 Mountain 34. 7 11. 2 Pacific 19. 3 8. 2 Region
Household Pistol Prevalence and Suicide Rate: 9 U. S. Regions* Correlation = 0. 92 P < 0. 0004 Source: Markush & Bartolucci, AJPH, 1984 * 4 -year mean
Cross-Sectional Study • Data from INDIVIDUALS are collected at one point in time • A “point-in-time” picture of health/disease status, health-related behaviors, and other exposure factors Time Demographics Exposure Disease
Cross-Sectional Study (“Prevalence” Study) § Unit of analysis: Individuals § Measurements: • Prevalence of disease/exposure - in a defined population - in different exposure groups § Measures of effect: – prevalence – Correlation (r) = -1 to +1 – ”rate” ratio = prevalence ratio (PR)
Point prevalence = # of existing cases of disease at time t total population at time t Correlation – is there a linear relationship? r = +/- (0 to 1) Regression = ”Line of best fit”. If all points are at the regression line, correlation = +/-1 y . . . y = a + bx b = slope = regression coefficient a = y intercept (x=0) x
Proportion = Ratio = A A + B A Rate = - dimensionless - 0 to ± 1 - “rate” x (A+B) T A B “Rate” = Proportion K K is a multiplier or constant used to convert a fraction to a whole number and to compare different populations. T is time (Where ‘A’ and ‘B’ are mutually exclusive)
“Rate” = Proportion “Rate” Ratio = Ratio of two Proportions = Ratio of two Prevalences or two Incidences = Prevalence Ratio or Incidence ratio “Rate” Ratio = Using prevalences: “Rate” Ratio = IE IE = Incidence (risk) in exposed IO IO = Incidence (risk) in unexposed PE PE = Prevalence exposed PO PO = Prevalence unexposed
Cross-Sectional Study Advantages Disadvantages • Easy to conduct (screening) • Time-sequence not clear • Cost-effective • Hypothesis generating • Can show strong associations between risk factors and diseases. • Cannot test hypothesis. No strong causeeffect interpretation possible, (but can help identify likely causal factors). • Difficult to assess seasonal or periodic variability in disease. • Difficult to assess diseases of short duration. • Can be affected by bias: - Selection bias (e. g. , use of telephones) - Information bias (report bias, recall bias, interviewer bias). - Confounding
Examples: Cross-sectional 1. In the city of Greenville, 2, 000 have their blood pressure measured and are asked about the daily number of cigarettes smoked 2. In a large city, cases of suicide during six months are identified and family members are asked about the person’s level of selfesteem at the time of death
1. Smoking and Blood Pressure 170 Systolic BP 150 130 110 0 10 20 30 40 Cigarettes smoked daily 50
2. Self-esteem and Suicide Level of Self-esteem High # of Suicides/100, 000 7 Average 23 Low 34
Adjusted Mean Levels of Serum Total Cholesterol in 7121 Men and 6837 Women, According to Coffee Consumption. * The Tromso Heart Study. Cups Per Day Total Cholesterol (mmol/l) <1 Men 5. 56 ± 0. 05 Women 5. 32 ± 0. 05 1 -4 5. 89 ± 0. 02 5. 6 ± 0. 02 5 -8 6. 07 ± 0. 02 5. 70 ± 0. 02 9+ P values ‡ Equality Linear trend 6. 23 ± 0. 03 5. 92 ± 0. 04 0. 000 * Adjusted for age, body-mass index, physical activity in leisure time, cigarette and alcohol consumption, . Values are expressed as means ± S. E. M. ‡ Tested for coffee categories.
Adjusted Mean Levels of Serum Total Cholesterol in 7121 Men and 6837 Women, According to Coffee Consumption. * The Tromso Heart Study. Cups of coffee/day * Adjusted for age, BMI, physical activity in leisure time, cigarette and alcohol consumption.
Summary Key points: • Characteristics, advantages and disadvantages: – case report studies – case-series studies – cross-sectional studies – ecologic studies • Ecological fallacy